Child and parental wellbeing: measuring outcomes and understanding their relation with poverty
Enhancing wellbeing is a crucial element of supporting the lives of children, young people and families living in poverty. This report represents a first step in assessing wellbeing outcomes and understanding their relation with poverty for low income families.
How I grow and develop
Key messages
The ongoing cost of living crisis is impacting upon the mental health of both parents and children. For many households, the cost of living crisis has resulted in a lack of social connection, and increased isolation.
Children living in areas of high deprivation continue to record greater developmental concerns in the early years, lower attainment while in school, were less likely to undertake physical activities in their early teenage years and recorded greater difficulties with their mental health.
Over recent years, there is evidence of a reduction in the poverty related gap across these measures, particularly in terms of attainment. However, it should be noted that during the COVID-19 pandemic there was a clear widening of the poverty related attainment gap, which has started to reduce again in the years since.
The policy context
Best Start, Bright Futures (BSBF) works towards a vision for Scotland to be the best place for children and young people to grow up. The aim is that every child grows up feeling loved, safe and respected so that they realise their full potential.
The ongoing cost of living crisis is significantly impacting upon the mental health of both parents and children. Additionally, the cost of living crisis has resulted in a lack of social connection, and increased isolation, for many households. This is on the back of a period of intensive isolation arising from when stay at home regulations were in place during the COVID-19 pandemic. The negative impacts of a lack of social interaction on loneliness and mental wellbeing are well documented. Low income households are particularly at risk of financial stress, leading to lower levels of mental wellbeing.[14]
Policies supporting the longer term wellbeing of children are not expected to reduce poverty levels in time to achieve the 2030 targets. Nevertheless, these policies are essential so that the progress achieved towards the 2030 targets is sustained. This is a long term vision to ensure that the children of today do not become the parents of children living in poverty in the future.
In this space, we find policies that:
- support the best start to life. There are many policies as part of BSBF in this space. For example, policies that support high quality and affordable childcare provision, social security payments and benefits in-kind such as the Baby Box and the five family payments including the Scottish Child Payment. Further, there are policies supporting the strategic implementation of wellbeing such as Getting It Right for Every Child (GIRFEC) or the Whole Family Wellbeing Fund. In addition, there is also practical health support provided through the Universal Health Visiting Pathways or the Family Nurse Partnership programme for young mothers.
- support children to grow and learn. For example, the Scottish Attainment Challenge which aims to reduce the poverty related attainment gap, removing the digital divide by ensuring that all children (from primary to higher education) have access to the necessary technology, providing infrastructure that supports health and active lifestyles through the Active Schools programme, the free bikes pilot scheme or the investment in outdoor playgrounds.
- and foster positive post-school transitions. Policies such as the Young Person's Guarantee, the Scottish Mentoring and Leadership programme, Job Start Payment, Higher Education Student Support or the School leavers toolkit are designed to foster positive post school transitions for young people.
All these policies are expected to support positive progress towards all indicators in this section. Indeed, many individual policy evaluations do track the impact they can contribute to on relevant indicators. Where appropriate we have linked up to the specific policy evaluation for further information.
Pre-school development
The pre-school development indicator is the percentage of children with a developmental concern at their 27-30 month child health review.
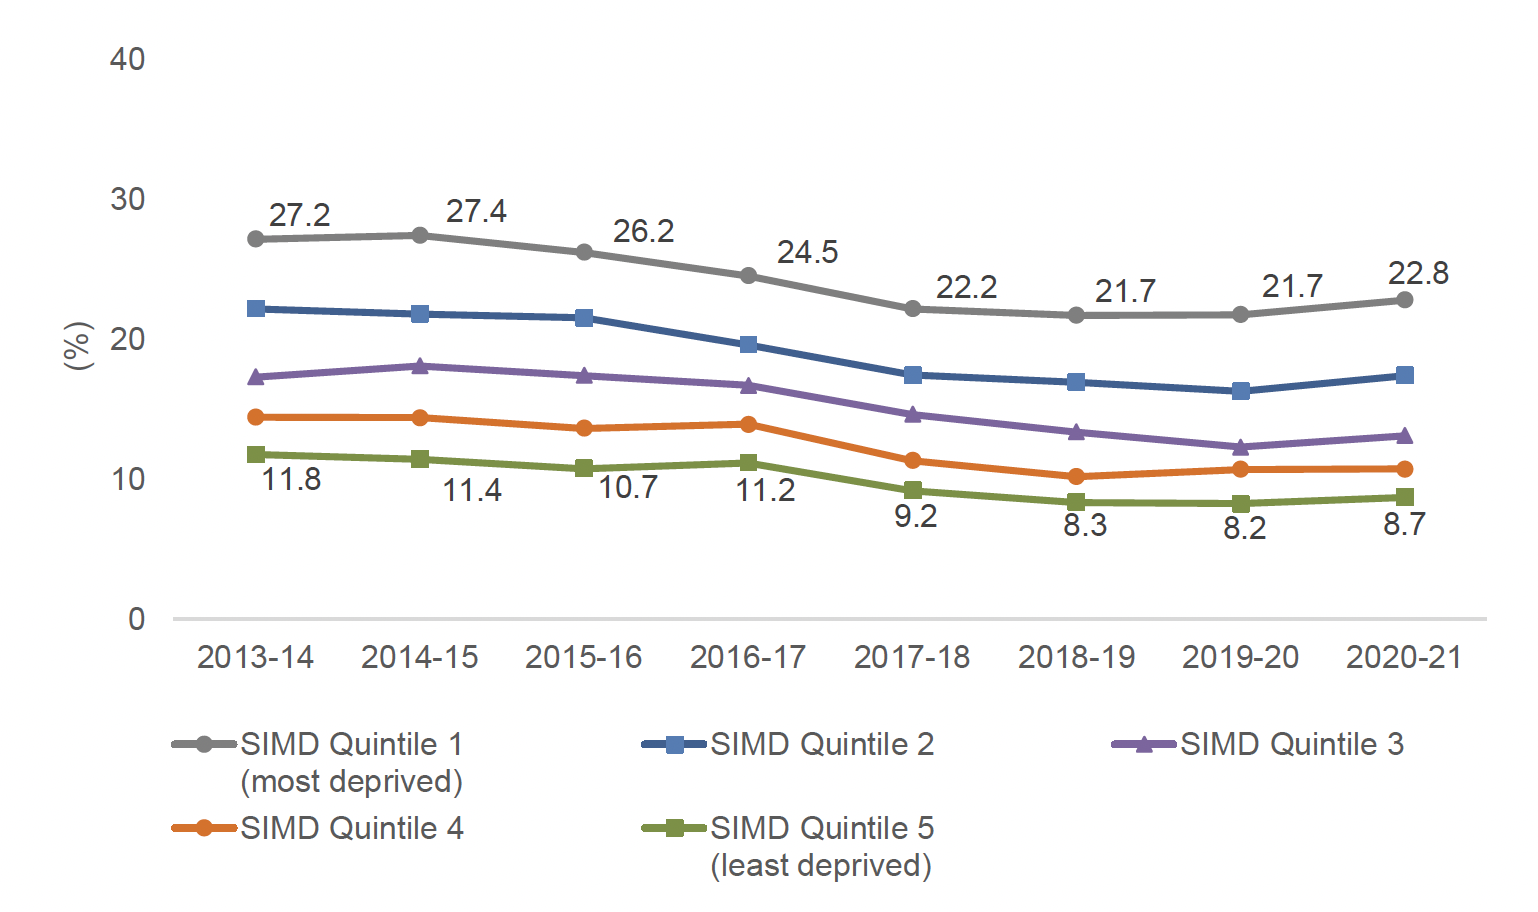
In 2021/22, 18% were reported as having a developmental concern at their 27-30 month review. Between 2014/15 and 2019/20 developmental concerns at the 27-30 month review fell from 19% to 14%, respectively. However, this figure has risen in recent years. Research suggests that recent rises in developmental concerns may be associated with the COVID-19 pandemic – with associated lockdown measures limiting opportunities for social communication[15] and physical development[16].
 SIMD quintiles."/>
There is an association between higher levels of area deprivation and increasing likelihood of a developmental concern at the 27-30 month review over time. Figure 2 illustrates this trend with the gap between the most deprived and least deprived areas remaining relatively constant over time.
This gap in developmental concerns by area deprivation, which arises during the early years, is evident across the evidence base and can have significant consequences in the longer-term for academic achievement, which may impact on later life wellbeing outcomes for children. [17],[18]
Literacy
The literacy indicator considers the proportion of all primary school pupils (P1, P4 and P7 combined) achieving the expected Curriculum for Excellence (CfE) level for literacy. To achieve this, children need to achieve the expected level in all three literacy organisers: reading, writing, and listening and talking.
For all P1, P4 and P7 pupils, 73% achieved the expected CfE level in literacy in 2022/23.
of P1, P4 and P7 pupils (combined) achieving expected CfE level in Literacy
 CfE level in Literacy. There are two data points represented under each time period. The blue dots represent data from those in SIMD Quintile 1 and the grey dots represent the data from those in SIMD Quintile 5."/>
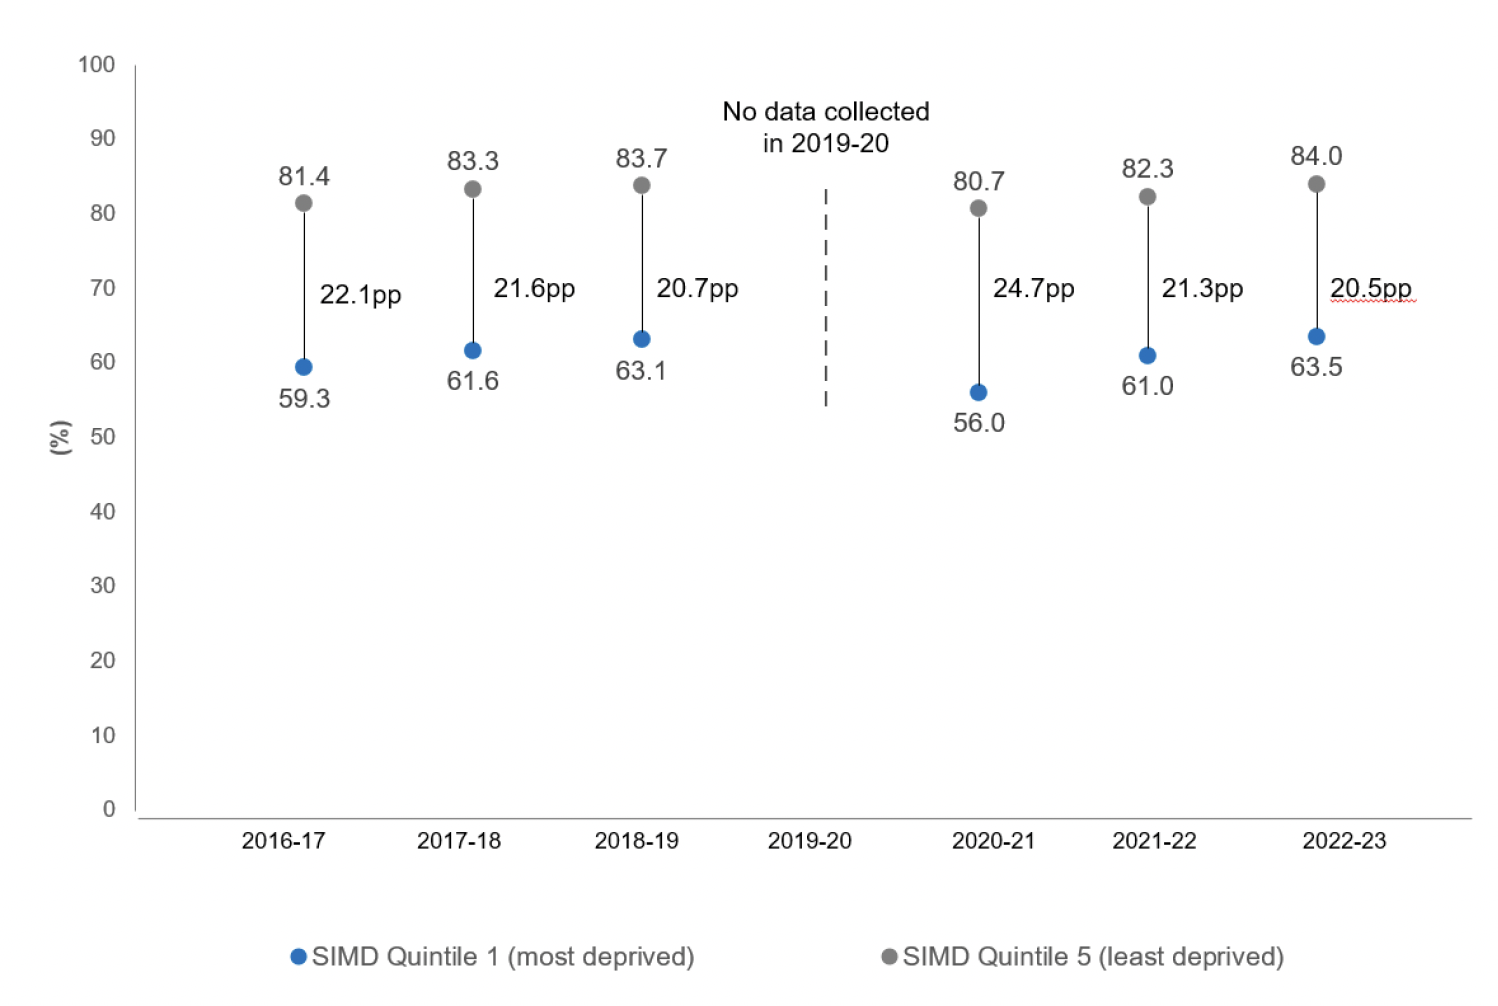
When literacy achievement is analysed by SIMD, there is a persistent gap between children living in the most deprived areas and those living in the least deprived areas. As illustrated in Figure 3, in 2022/23, 64% of children living in the most deprived areas (SIMD 1) achieved the expected CfE level in literacy, compared to 84% of those living in the least deprived areas (SIMD 5). This is a difference of 20.5 percentage points. This poverty related attainment gap does appear to be persistent over time. However, prior to the COVID-19 pandemic the gap between the highest and lowest areas of deprivation was slowly but steadily reducing. Following the pandemic, the poverty related attainment gap in literacy stood at 24.7 percentage points in 2020/21 and positively reduced again to 21.3 in 2021/22, before falling further to 20.5 in 2022/23. This is the smallest reported gap on record.
As reported in the fifth interim report of the Attainment Scotland Fund evaluation increasing levels of children were meeting expected levels across literacy until 2020/21. Therefore, it is important to consider the impact of COVID-19 on progress in closing the attainment gap, as a result of school building closures and other disruptions.
Across other evidence sources, the poverty related literacy gap is seen across other measures of poverty and deprivation, such as family income or parental level of education. For example, the Growing Up in Scotland study evidences how a gap in language ability, based on measures of poverty, with more advantaged children having higher language abilities than children from less advantaged backgrounds, build during the early years of a child's life[19] - and this gap is maintained during primary school.[20]
Numeracy
The numeracy indicator considers the proportion of all primary school pupils (P1, P4 and P7 combined) achieving the expected CfE level in numeracy.
For all P1, P4 and P7 pupils, 80% achieved the expected CfE level in numeracy in the most recent year 2022/23.
 CfE level in Numeracy. There are two data points represented under each time period. The blue dots represent data from those in SIMD Quintile 1 and the grey dots represent the data from those in SIMD Quintile 5."/>
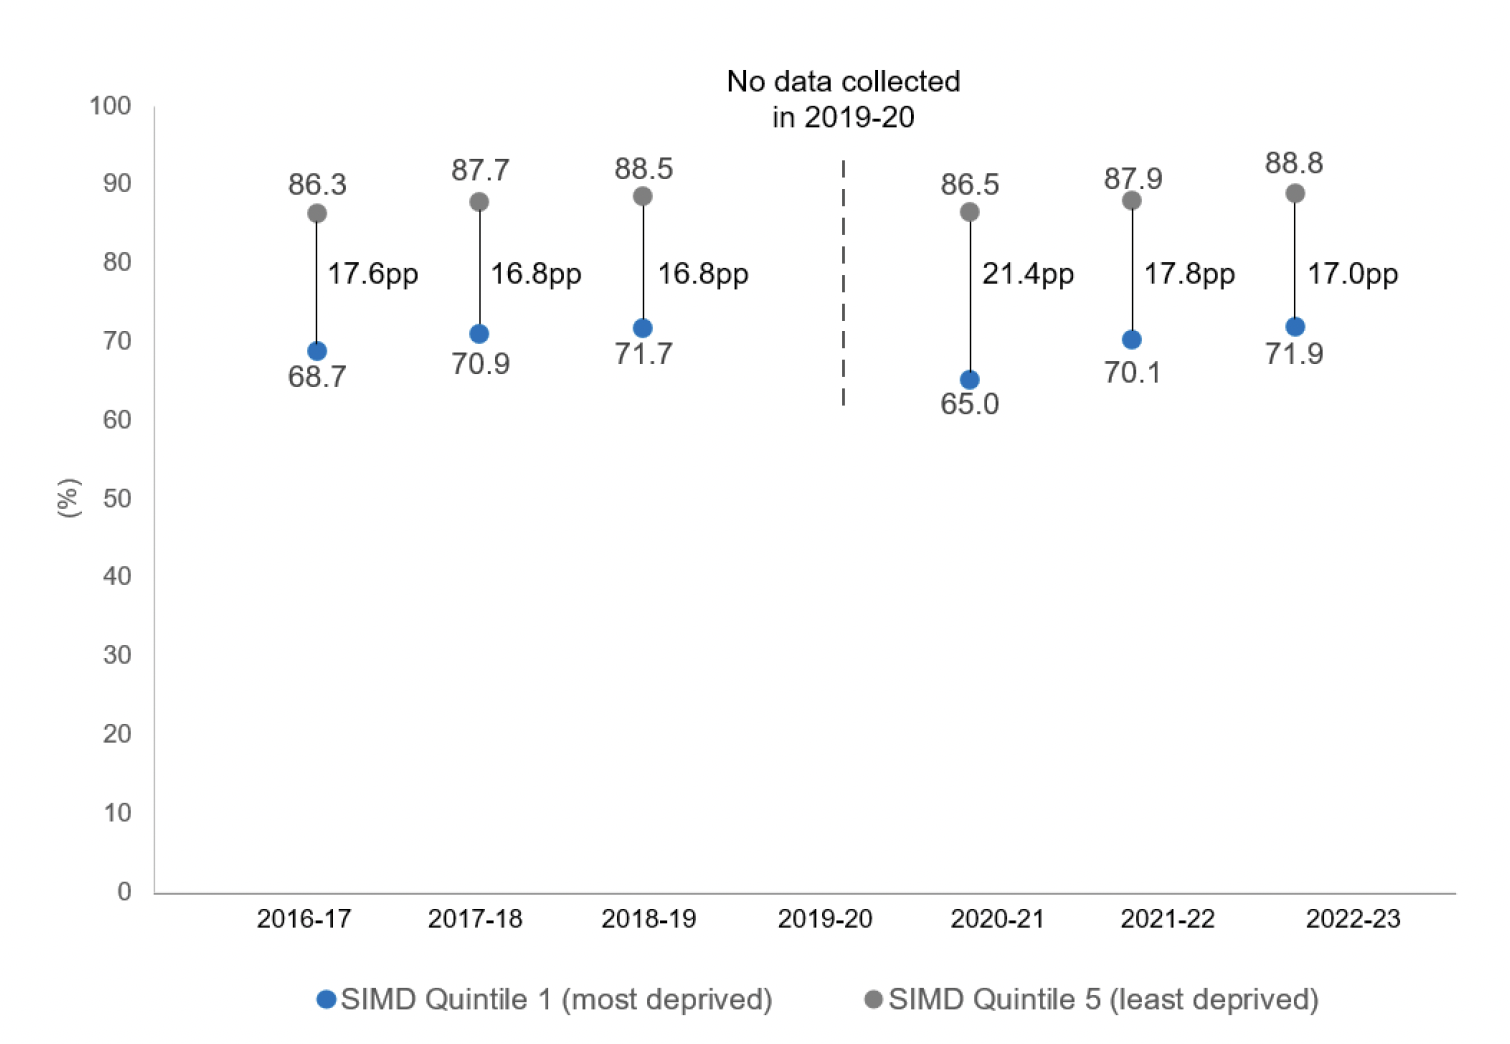
As seen in Figure 4, there is a consistent gap between children living in the most deprived areas and those living in the least deprived areas. In 2022/23, 72% of children living in the most deprived areas (SIMD 1) achieved the expected CfE level in numeracy, compared to 89% of those from the least deprived areas (SIMD 5). This is a percentage point difference of 17.0. This is slightly wider than the gap in 2018/19 (16.8 percentage points), but it is a decrease compared to the 2020/21 gap following the COVID-19 pandemic which led to a sharp increase to 21.4.
As reported in the fifth interim report of the Attainment Scotland Fund evaluation increasing levels of children were meeting expected levels across numeracy until 2020/21. Therefore, it is important to consider the impact of COVID-19 on progress in closing the attainment gap, as a result of school building closures and other disruptions.
Positive Destinations
The positive destinations of schools leavers indicator is the percentage of all school leavers in positive destinations nine months after the end of the school year. Positive destinations include: higher education, further education, training, voluntary work, and employment amongst others.
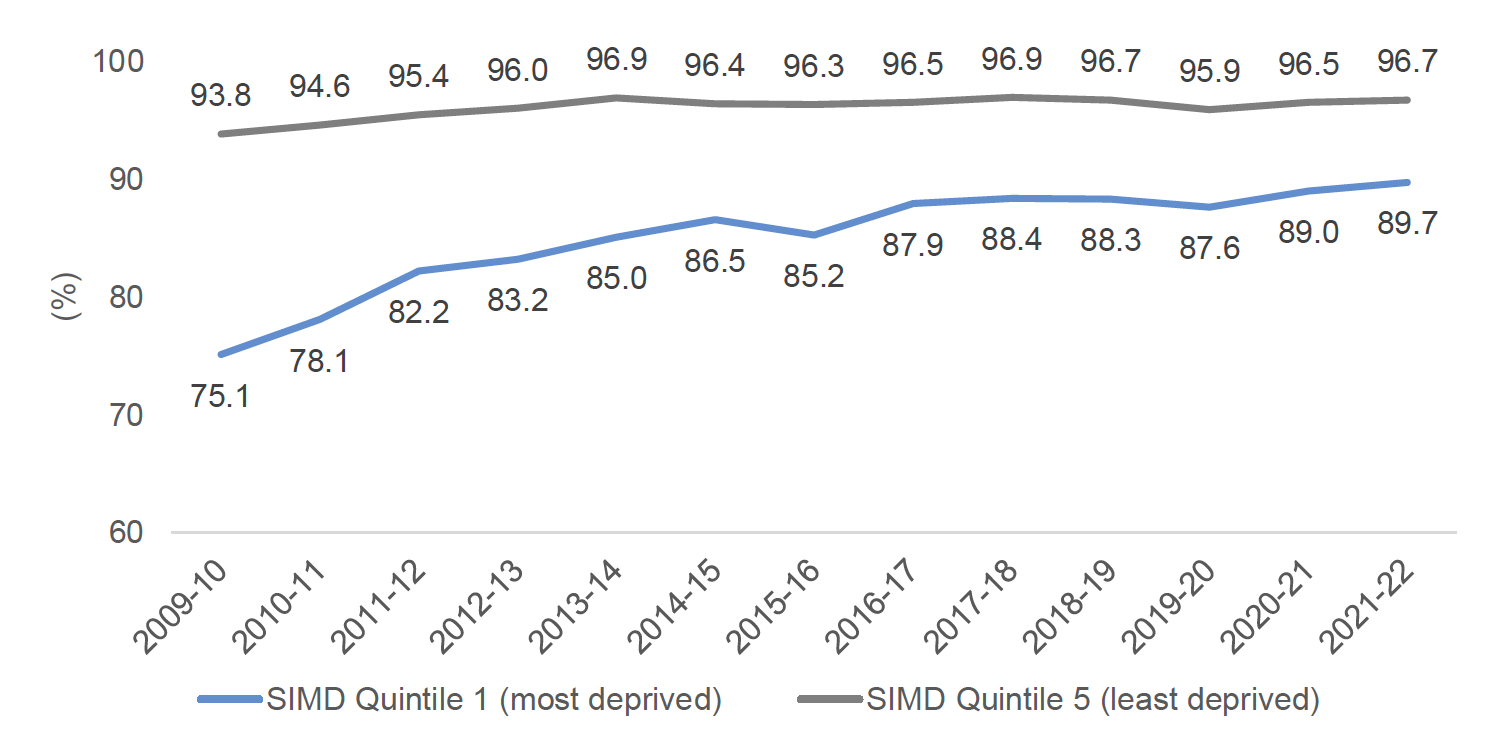
In 2021/22, 93.5% of all school leavers were in a positive follow-up destination. This is the highest proportion since consistent records began in 2009/10. Positive follow-up destinations have increased over time across all SIMD quintiles – but most notably for those in the most deprived areas. For example, as illustrated in Figure 5, in 2009/10 75.1% of those living in the most deprived areas (SIMD 1) were in a positive follow-up destination, compared to 89.7% in 2021/22. This increase across trend data has led to a 7 percentage point difference between the most deprived areas (SIMD 1) and the least deprived areas (SIMD 5) in 2021/22, compared to an 18.7 difference in 2009/10. This is the narrowest the gap has been since consistent records began. Further, it suggests that area deprivation is having less of an attributable effect on entering a positive destination.
 SIMD Quintile 1 and the other is grey and represents the data for those living in SIMD Quintil 5."/>
Positive leisure activities
The positive leisure activities indicator is the percentage of young people in S1 to S3 participating in any of the following leisure activities: Buddying/mentoring programme at school; voluntary work; charity event; drama / acting / singing / dancing group; religious activity; youth organisation; Duke of Edinburgh; and Sports clubs.
In 2021-22, 78% of young people in S1 to S3 had participated in positive leisure activities. However, when we look at this data by area of deprivation, participation in positive leisure activities tend to decrease as deprivation increases. For example, 70% of those in the most deprived areas (SIMD 1) participated in a positive leisure activity, compared to 86% of those from the least deprived areas (SIMD 5).
Across other data sources, the Health Behaviour in School-Aged Children 2022 report, focused on Scottish specific data, identifies that 71% of young people (11, 13 and 15 year olds) were taking part in an organised leisure activity at least once per week – with participation decreasing with lower levels of family affluence (57% in low affluence families compared to 81% in high affluence families).[21]
The wider literature suggests cost as a barrier for children from more disadvantaged backgrounds not taking part in organised or structured activities.[22] This was not only the cost of the leisure activity itself, but also included the hidden or not very obvious costs associated with participation.[23] From example, refreshments, suitable clothing, snacks, musical instrument maintenance[24] and transport costs[25].
During the cost of living crisis, many families noticed an increasing spend on household essentials such as energy and food. Many had to reprioritise household spend to cope with increasing costs of living. In some cases, deductions had to be made on what sometimes had to be seen as discretionary spend, such as children and young people's leisure activities.[26],[27],[28],[29] For example, the Joseph Rowntree Foundation (JRF) report that one in five households have reduced spending on children's activities during the cost of living crisis in order to manage household finances.[30] It will be children in low income households who are more likely to have experienced cuts in the social and leisure activities. The impact that this can have in the long term for attainment and general wellbeing is still unknown.
Physical activity
The physical activity indicator is the percentage of children and young people in P5 to S6 that had at least one hour of exercise the day before the survey (Health and Wellbeing Census).
Data, from the Census, shows a marked difference by deprivation, with those from less deprived areas more likely to have done exercise. In 2021/22, almost six in ten children and young people (59%) had at least one hour of exercise the day before the survey. Just over half of the children and young people (54%) from the most deprived areas (SIMD 1) had at least one hour of exercise the day before the survey. This increased by SIMD quintile to 64% of those in the least deprived areas (SIMD 5) having one hour of exercise the day before the survey.
However, other sources of evidence are less conclusive, with some showing differences by deprivation and others not. This could be due to discrepancies in the data surrounding physical activity levels and the mismatch in definitions. [31] Some collect information on physical activity – which may include light activity. Others look at moderate to vigorous exercise. For example, research from the Growing Up in Scotland study (2015/16), exploring physical activity levels amongst 10 and 11 year olds, found no reported differences by disadvantage.[32] On the other hand, the Health Behaviour in School-Aged Children 2022 reported higher levels of physical activity were found amongst more affluent families.[33]
Diet
The diet indicator is the percentage of children and young people in P5 to S3 and S5 to S6 who eat both fruit and vegetables every day. The diet indicator comes from the Health and Wellbeing Census.
In 2021/22, just over two in ten children and young people (22%) reported eating both fruit and vegetables every day. By area deprivation, the proportion of children reporting eating both fruit and vegetables every day increased as deprivation decreased. In particular, there was a ten percentage point difference between the most deprived and least deprived areas, with 14% from the most deprived areas (SIMD 1) reporting eating both fruit and vegetables every day compared to 33% from the least deprived areas (SIMD 5).
Families living in low income households may not be able to access affordable healthy food, with 27% of children in low income households living in households with low or very low food security (compared to 13% of all children).[34] Analysis suggests that limited financial resources impacts on the food that low income households do eat – often opting for fewer fruit and vegetables[35]. However, current data may not best capture the effects of the cost of living crisis due to data collection timings – and current levels of food insecurity may be higher as families struggle with high food prices.[36]
Mental wellbeing (WEMWBS)
The mental wellbeing indicator portrays the mean score on the Warwick Edinburgh Mental Wellbeing Scale (WEMWBS) for children and young people in S2 to S6. The mental health (WEMWBS) indicator comes from the Health and Wellbeing Census.
This scale provides a score on 14 positively worded items in order to assess a population's mental wellbeing. An individual score can range from a minimum of 14 to a maximum of 70 in their response to a 5-point Likert scoring scale for each individual item. Generally higher scores indicate a higher level of wellbeing. This is a valid and reliable instrument for measuring wellbeing at a population level amongst those aged 13 years and over.[37] Questions relate to an own person's perception of self-confidence, being loved, cared, positive or active amongst other things.
In 2021/22, the average WEMWBS score for young people in S2 to S6 was 45.4. By deprivation, the average WEMWBS score increased slightly as socio-economic deprivation decreased, suggesting some link between area deprivation and a lower reported level of mental wellbeing. In particular, there was a two point difference between the most deprived areas (44.4 for SIMD 1) and least deprived areas (46.4 for SIMD 5). Data would need to be monitored over time to assess whether this difference is sustained.
Data from the Scottish Health Survey reporting on the WEMWBS mean scores of children aged 13-15 years found no clear pattern when analysed by area deprivation. Combined data from years 2017 to 2021, fund that those in the most deprived areas (SIMD 1) recorded a mean score of 51.2 compared to 51.4 for those young people in the least deprived areas (SIMD 5).[38]
Mental wellbeing (SDQ)
This mental health and wellbeing indicator is the percentage of young people in S2 to S6 with a 'Slightly Raised', 'High' or 'Very High' Strength and Difficulties Questionnaire (SDQ) score. The mental health (SDQ) indicator comes from the Health and Wellbeing Census.
This indicator utilises 20 statements relating to emotional, conduct, hyperactivity / inattention and peer relationship problems. A total SDQ score range from a minimum of 0 to a maximum of 40. A higher score indicates greater evidence of difficulties, with scores banded into four categories: close to average, slightly raised, high, and very high. SDQ is a validated screening tool for emotional and behavioural difficulties in children and young people.[39]
On average, 47% of young people had a 'Slightly Raised', 'High' or 'Very High' SDQ Total Difficulties score in 2021/22.
Those living in areas of high deprivation were likely to have greater evidence of difficulties in their mental health. Specifically, 54% of children and young people in in the most deprived areas (SIMD 1) had a 'Slightly Raised', 'High' or 'Very High' SDQ Total Difficulties score, compared to 41% of those from the least deprived areas (SIMD 5).