1+2 languages policy: Findings from the 2024-25 survey of local authorities
Findings of a 2024-25 survey of local authorities on the implementation of the 1+2 languages policy in schools.
3. Language learning in primary schools
L2 provision - primaries
3.1 Overall L2 provision
We asked local authorities how many of their primary schools were providing an L2 entitlement. We defined this as follows:
- By full we mean an L2 is taught continuously from P1 to P7.
- By partial we mean an L2 is not taught continuously from P1 to P7.
- By none we mean an L2 is not taught at all from P1 to P7.
The responses received show that approx. 99% of primary schools were providing either a full or partial L2 entitlement during the 2024-25 session. This breaks down as follows:
| L2 entitlement (in %) | 2024-25 | 2022-23 | 2020-21 |
|---|---|---|---|
| Full | 81% | 68% | 69% |
| Partial | 18% | 31% | 29% |
| None | 1% | 1% | 2% |
There has been little change over time in the percentage of schools providing an L2 entitlement (98% in 2020-21, 99% in 2022-23 and 2024-25) but the percentage of primary schools providing a full entitlement has risen considerably to 81% in 2024-25, from 68% in 2022-23 and 69% in 2020-21. This shows progress towards the full implementation of the L2 delivery in the primary BGE.
3.2 L2 provision by language
The most taught L2 language continued to be French, being provided by approx. 82% of primary schools (compared to 81% in 2022-23 and 84% in 2020-21).
Spanish remained the second most taught language showing an increase from 10% in 2020-21, to 13% in 2022-23, and to 15% in 2024-25.
Gaelic (Learners) remained the third most taught language being provided by 5% of schools (quite stable from 3% in 2020-21 and 5% in 2022-23).
In 2024-25, German was taught by 3% of schools compared to 1% in 2020-21 and 2% in 2022-23.
Italian, Mandarin and Cantonese were offered by less than 1% of primary schools while Urdu did not feature as an L2 in the primary sector.
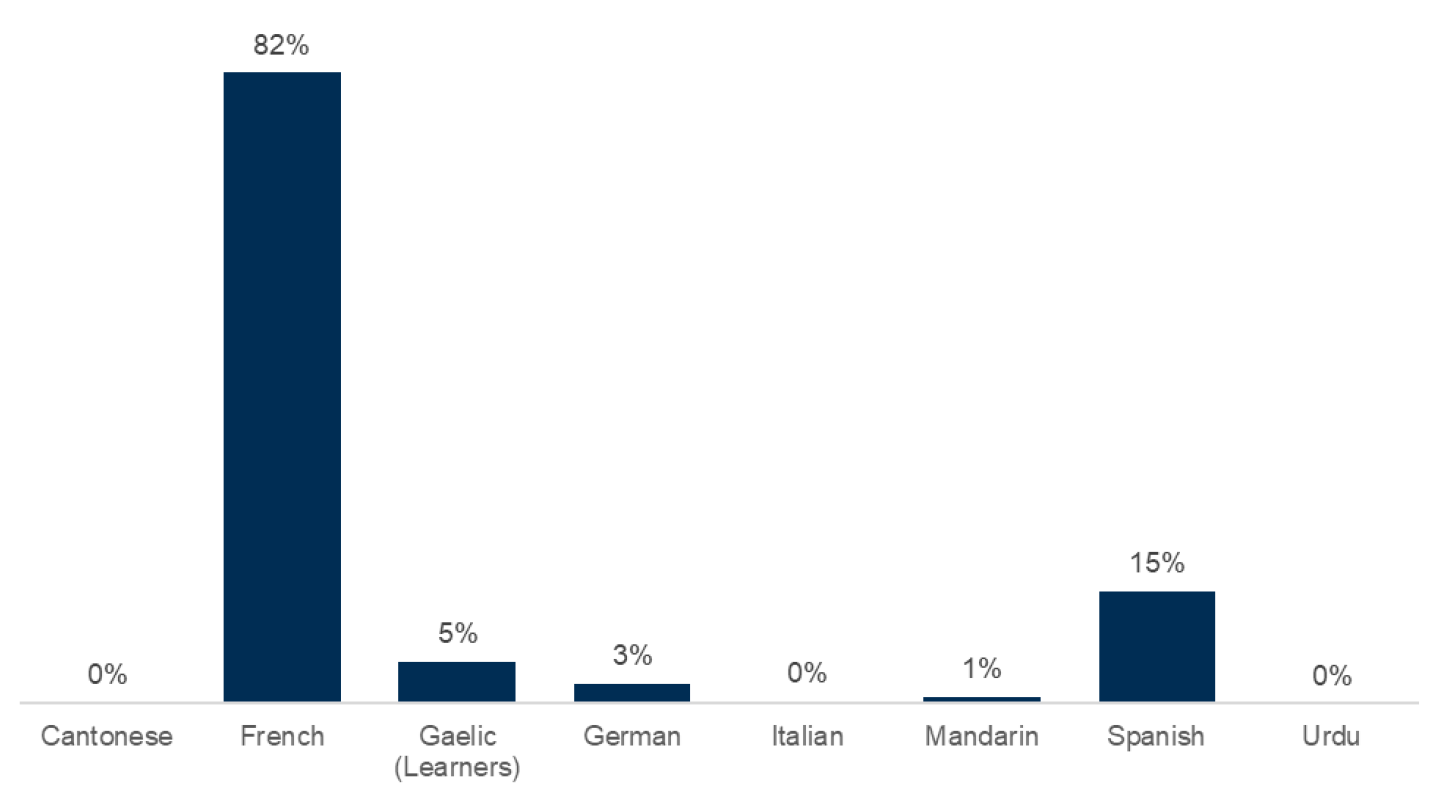
N.B. Percentages adds to over 100% as this data contains multiple counting of some schools, e.g. a school may offer both French and Spanish as L2 languages for different groups of pupils. Out of 1,656 schools that answered the survey.
3.3 Partial delivery of L2 in primary schools
We asked schools to describe what partial delivery looked like in their setting:
- Upper years (P5–P7) were more likely to receive regular L2 input. Patterns included the L2 being delivered P3 or P4 onwards with P1–P3 receiving little or no input, or the L2 being delivered P2 to P7, but not consistently across all classes
- Delivery was reported as irregular and not progressive, with the frequency or quality of the L2 delivery varying between classes or changing from term to term. Some schools opted for occasional lessons, blocks of teaching, or intermittent exposure rather than weekly or embedded instruction.
Schools reported the following issues as barriers to full implementation:
- Teacher confidence, training and staffing constraints were the most significant barriers. To address reliance on trained staff some schools used dedicated language leads or visiting teachers, but these roles were lost due to secondments of these staff coming to an end or staffing changes.
- Overall staff shortages and high turnover of staff were reported as significant issues.
- Conversely, when teachers were trained or confident the L2 delivery was more likely to be consistent.
- Multi-composite classes and Gaelic Medium Education settings were also mentioned as having specific challenges such as immersion models or mixed-stage planning.
- Schools also reported a need for clearer progression pathways and support for embedding L2 across all years.
3.4 Approaches to L2 delivery
We asked local authorities to elaborate on approaches their primary schools took to provide the L2 entitlement.
Some schools reported integrating L2 into daily routines or cross-curricular contexts, while others relied on discrete weekly lessons.
We asked who delivered the L2 language learning. Over three quarters of schools reported that it was taught by the class teacher (76%, up from 73% in 2022-23) although other approaches were taken such as using another member of school staff (16%, down from 21% in 2022-23) or procuring support from another speaker (8%, up from 6% in 2022-23). This shows a small shift towards language learning being delivered by the class teacher, whether solely or with support from another speaker.
| Approach | Percentage of schools* |
|---|---|
| Solely by the class teacher | 76% |
| Another member of school staff | 16% |
| Class teacher with support from another speaker | 8% |
* Percentage of the total of schools that answered this question. Does not include those not delivering a language.
We then asked who schools used as support when using an additional speaker. Out of the 8% that used support from another speaker, the majority used a trained language teacher from within the school whilst other support came from specialist staff from the secondary, a member of the community or a language assistant.
L3 provision - primaries
3.5 Overall L3 provision
We asked local authorities how many of their primary schools were providing an L3 entitlement. We defined this as follows:
- That, in addition to the L2, one or more languages are taught as a planned part of the curriculum in P5, in P6 and in P7. Pupils may learn the same language continuously, P5 to P7, or may learn different languages throughout P5-P7.
The responses received show that approx. 72% of primary schools were providing an L3 entitlement during 2024-25.
| L3 entitlement % | 2024-25 | 2022-23 | 2020-21 |
|---|---|---|---|
| Yes | 72% | 76% | 64% |
| No | 28% | 24% | 36% |
The 2024-25 results showed a smaller proportion of schools (72%) provided the L3 entitlement than in 2022-23 (76%) although it was higher than in 2020-21 (64%).
3.6 L3 provision by language
The results showed that the picture of L3 languages offered by primary schools continued to evolve.
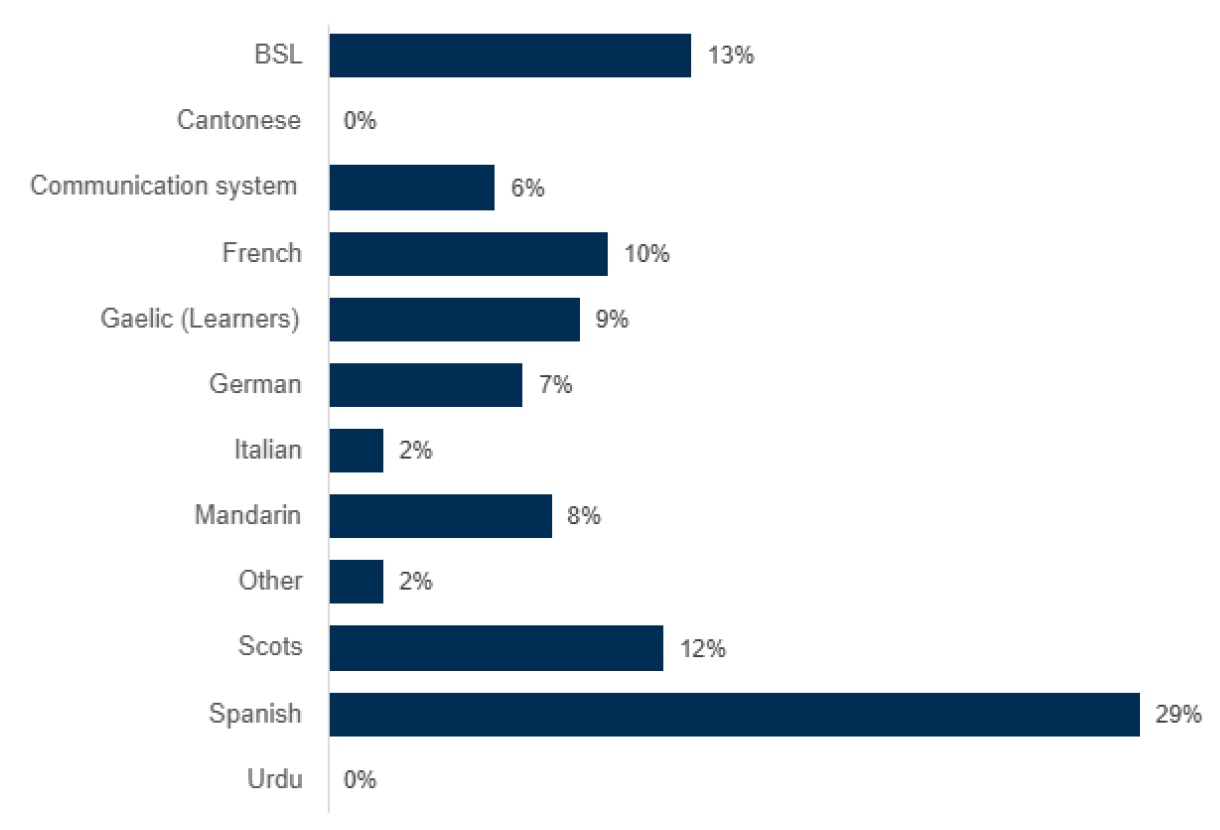
N.B. This data may contain multiple counting of some schools, e.g. a school may offer both French and Spanish as L3 languages for different year groups. Out of 1,654 schools that answered the survey.
The most taught L3 language continued to be Spanish, which was taught by 29% of schools (down from 35% in 2022-23 and 30% in 2020-21) of primary schools. After Spanish, the six most popular languages were:
- BSL (13% up from 11% in 2022-23),
- Scots (stable at 12%),
- French (10% down from 12% in 2022-23 and 2020-21),
- Gaelic (Learners) (9% up from 6% in 2022-23 and 8% in 2020-21),
- Chinese languages (8% in 2024-25 compared to 7% in 2022-23 and 9% in 2020-21) and
- German (7% down from 8% in 2022-23 and 10% in 2020-21).
The languages of Scotland besides English (BSL, Scots and Gaelic), showed an increase in popularity, with BSL and Scots overtaking French for the first time and being respectively the second and third most popular L3s taught in primary schools.
A wider range of other L3s were offered by primary schools, although in very small numbers. This included communication systems such as Makaton.
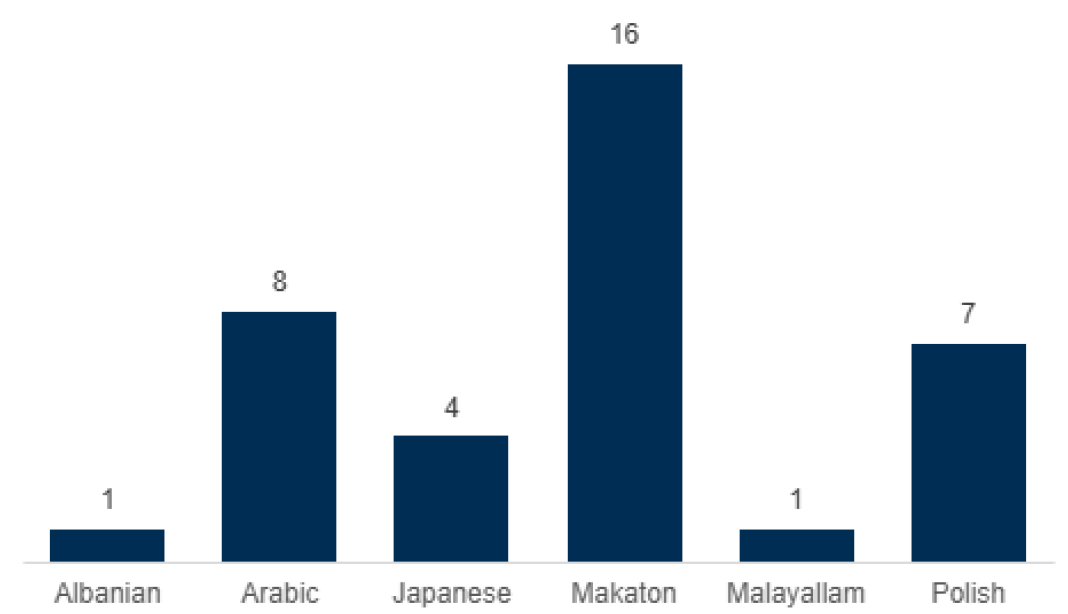
N.B. Out of 1,654 schools that answered the survey. Note we kept numbers of schools for this chart as the numbers were small and represented less than 1% of schools.
3.7 Choice of L3
We asked what factors influenced the choice of L3 provided by schools. The majority of primary schools (51%) reported that their offer aligned with the languages available in their cluster secondary school. Some added that L3 decisions were sometimes made at the cluster or local authority level, ensuring consistency across schools.
A significant driver was cited as teacher ability to deliver the L3 (45%), whilst other factors like available teaching resources (37%) or access to another speaker such as the Mandarin language assistants available through the Confucius Institute for Scotland Schools programme or Gaelic tutors also influenced the choice of L3 offered by schools (13%).
Compared to 2022-23, there appeared to be a shift towards teachers having experience in the language as a deciding factor (45% up from 40%) whilst the language being available in the cluster secondary school had less influence (51% down from 62%).
| Factor influencing the choice of L3 | Percentage of schools |
|---|---|
| Language available in the cluster secondary school | 51% |
| Teachers have experience in the language | 45% |
| Teaching resources available to support delivery | 37% |
| Another speaker can provide support | 13% |
| Other | 13% |
N.B. Adds to over 100% as more than one option possible. Percentages based on schools providing an L3 entitlement.
Schools provided us with further information on other factors that influenced their choice of L3s:
- Inclusion - Schools reported tailoring L3 choices to support learners with additional support needs (ASN), including nonverbal pupils and those with hearing impairments. Makaton and BSL were widely used to support communication and inclusion across the school community. Use of Augmentative and Alternative Communication (AAC) and other tools was common in ASN settings. Several schools reported that pupils expressed interest in learning BSL, influencing L3 selection.
- Learners’ linguistic background - Language choices could reflect the linguistic backgrounds of pupils and their families. Parental input and consultation with the wider community were considered in language planning. Some schools reported that children who are speakers of home, heritage or community languages are given the opportunity to lead language learning in their settings. Arabic, Ukrainian and Scots were taught based on community relevance or cultural events.
- Gaelic - was taught in schools with Gaelic Medium Units (GMUs) or where Gaelic culture was prominent.
3.8 Approaches to L3 delivery
We asked local authorities to elaborate on approaches their primary schools took to provide the L3 entitlement.
75% of the schools reported teaching an L3 as a single language continuously from P5 to P7. The remaining schools were split evenly (13%) between offering a different language every year or offering multiple language each year. Compared to 2022-23 figures which were respectively 74, 15 and 12%.
| Approach | Percentage of schools* |
|---|---|
| Single language taught continuously from P5 to P7 | 75% |
| A single different language taught each year | 13% |
| Multiple different languages taught each year | 13% |
* Percentage of the total of schools that answered this question. Doesn't include those not delivering an L3 language
In terms of delivery models, the L3 was often integrated into interdisciplinary learning (IDL) projects or taught during assemblies and cultural weeks (e.g., Scots Week, Burns Celebration).
Some schools used a non-progressive, exposure-based model for L3, especially for BSL and Makaton. Staff changes, training gaps, and external pressures were reported as affecting the consistency and progression of L3 delivery. Some schools reported reassessing the relevance of previously chosen languages due to evolving pupil needs.
When asked who delivers the L3 provision, schools told us that the majority of the teaching was provided by the class teacher, solely (61%) or with support (19%) whilst the remaining 19% reported that the L3 offer was provided by another member of the school staff.
These figures show a small shift compared to 2022-23, with more class teachers making use of support from another speaker (up from 14%) whilst fewer classes are taught by another member of school staff (down from 23%).
| Approach | Percentage of schools* |
|---|---|
| Taught solely by the class teacher | 61% |
| Taught by another member of school staff | 19% |
| Taught by the class teacher, with support | 19% |
* Percentage of the total of schools that answered this question. Doesn't include those not delivering an L3 language
Support from other speakers was provided by language assistants (7%), specialist languages staff within the school (8%) and member of the wider school community (7%). Fewer schools made use of a specialist languages staff from secondary (4%).
| Support from other speakers | Percentage of schools |
|---|---|
| Languages assistant | 7% |
| Specialist languages staff within the school | 8% |
| Specialist languages staff from secondary | 4% |
| Member of the wider school community | 7% |
* Percentage of the total of schools that answered providing an L3. Possible underestimate as not all schools answered.
Contact
Email: ceu@gov.scot