Publication - Statistics
Scotland's Carbon Footprint 1998 – 2019
Estimates of Scotland's greenhouse gas emissions on a consumption basis for the period 1998 to 2019.
Key points
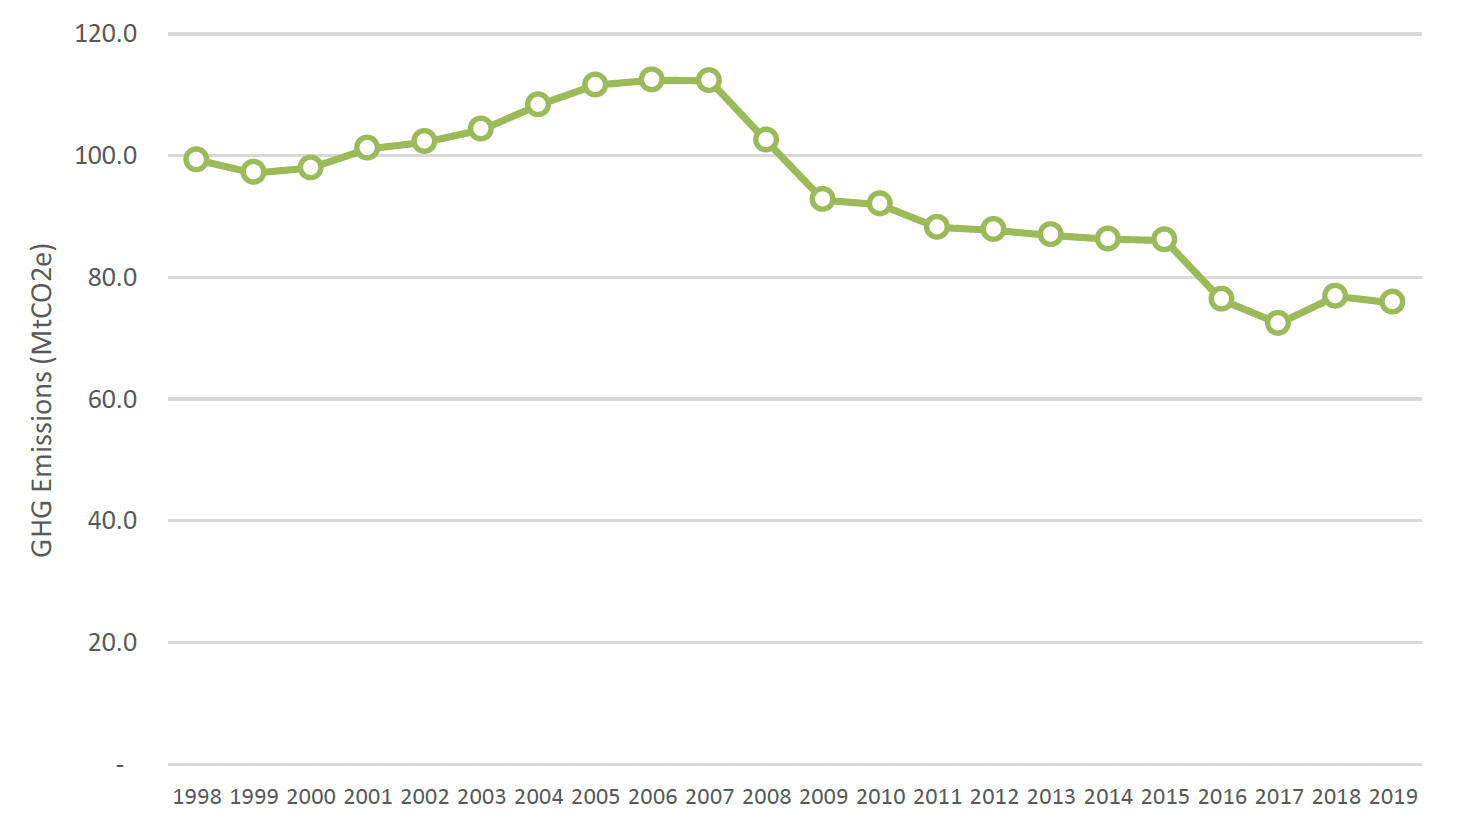
- Between 2018 and 2019, Scotland's carbon footprint (emissions from all greenhouse gases) decreased by 1.3 per cent from 76.9 in 2018 to 75.9 million tonnes carbon dioxide equivalent (MtCO2e) in 2019.
- Between 1998 and 2019, Scotland's carbon footprint fell by 23.6 per cent, from 99.3 MtCO2e in 1998 to 75.9 MtCO2e in 2019.
- Scotland's carbon footprint rose continuously from 1999 to a peak of 112.4 MtCO2e in 2006 before falling sharply in the years after 2007 (coinciding with the recession) and, with the exception of 2018, has fallen each subsequent year. The overall reduction between the 2006 peak and 2019 is 32.5 per cent.
Contact
Email: CCStatsModelling@gov.scot