Understanding seabird behaviour at sea part 2: improved estimates of collision risk model parameters
Report detailing research using GPS tags to track Scottish seabirds at sea.
7. Appendix 1: Workshop Summaries
Part 1: Data Collection
Attendees: Aonghais Cook (BTO), Daniel Johnston (BTO), Gary Clewley (BTO), Liz Humphreys (BTO), Chris Thaxter (BTO), Jacob Davies (BTO), Philipp Boersch Supan (BTO), Aly McCluskie (RSPB), Lucy Wright (RSPB), Ian Cleasby (RSPB), Saskia Wischnewski (RSPB), Francis Daunt (UKCEH), Alex Robbins (NatureScot), Martin Perrow (ECON), Sean Sweeney (APEM), Tim Kasoar (APEM), Matt Hazleton (NIRAS), Ross MacGregor (MacArthur Green), Mark Trinder (MacArthur Green), Drew Milne (Marine Scotland), Tom Evans (Marine Scotland)
Device attachment
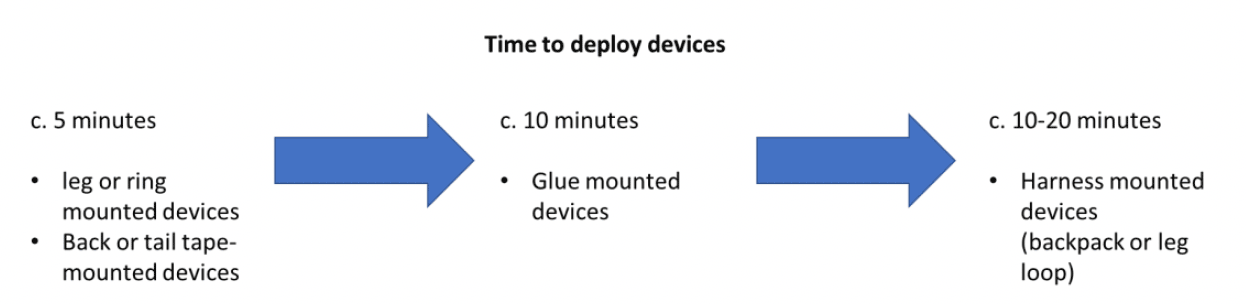
Before deploying a bird-mounted device such as a GPS tag, permission must be obtained from the Special Methods Technical Panel (SMTP) of the BTO Ringing Committee. To enable SMTP to properly evaluate proposals, and respond to any feedback, it is recommended that all applications are submitted at least three months prior to the deployment of any devices. A number of approaches to attach GPS tags, or other devices, to birds exist including, leg or ring mounting, tape mounting to a birds’ tail or back, glue mounting to a birds’ back and using a leg-loop or backpack harness (e.g. Clewley et al., 2021; Evans et al., 2020; Mallory & Gilbert, 2008; Seward et al., 2021). Attachment times for these methods vary from c. 5 minutes for more simple methods to c. 10-20 minutes for more complex approaches (Figure 1).
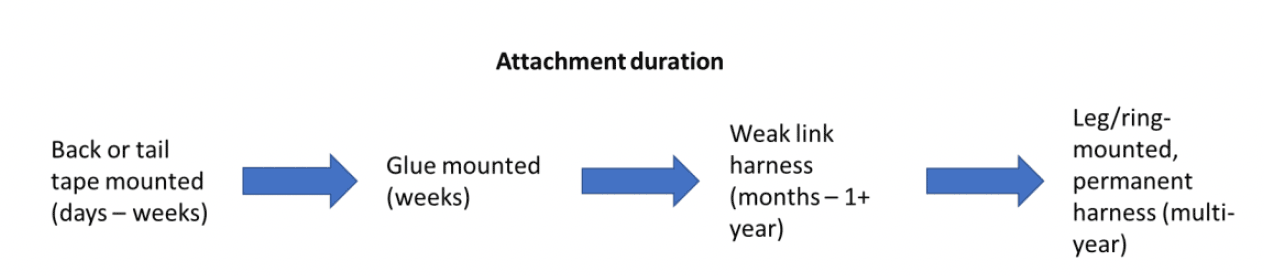
The most appropriate attachment methodology will depend on the species and objectives of any study. Attachment methodologies vary in their longevity (Figure 2). Generally, tape-mounted devices will remain attached for the shortest duration (days-weeks), glue mounted devices will remain attached for a few weeks, while harness or ring-mounted devices can last for longer time periods (1 year +). However, it is important to note that weak-link harnesses, which are designed to fail after a given time period, have been developed in order to reduce impacts on birds (Clewley et al., 2021). Consequently, glue or tape mounted deployments may be most suitable for short-term collection of data on habitat use or behaviour during the breeding season, while harness or ring-mounted devices are required for the collection of year-round data, and data outside the breeding season.
Generally, leg-mounted approaches are likely to be suitable for each of the key species of concern to the offshore wind industry at present (Table 1). However, these are limited to smaller devices such as geolocators or time-depth-recorders. Tape mounted devices have also been used successfully with the species considered here. However, these may be subject to relatively short deployments as they are vulnerable to removal by some species, particularly large gulls. In recent years, there have also been issues when using tape to mount devices on bird’s backs. These are thought to be linked to feather quality and structure (S. Wischnewski Pers. Comm.). Whilst glue mounted devices may be deployed over longer time periods than those deployed using tape, careful consideration must be made of species moult status. Birds in active moult are more prone to losing devices as they shed feathers. Careful consideration must also be given to the glue used to attach devices, particularly those that produce an exothermic reaction when exposed to an activator. Whilst, harnesses have previously been successfully used on large gulls but there may be adverse impacts on other species (Thaxter et al., 2014, 2016). In a recent trial on kittiwakes, backpack harnesses were found to be associated with an unacceptable level of abrasion and removed (Clewley et al. in prep.). Abrasion was also noted on birds fitted with leg-loop harnesses, whilst these devices were also removed, it was felt that a revised leg-loop design may prevent this, and a further trial using this approach is planned for the 2022 breeding season. It is considered unlikely that harness methodologies would be licensed for diving species (e.g., guillemot, razorbill and gannet) as a result of the potential for increased drag underwater from devices positioned in this way. Regardless of the attachment methodology selected, specialist training will be required by anyone deploying devices, particularly in relation to harnesses, which are associated with a greater risk to bird welfare.
| Leg-mounted | Tape mounted | Glue Mounted | Leg-loop harness | Backpack harness | |
|---|---|---|---|---|---|
| Guillemot | √ | √ | * | * | |
| Razorbill | √ | √ | * | * | |
| Gannet | √ | √ | * | * | |
| Kittiwake | √ | √ | √ | √ | x |
| Lesser black-backed Gull | √ | √ | √ | √ | √ |
| Herring Gull | √ | √ | √ | √ | √ |
| Great Black-backed Gull | √ | √ | √ |
√ Suitable
√ may be suitable with further consideration
x not suitable
* not tested but unlikely to be suitable for diving species
Device effects
As part of any deployment, it is important to collect data on potential device effects. There are two reasons for this:
1) To ensure that devices are not adversely effecting the birds.
2) To understand the extent to which data from tagged individual may or may not be representative of the wider population.
In any process in which a bird is captured, handled and fitted with a device, there will always be an effect. The key questions to consider are whether the process has an unacceptable impact on the individual concerned, and whether, as a result of this process, the recorded behaviour of the individual is no longer likely to reflect that of the population more widely.
A range of data may be collected in order to assess potential device effects (Bodey et al., 2018). This includes demographic data such as productivity and return rates the following breeding season, as well as behavioural data such as nest attendance rates and parental change-over rates. The data collected often varies on a study-by-study basis, and may reflect the visibility of the colony concerned, the accessibility of that colony and the potential for any disturbance effects if it is necessary to enter the colony. Where multiple devices have been deployed at a single colony, it is also possible to investigate how device weight, position and attachment methodology influences bird’s distribution at sea. However, it is noted that unpicking these factors may be challenging given the sample sizes involved.
Data have typically been collected by comparing tagged birds to a control group of marked birds. However, there is growing interest in comparing data from a third group of birds that have not been handled (e.g. Seward et al., 2021). This would help us to understand whether any effects are the result of the device and attachment methodology or, the result of handling. Where a colony is easily observable, data on productivity can be collected by observing a subset of nests where neither parent has been captured. Where there is an existing cohort of marked individuals (e.g., with colour-rings) these nests can also be monitored to provide data on nest attendance and return rates for birds that have not been captured as part of the tagging study. If appropriate, data collected as part of monitoring (e.g., productivity rates) for tag effects should be added to the Seabird Monitoring Programme (SMP) database.
For a well-designed tracking study, device effects should be small. Given the relatively small sample sizes involved in tracking studies, many will lack the statistical power to detect any device effects (Cleasby et al., 2021). Power to detect impacts may be increased by pooling results across multiple studies (e.g. Bodey et al., 2018). To facilitate this, there is a need for researchers working on the same species across multiple colonies to co-ordinate data collection and move towards more standardised assessments of tag effects. These standardised assessments are likely to vary on a species-by-species basis, with key considerations relating to the relative accessibility of different colonies and the potential for disturbance. However, these considerations should not be seen as a barrier to collecting additional data where circumstances allow.
Sampling rates
Faster sampling rates allow for the collection of higher resolution tracks, and more accurate GPS estimates of altitude. However, there is a trade-off between sampling rate and battery life. As battery life is proportional to weight, this means that the size of the species being tracked can impose a limit on the sampling rate that can be maintained over the course of a study. Where batteries get drained too quickly, this can result in an incomplete record of a bird’s foraging movements and may not accurately reflects its true foraging distribution. This may pose challenges for analyses of species space use (e.g. Wakefield et al., 2017).
Some tags offer the utility to apply geo-fences to data, whereby higher resolution data can be collected within a given area (e.g., a wind farm), with lower sampling rates to preserve battery life elsewhere. Ultimately, the choice of sampling rate will be influenced by the question being asked. If the aim of a study is to investigate the distribution and habitat usage of birds at sea (Thaxter et al., 2015), a lower sampling rate, with coarser resolution spatial information may be appropriate in order to minimize any potential data gaps and incomplete foraging trips. However, if the aim is to collect GPS flight height estimates (Ross-Smith et al., 2016), or investigate fine-scale movements of birds in relation to wind farms (D. Johnston et al., 2021), higher resolution data will be required. However, this may come at a cost of a less complete understanding of species at sea distribution. This choice should be discussed and agreed with funders, and other stakeholders, at the outset of any study.
GPS/Altimeter measurements of flight height
Flight height estimates may be obtained directly from GPS data or, through recording pressure data using an altimeter.
For GPS estimates of flight height are made relative to modelled estimates of mean sea-level. There are often significant errors associated with flight heights estimated from GPS, these are related to the number of satellites used to record a bird’s position, cloud cover and sampling rate. It is important to account for these errors in the modelling process (e.g. Péron et al., 2020; Ross-Smith et al., 2016). There may also be error associated with the estimation of mean sea level. However, using behavioural classification, this error can be accounted for by calibrating flight height estimates derived from times at which birds were classified as floating on the sea surface.
Altimeters are generally power-efficient, without the need for the high-resolution data required for GPS flight height estimates. This is valuable in relation to battery life, meaning distributional data can be collected alongside the flight height estimates. However, processing the data collected by altimeters to convert pressure measurements into altitude estimates is more computationally intensive than processing GPS flight height estimates. Altimeters measure pressure in bursts of 10 Hz, these are then converted to estimates of altitude as follows:
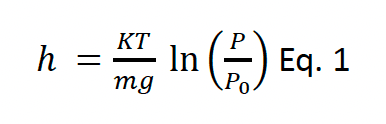
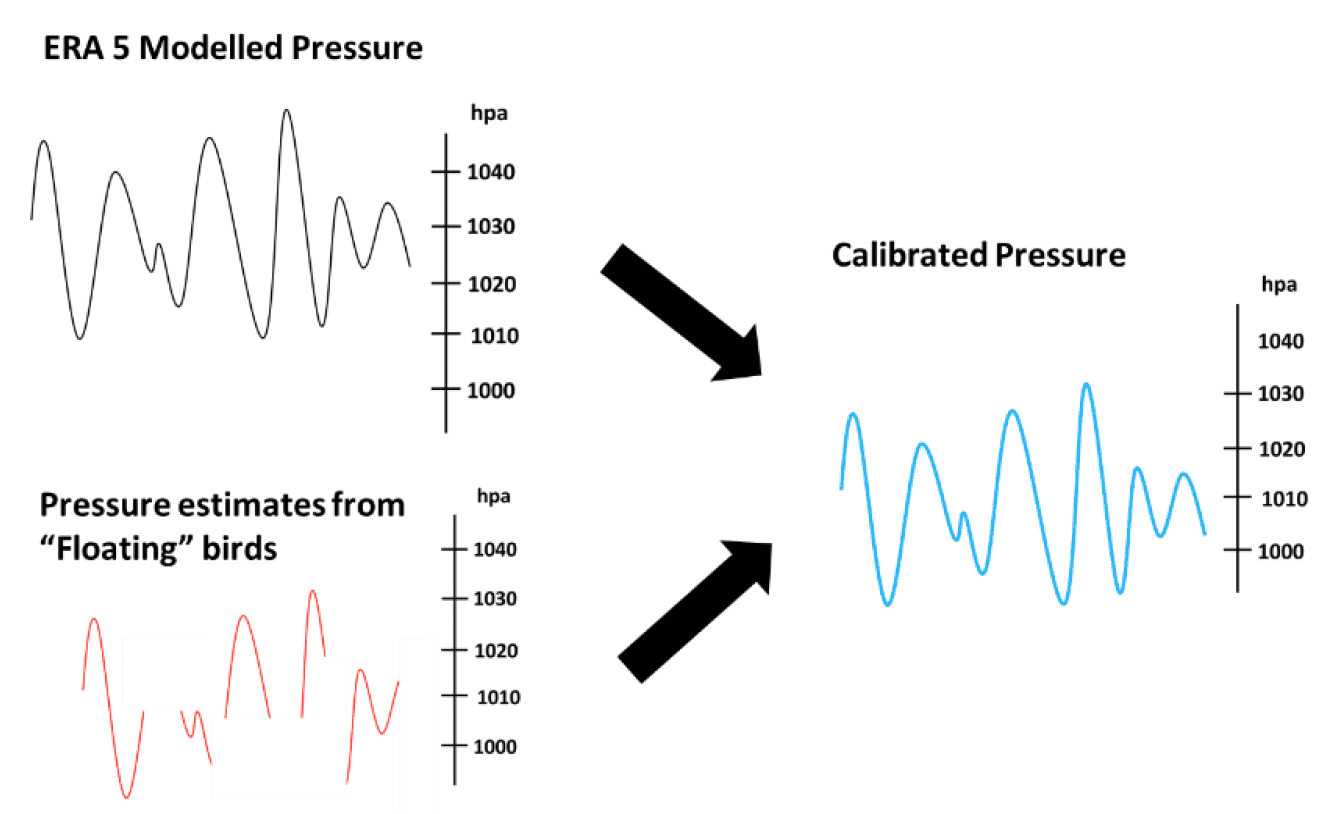
where h is the altitude in meters, K is the universal gas constant for air, T is the temperature in Kelvins, m is the molar mass of air, g is acceleration due to gravity, P0 is the pressure at sea level and P is the pressure recorded by the altimeter. There are a number of potential sources of data for estimating P0 including local measurements from offshore buoys, modelled estimates from sources like ECMWF ERA 5 and measurements obtained from the altimeters when birds are known to be floating on the sea surface. Given that pressure is known to vary both spatially and temporally, there may be a need to combine data in order to obtain a calibrated estimate of pressure at sea level (Figure 3). These calibrated estimates of P0 can then be used in Eq. 1 to estimate the flight altitude of a bird at any given point. However, when using approaches such as this, it is important to note that broad-scale patterns in pressure can change quickly, and that there may be some drift in the calibration of tags. Consequently, there may be greater uncertainty in species which engage in less floating behaviour. In these circumstances, it would be valuable to consider other potential sources of local pressure data, for example that measured from LiDAR buoys, or met masts within windfarms.
Where the two methodologies have been combined, altimeter estimates of flight height are highly correlated with the GPS estimates. However, the estimates of flight height obtained using altimeters are generally higher, and have greater precision, than those obtained using GPS. Regardless of whether flight heights are estimated using GPS or altimeters, calibrating these estimates with reference to points at which birds have been identified as floating on the sea surface is a valuable step towards reducing uncertainty associated with the data.
Part 2: Use of data in Collision Risk Modelling
Attendees: Aonghais Cook (BTO), Gary Clewley (BTO), Liz Humphreys (BTO), Chris Thaxter (BTO), Jacob Davies (BTO), Philipp Boersch Supan (BTO), Aly McCluskie (RSPB), Lucy Wright (RSPB), Saskia Wischnewski (RSPB), Francis Daunt (UKCEH), Alex Robbins (NatureScot), Sean Sweeney (APEM), Matt Boa (APEM), Matt Hazleton (NIRAS), Ross MacGregor (MacArthur Green), Mark Trinder (MacArthur Green), Tom Evans (Marine Scotland)
Behavioural classification
There may be pronounced differences in species flight heights and speeds in relation to different behavioural classifications (e.g. foraging or commuting flight) which have important implications for the assessment of collision risk (Cleasby et al., 2015; Masden et al., 2021; Thaxter et al., 2019). Classifications are typically based on the tortuosity of tracks and distance travelled between GPS points (Figure 4). In addition to potentially offering a means to deriving behaviour specific estimates of parameters for collision risk models, these approaches potentially also offer a means to better understand the consequences of displacement and barrier effects.
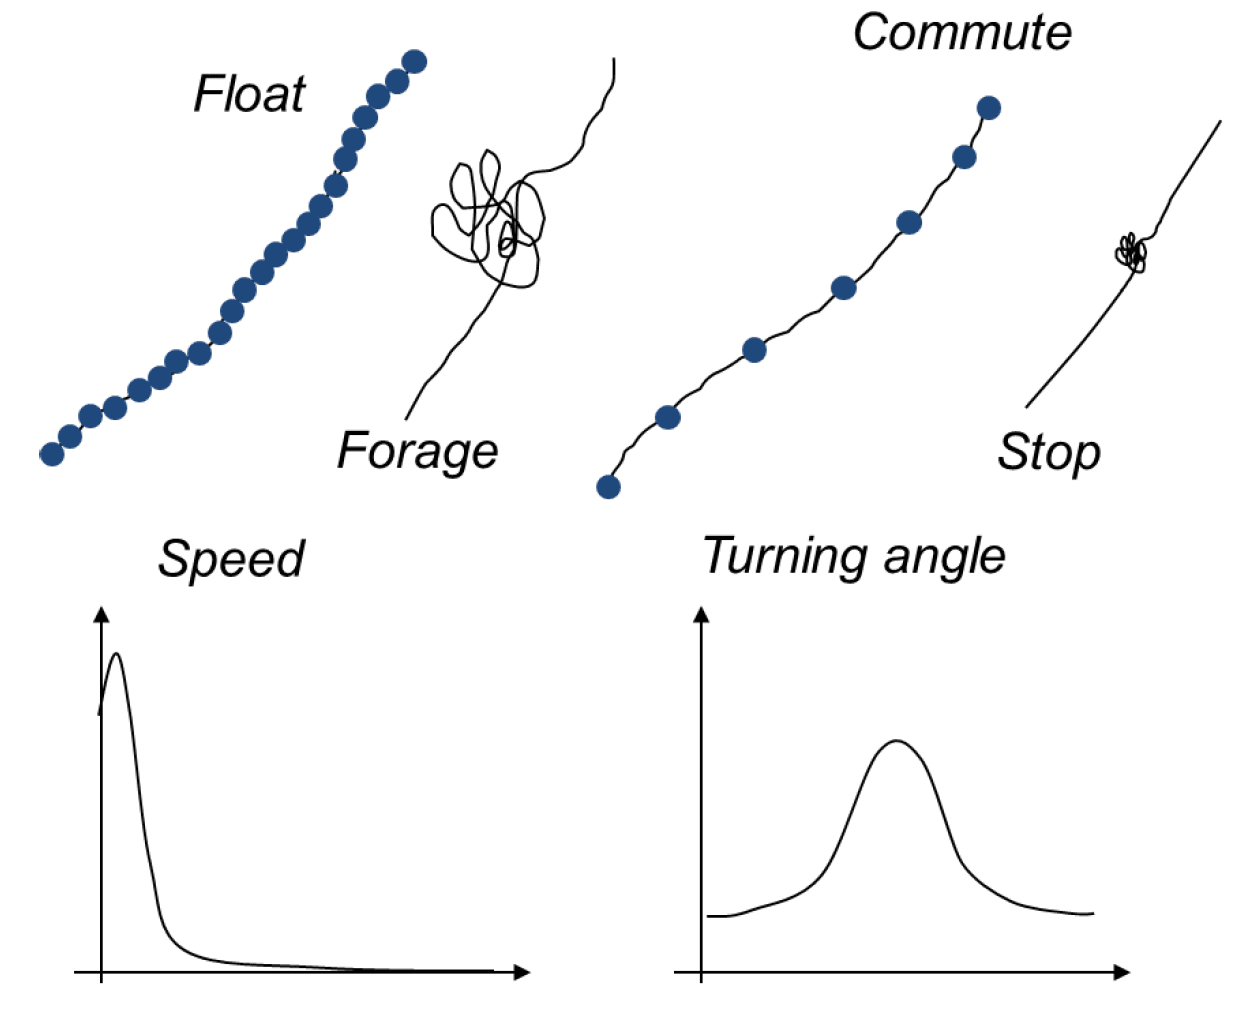
A variety of different approaches are available from simple rules-based methods (e.g., based on flight speed) to more complex approaches based on machine-learning and neural networks. At present, the most widely used methods are Hidden Markov Models (HMMs) (McClintock & Michelot, 2018) and Expectation-Maximisation Binary Clustering (EMbC) (Garriga et al., 2016). The choice of approach will depend both on the data available, and the objectives of the study. Generally, analysis is based on step lengths and turning angles estimated from GPS data (Figure 4). However, it is possible to incorporate other data, for example from accelerometers or time-depth-recorders, to refine these classifications further (Thaxter et al., 2019). Where the aim is to simply partition behaviour into foraging and commuting flight (e.g., to obtain behaviour-specific estimates of flight height and speed), approaches like EMbC offer a fast and robust means to do this. However, if the aim is to better understand drivers of behaviour (e.g., to investigate how collision risk may change in different conditions), alternative approaches which can incorporate covariates, such as HMMs are required. However, this can bring challenges as HMMs are more sensitive to gaps in data. If this is the aim of a study, it will have implications for sampling rates and battery life that will need to be considered at the outset of that study. Regardless of the approach taken for behavioural classification, careful ecological interpretation of the behavioural states identified is required, and the number of states identified may vary between species (Thaxter et al., 2019).
It is important to consider the representativeness of any behavioural classifications. At present, data relate to the breeding season only, and only to breeding birds. There is a need to consider how representative data are of non-breeding birds, and birds outside the breeding season.
Flight Speed
Flight speed is used by the Band (2012) collision risk model twice. Firstly, to estimate the flux rate, and secondly to estimate the probability of collision. Consequently, flight speed is among the parameters that the model is most sensitive to (Masden et al., 2021). At present, estimates of flight speed are based on values presented in studies such as Alerstam et al. (2007), which are often derived from limited sample sizes and durations of observations. The rapid expansion of GPS tracking studies for seabirds offers a valuable source of data for flight speed estimates (Largey et al., 2021).
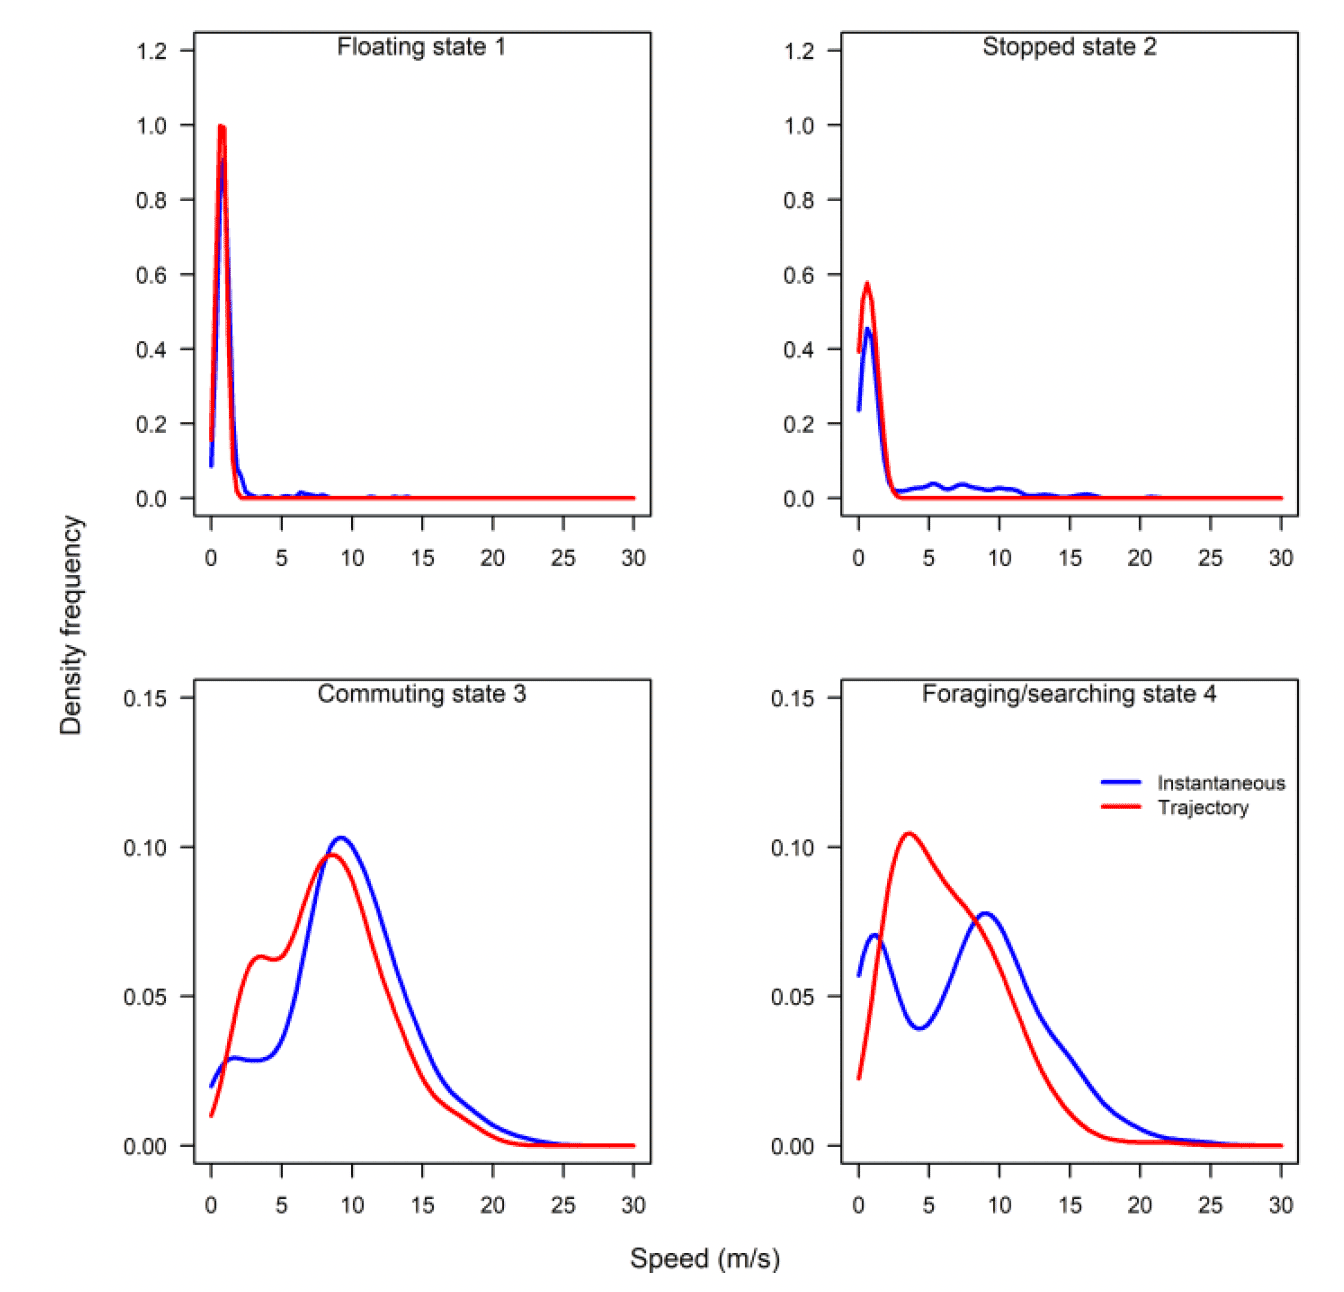
Flight speed can be estimated from GPS tags in two ways: 1) by estimating the distance travelled between two GPS fixes with known time intervals (trajectory speed), and 2) using the Doppler effect referencing the time taken for the signal to travel between the tag and satellite(s) (e.g. Fijn & Gyimesi, 2018) to give an instantaneous measurement of speed. Whilst the two speeds are strongly correlated, the trajectory speed systematically under-estimates flight speed, as measured instantaneously (Figure 5), though this effect decreases as sampling rate increases. At present, whilst the instantaneous speed is not routinely reported as part of the output from all tags, there should not be a technical barrier to enabling this, and it is recommended that this request is made to tag manufacturers when ordering tags.
For both foraging and commuting flight, recorded speeds were lower than those reported by Alerstam et al. (2007). Foraging speeds were substantially slower than commuting speeds (Table 2). As data are restricted to birds at breeding colonies, there are concerns in relation to how representative these speeds may be for non-breeding birds, or birds outside the breeding season. However, it is also noted that similar criticisms could be applied to the speeds recommended in current guidance which were derived from more limited sample sizes in a more restricted set of conditions. To overcome some of the challenges related to understanding how representative data are, flight speed estimates could be obtained from birds with long-term GPS data collected outside the breeding season (e.g., Lesser black-backed gulls). Recorded flight speeds could also be compared to those collected using other methodologies including radar (Tjomlov et al., 2021) and laser rangefinders (Skov et al., 2018), with a view to integrating measurements across methodologies.
| Species | Colony | Alerstam et al. (2007) | Foraging | Commuting |
|---|---|---|---|---|
| Lesser black-backed gull | Walney | 13.1 | 7.94 | 9.51 |
| Lesser black-backed gull | Skokholm | 7.06 | 10.14 | |
| Lesser black-backed gull | Orfordness | 7.69 | 9.70 | |
| Kittiwake | Flamborough Head and Bempton Cliffs | 13.1 | 6.06 | 9.70 |
| Gannet | Flamborough Head and Bempton Cliffs | 14.9 | 10.79 | 14.08 |
Using the lower flight speeds estimated from GPS in the Band (2012) model will result in lower predicted collision rates as a result of a reduction in the predicted flux rate (Masden et al., 2021). Following behavioural classification, these flight speeds can be refined further into estimates for foraging and commuting flight (Table 5). During the breeding season, where there is clear separation between areas used for foraging and those used for commuting, it may be straightforward to recommend the use of behaviour specific flight speeds for collision risk modelling, though noting concerns about the representativeness of these data for non-breeding individuals. However, where this delineation is less clear, if estimates of behaviour-specific flight speed are to be used, it may be necessary to combine these using a weighted average based on the proportion of time spent in foraging or commuting flight.
Flight height
Estimates of the proportion of birds at collision risk height are a key parameter for assessing collision risk in relation to offshore wind farms (Band, 2012; Johnston et al., 2014). Species flight heights may be estimated using a range of different technologies including radar, LiDAR, GPS, altimeters and laser rangefinders (Largey et al., 2021). However, estimates of species flight heights from different technologies may be subject to systematic bias, error and individual variation (Péron et al., 2020). Consequently, it is better to characterise the variation in species flight heights using a distribution, rather than relying on individual point estimates.
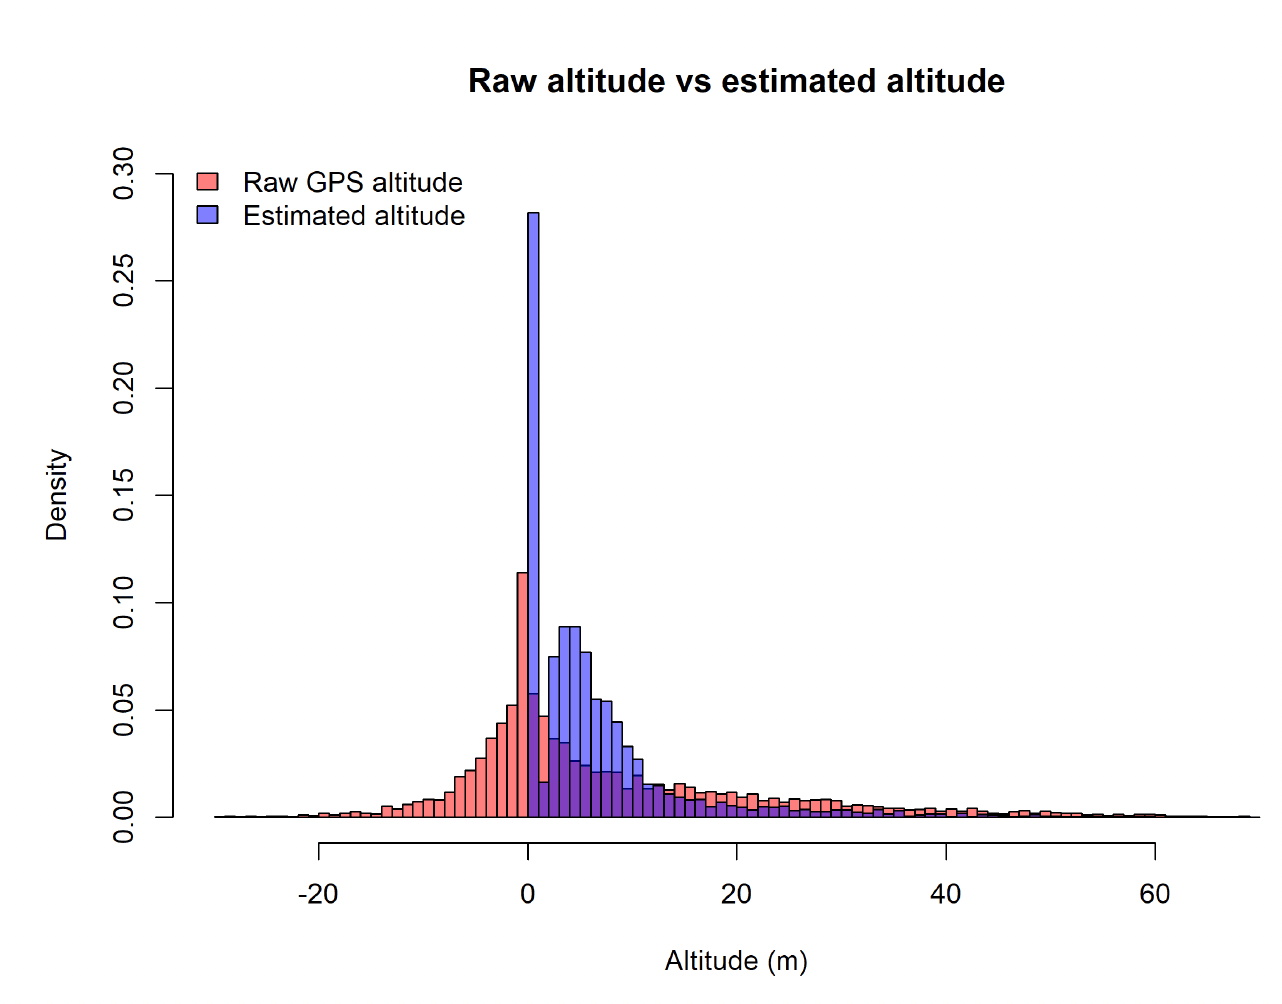
GPS estimates of species flight heights are known to be subject to error (Ross-Smith et al., 2016). Whilst this is mostly obviously manifested by a substantial proportion of birds flying below the sea surface, flight height estimates of birds flying above the sea surface will also be subject to this error. However, we know that this error is correlated with the number of satellites associated with each estimate, meaning that we can model this by partitioning out the observation error and the true variation in species flight heights using a state-space model following Ross-Smith et al. (2016). Using this approach, we can see that the raw altitude data obscure a peak in the flight height distribution, and over-estimate the proportion of birds at higher altitudes (Figure 6).
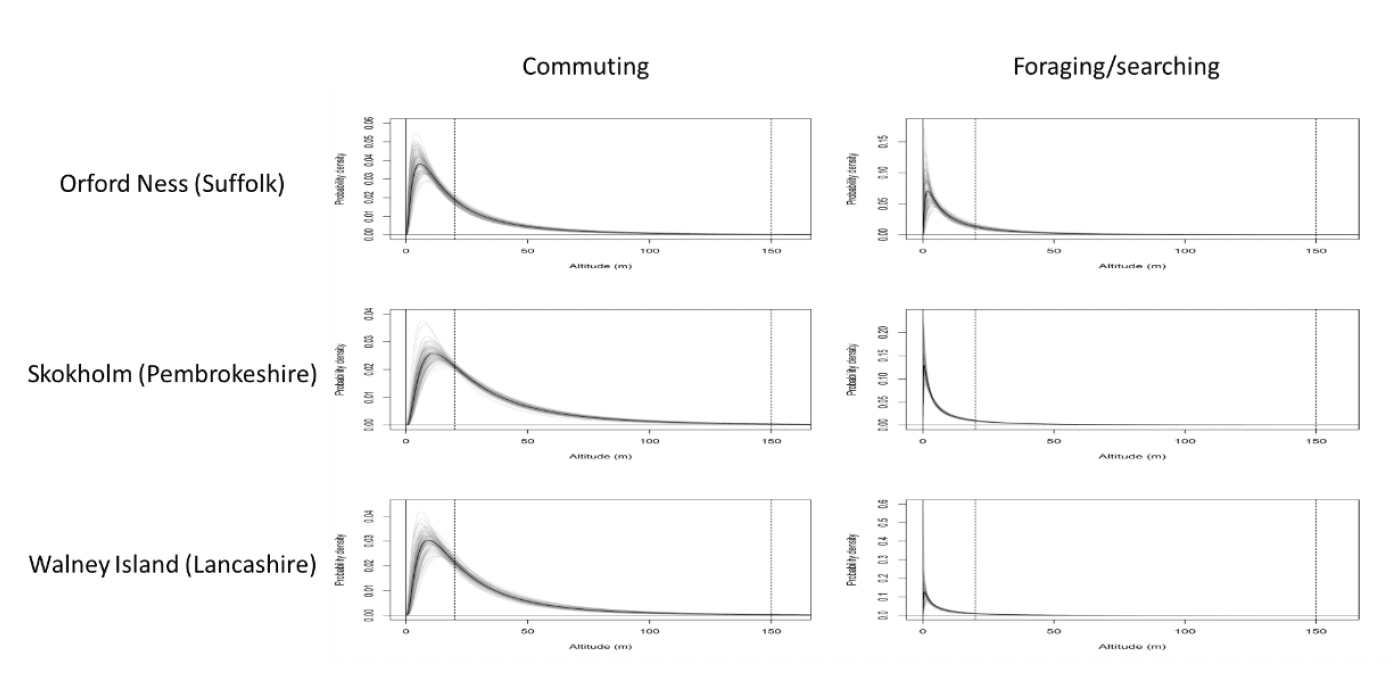
As with flight speed, we can partition GPS data into foraging and commuting behaviour and estimate flight height distributions for each (Figure 7). For lesser black-backed gulls, commuting flights were generally higher than foraging flights, with more time spent at collision risk height, indicating increased collision risk for commuting behaviour. As with flight speed, this offers the potential for behaviour-specific estimates of flight height to be used for collision risk modelling.
Avoidance Rates
Outputs from collision risk models are highly sensitive to the values assumed for avoidance (Chamberlain et al., 2006; Masden et al., 2021). At present, the avoidance rates used in collision risk models account for model error in addition to any behavioural avoidance (Masden et al., 2021). Avoidance rates are calculated by comparing observed collision rates to those predicted in the absence of avoidance (Cook et al., 2014; Cook et al., 2018). Consequently, whilst it is possible to estimate avoidance behaviour using GPS tracking data (Johnston et al., 2021), these values cannot be used as avoidance rates for the purposes of collision risk modelling.
Integrating GPS data into assessments of collision risk
There are two potential roles for GPS data in the assessment of collision risk. Firstly, data can be used to refine estimates of the values of parameters, such as flight height, flight speed and nocturnal activity, that are used in collision risk models (e.g. Cleasby et al., 2015; Fijn & Gyimesi, 2018; Furness et al., 2018; Masden et al., 2021; Ross-Smith et al., 2016). Secondly, GPS data could be used to refine existing models, or develop new models, to better account for the bird behaviour in the assessment of collision risk (e.g. Schaub et al., 2019; Searle et al., n.d.).
At present, there is considerable uncertainty underpinning assessments of the impacts of offshore wind farms (Masden et al., 2015). In keeping with the precautionary principle, these means that conservative estimates must be used for the parameters used in collision risk models. This leads to concerns that precaution gets magnified through the assessment process, leading to assessments that are overly precautionary. As a result, this uncertainty contributes to a situation whereby several of the projects put forward as part of the ScotWind leasing round cannot proceed unless evidence can be put forward to release them from high levels of ornithological constraint.
Recent analyses highlighted that basing collision estimates on flight speeds measured using GPS, rather than the current recommended values, could reduce predicted collision rates in lesser black-backed gulls at a wind farm cluster in North West England by 12% (Masden et al., 2021). Further refinements in model parameters, such as accounting for when birds are foraging or commuting, may also contribute to reductions in predicted collision rates. Refinements such as these enable us to reduce the precaution in assessments of collision risk by reducing uncertainty surrounding input parameters.
It is important to consider the implications of refinements to model parameters for estimates of avoidance rates. At present, estimates of avoidance incorporate model error, which will, at least partially, include misspecification of input parameters. As highlighted by Masden et al. (2021), this is particularly true in relation to the impact of flight speed on the estimated flux rate. A reduced flight speed, as is the case for the GPS flight speed estimates considered here relative to current recommended values, will reduce the estimated flux rate, and consequently the number of collisions predicted in the absence of avoidance. As avoidance rates are estimated by comparing predicted and observed collision rates, this may mean that where lower flight speeds are used, revised, lower avoidance rates should be used as well. This highlights a key challenge in integrating GPS data into assessments of collision risk. Whilst the potential to reduce precaution through better estimation of input parameters is a positive, it is still unclear the extent to which this may improve (or otherwise) estimates of collision risk. The key to better understanding this will be to ensure that studies such as Skov et al. (2018), or that currently underway in Aberdeen Bay (Tjomlov et al., 2021), are carried out in such a way that they enable the validation of collision risk models.
Recommendations
Tags
The type of tag used for a study will have implications for the attachment methodology that is used, the data that are collected and the analyses that are possible. Consequently, the choice of tag should be discussed with project funders and other relevant stakeholders at the outset of a project. There will be a trade-off between battery life and sampling rate, which will have implications for the collection of distribution data, fine-scale movement data and flight height information (if using GPS). Where distribution data are key, lower sampling rates should be used in order to preserve battery life and limit data gaps and incomplete trips. If possible, altimeters should be prioritised for the collection of flight height data as these have a minimal impact on battery life. Where higher resolution data are required, it may be possible to preserve battery life through the use of geo-fences to limit the locations in which these data are collected (e.g., within a wind farm).
Key considerations in relation to tag features:
- Potential to include geo-fences for fast and slow sampling rates.
- Altimeters for flight height measurements
- Output instantaneous flight speeds as estimated using Doppler effect.
Tag effects
It should be acknowledged that in any tracking study, there will be tag effects. However, the key considerations should be whether these effects have an unacceptable impact, either on the birds, or on the quality of the data that is being collected. In many cases, these effects may be small and, given the sample sizes of tagged birds in any individual study, we may lack the statistical power to detect them. Differences in site accessibility and visibility mean that the data to assess tag effects will vary between colony. The exact set of parameters (e.g., productivity, return rates, attendance rates) that can be collected will vary between species and sites. In determining which parameters to collect, it is important to ensure any unnecessary disturbance to the breeding colony is avoided. Where a single species is tracked at multiple sites, it is important to ensure these studies are co-ordinated and that the data collected across these sites are standardised to help overcome any challenges associated with statistical power. This should not be seen as a barrier to collecting additional data at sites where circumstances allow.
Analyses of flight height
Regardless of whether flight heights are estimated using GPS or altimeters, an important first step in the analysis is to calibrate these data based on points at which behavioural classification indicates birds are floating on the sea-surface. In the case of altimeters, this will provide an indication of pressure at the sea surface in any given location which can then be used to calibrate modelled estimates from elsewhere (e.g., ECMWF ERA 5). In the case of GPS estimates, this will help determine whether there is any systematic error in the flight height estimates due to errors in estimating mean sea level from the geoid. Regardless of the methodology used to estimate species flight heights, it should be recognised that there will be uncertainty around them due to error, bias, differences in precision and individual variability. Consequently, these data should be modelled to produce continuous flight height distributions, rather than presented as individual point estimates. Where appropriate, and data allow, distributions can be generated for different behaviours (e.g., foraging or commuting flight), locations or conditions.
Analyses of flight speed
Whilst instantaneous estimates of speed are not routinely reported in the output from all tag types, this should in theory be possible. Tag manufacturers may facilitate requests to record and output these data if researchers raise this prior to placing an order. Subsequent analyses of flight speed from tagging data should be based on these instantaneous measurements of speed, rather than estimated from distance travelled between fixes, an approach which may systematically under-estimate speed. As with flight height, flight speed estimates can be partitioned for foraging and commuting flight and/or analysed in relation to location and local conditions.
Integrating GPS data into assessments of collision risk
GPS tags offer data on flight height, flight speed and levels of nocturnal activity, all of which are potentially of value in relation to assessing collision risk. Indeed, in many cases, these may reflect the best available data. However, integrating these data into collision risk models may not be straightforward.
At present, avoidance rates used for the Band collision risk model are based on comparisons of observed and predicted collision rates. The predicted collision rates are generally based on generic data (e.g. Alerstam et al., 2007), meaning that these data contribute to the model error that is incorporated in the avoidance rates. Using GPS data, which may have been collected at a site-specific level, may alter the predicted collision rates used to estimate avoidance rates and account for some of this model error, with implications for the estimated avoidance rate.
Before incorporating GPS data into collision risk models, there will need to a careful consideration of the implications for the avoidance rate. This could be investigated by comparing collision rates in the absence of avoidance predicted using site-specific GPS data and generic data. If there is a substantial difference between the two predicted collision rates, this may indicate a need for a more fundamental assessment of the model to enable it to incorporate data from sources such as GPS which were not widely available at the time it was developed.
References
Alerstam, T., Rosén, M., Bäckman, J., Ericson, P. G. P., & Hellgren, O. (2007). Flight Speeds among Bird Species: Allometric and Phylogenetic Effects. PLoS Biology, 5(8), e197. https://doi.org/10.1371/journal.pbio.0050197
Babcock, M., Aitken, D., Lloyd, I., Wischnewski, S., & Barratt. (2018). Flamborough and Filey Coast SPA Seabird Monitoring Programme 2018 Report.
Band, B. (2012). Using a collision risk model to assess bird collision risks for offshore wind farms. Retrieved August 23, 2017, from https://www.bto.org/sites/default/files/u28/downloads/Projects/Final_Report_SOSS02_Band1ModelGuidance.pdf
Band, W. (2012). Using a collision risk model to assess bird collision risks for offshore windfarms. SOSS, The Crown Estate, London, UK.
Band, W., Madders, M., & Whitfield, D. P. (2007). Developing field and analytical methods to assess avian collision risk at Wind Farms. In M. de Lucas, G. F. E. Janss, & M. Ferrer (Eds.), Birds and wind farms: risk assessment and mitigation. Madrid: Quercus.
Bivand, R., & Lewin-Koh, N. (2021). maptools: Handling Spatial Objects. R package version 1.1-2. Retrieved from https://cran.r-project.org/package=maptools
Bodey, T. W., Cleasby, I. R., Bell, F., Parr, N., Schultz, A., Votier, S. C., & Bearhop, S. (2018). A phylogenetically controlled meta-analysis of biologging device effects on birds: Deleterious effects and a call for more standardized reporting of study data. Methods in Ecology and Evolution, 9(4), 946–955. https://doi.org/10.1111/2041-210X.12934
Borkenhagen, K., Corman, A.-M., & Garthe, S. (2018). Estimating flight heights of seabirds using optical rangefinders and GPS data loggers: a methodological comparison. Marine Biology, 165(1), 17. https://doi.org/10.1007/s00227-017-3273-z
Brooks, M. E., Kristensen, K., van Bentham, K. J., Magnusson, A., Berg, C. W., Nielsen, A., … Bolker, B. M. (2017). glmmTMB Balances speed and flexibility among packages for zero-inflated Generalized Linear Mixed Modelling. The R Journal, 9, 378–400.
Chamberlain, D. E., Rehfisch, M. R., Fox, A. D., Desholm, M., & Anthony, S. J. (2006). The effect of avoidance rates on bird mortality predictions made by wind turbine collision risk models. Ibis, 148, 198–202.
Chivers, L. S., Lundy, M. G., Colhoun, K., Newton, S. F., Houghton, J. D. R., & Reid, N. (2012). Foraging trip time-activity budgets and reproductive success in the black-legged kittiwake. Marine Ecology Progress Series, 456, 269–277. https://doi.org/10.3354/MEPS09691
Cleasby, I. R., Morrissey, B. J., Bolton, M., Owen, E., Wilson, L., Wischnewski, S., & Nakagawa, S. (2021). What is our power to detect device effects in animal tracking studies? Methods in Ecology and Evolution, 12(7), 1174–1185. https://doi.org/10.1111/2041-210X.13598
Cleasby, I. R., Wakefield, E. D., Bearhop, S., Bodey, T. W., Votier, S. C., & Hamer, K. C. (2015). Three-dimensional tracking of a wide-ranging marine predator: flight heights and vulnerability to offshore wind farms. Journal of Applied Ecology, 52(6), 1474–1482. https://doi.org/10.1111/1365-2664.12529
Clewley, G. D., Clark, N. A., Thaxter, C. B., Green, R. M., Scragg, E. S., & Burton, N. H. K. (2021). Development of a weak-link wing harness for use on large gulls (Laridae): methodology, evaluation and recommendations. Seabird, 33, 18–34.
Cook, A.S.C.P., Ward, R. M., Hansen, W. S., & Larsen, L. (2018). Estimating Seabird Flight Height Using LiDAR. Scottish Marine and Freshwater Science, 9(14). Retrieved from https://data.marine.gov.scot/dataset/estimating-seabird-flight-height-using-lidar
Cook, A S C P, Humphreys, E. M., Masden, E. A., & Burton, N. H. K. (2014). The Avoidance Rates of Collision Between Birds and Offshore Turbines. Edinburgh. Retrieved from http://www.gov.scot/Resource/0046/00464979.pdf
Cook, Aonghais S.C.P., Humphreys, E. M., Bennet, F., Masden, E. A., & Burton, N. H. K. (2018). Quantifying avian avoidance of offshore wind turbines: Current evidence and key knowledge gaps. Marine Environmental Research, 140, 278–288. https://doi.org/10.1016/J.MARENVRES.2018.06.017
Corman, A. M., & Garthe, S. (2014). What flight heights tell us about foraging and potential conflicts with wind farms: a case study in Lesser Black-backed Gulls (Larus fuscus). Journal of Ornithology, 155, 1037–1043. https://doi.org/10.1007/s10336-014-1094-0
Evans, T. J., Young, R. C., Watson, H., Olsson, O., & Åkesson, S. (2020). Effects of back-mounted biologgers on condition, diving and flight performance in a breeding seabird. Journal of Avian Biology, 51(11). https://doi.org/10.1111/JAV.02509
Fijn, R. C., & Gyimesi, A. (2018). Behaviour related flight speeds of Sandwich Terns and their implications for wind farm collision rate modelling and impact assessment. Environmental Impact Assessment Review, 71, 12–16. https://doi.org/10.1016/J.EIAR.2018.03.007
Forsythe, W. C., Rykiel, E. J., Stahl, R. S., Wu, H., & Schoolfield, R. M. (1995). A model comparison for daylength as a function of latitude and day of year. Ecological Modelling, 80(1), 89–75.
Furness, R. W., Garthe, S., Trinder, M., Matthiopoulos, J., Wanless, S., & Jeglinski, J. (2018). Nocturnal flight activity of northern gannets Morus bassanus and implications for modelling collision risk at offshore wind farms. Environmental Impact Assessment Review, 73, 1–6. https://doi.org/10.1016/J.EIAR.2018.06.006
Furness, R. W., Wade, H. M., & Masden, E. A. (2013). Assessing vulnerability of marine bird populations to offshore wind farms. Journal of Environmental Management, 119, 56–66. https://doi.org/10.1016/j.jenvman.2013.01.025
Garriga, J., Palmer, J. R. B., Oltra, A., & Bartumeus, F. (2016). Expectation-Maximization Binary Clustering for Behavioural Annotation. PLOS ONE, 11(3), e0151984. https://doi.org/10.1371/JOURNAL.PONE.0151984
Garthe, S, & Hüppop, O. (2004). Scaling possible adverse effects of marine wind farms on seabirds: developing and applying a vulnerability index. Journal of Applied Ecology, 41(4), 724–734.
Garthe, Stefan, & Huppop, O. (2004). Scaling possible adverse effects of marine wind farms on seabirds: Developing and applying a vulnerability index. Journal of Applied Ecology, 41(4), 724–734. https://doi.org/10.1111/j.0021-8901.2004.00918.x
Hartig, F. (2022). DHARMa: Residual diagnostics for hierarchical (multi-level/mixed) regression models. R Package version 0.4.5. Retrieved from https://cran.r-project.org/package=DHARMa
Harwood, A. J. P., Perrow, M. R., & Berridge, R. J. (2018). Use of an optical rangefinder to assess the reliability of seabird flight heights from boat-based surveyors: implications for collision risk at offshore wind farms. Journal of Field Ornithology. https://doi.org/10.1111/jofo.12269
Johnson, D. S., London, J. M., Lea, M. A., & Durban, J. W. (2008). CONTINUOUS-TIME CORRELATED RANDOM WALK MODEL FOR ANIMAL TELEMETRY DATA. Ecology, 89(5), 1208–1215. https://doi.org/10.1890/07-1032.1
Johnston, A., & Cook, A. S. C. P. (2016). How high do birds fly? Development of methods and analysis of digital aerial data of seabird flight heights. BTO Research Report No. 676. Thetford. Retrieved from https://www.bto.org/research-data-services/publications/research-reports/2016/how-high-do-birds-fly-development-methods
Johnston, A., Cook, A. S. C. P., Wright, L. J., Humphreys, E. M., & Burton, N. H. K. (2014). Modelling flight heights of marine birds to more accurately assess collision risk with offshore wind turbines. Journal of Applied Ecology, 51(1), 31–41. https://doi.org/10.1111/1365-2664.12191
Johnston, D., Thaxter, C., Boersch-Supan, P., Humphreys, E., Bouten, W., Clewley, G., … Cook, A. (2021). Investigating avoidance and attraction responses in lesser black-backed gulls Larus fuscus to offshore wind farms. Marine Ecology Progress Series. https://doi.org/10.3354/MEPS13964
Klaassen, R. H. G., Hake, M., Strandberg, R., & Alerstam, T. (2011). Geographical and temporal flexibility in the response to crosswinds by migrating raptors. Proceedings of the Royal Society B: Biological Sciences, 278(1710), 1339–1346. https://doi.org/10.1098/RSPB.2010.2106
Largey, N., Cook, A. S. C. P., Thaxter, C. B., McCluskie, A., Stokke, Bå. G., Wilson, B., & Masden, E. A. (2021). Methods to quantify avian airspace use in relation to wind energy development. Ibis. Blackwell Publishing Ltd. https://doi.org/10.1111/ibi.12913
Lenth, R. V. (2022). emmeans: Estimated Marginal Means, aka Least-squares means. R package version 1.7.2.
Mallory, M. L., & Gilbert, C. D. (2008). Leg-loop harness design for attaching external transmitters to seabirds. Marine Ornithology, 36, 183–188. Retrieved from http://www.marineornithology.org/content/get.cgi?rn=788
Masden, E. A. (2015). Developing an avian collision risk model to incorporate variability and uncertainty. Edinburgh: Scottish Government.
Masden, E. A., & Cook, A. S. C. P. (2016). Avian collision risk models for wind energy impact assessments. Environmental Impact Assessment Review, 56, 43–49. https://doi.org/10.1016/j.eiar.2015.09.001
Masden, E. A., Cook, A. S. C. P., McCluskie, A., Bouten, W., Burton, N. H. K., & Thaxter, C. B. (2021). When speed matters: The importance of flight speed in an avian collision risk model. Environmental Impact Assessment Review, 90, 106622. https://doi.org/10.1016/j.eiar.2021.106622
Masden, E. A., McCluskie, A., Owen, E., & Langston, R. H. W. (2015). Renewable energy developments in an uncertain world: The case of offshore wind and birds in the UK. Marine Policy, 51, 169–172. https://doi.org/10.1016/j.marpol.2014.08.006
McClintock, B. T., & Michelot, T. (2018). momentuHMM: R package for generalized hidden Markov models of animal movement. Methods in Ecology and Evolution, 9(6), 1518–1530. https://doi.org/10.1111/2041-210X.12995
McGregor, R., King, S., Donovan, C. R., Caneco, B., Webb, A., Webb, A., & Wilson Marine Scotland Science JaredWilson, J. (2018). A Stochastic Collision Risk Model for Seabirds in Flight Authorisations Responsibility Name Signature Date Distribution List Name Organisation Email Address. Retrieved from https://www.gov.scot/Resource/0053/00536606.pdf
Pennycuick, C. (1997). Actual and “optimum” flight speeds: field data reassessed. Journal of Experimental Biology, 200(17).
Péron, G., Calabrese, J. M., Duriez, O., Fleming, C. H., García-Jiménez, R., Johnston, A., … Shepard, E. L. C. (2020). The challenges of estimating the distribution of flight heights from telemetry or altimetry data. Animal Biotelemetry, 8(1), 1–13. https://doi.org/10.1186/s40317-020-00194-z
Ross-Smith, V. H., Thaxter, C. B., Masden, E. A., Shamoun-Baranes, J., Burton, N. H. K., Wright, L. J., … Johnston, A. (2016). Modelling flight heights of lesser black-backed gulls and great skuas from GPS: a Bayesian approach. Journal of Applied Ecology, 53(6), 1676–1685. https://doi.org/10.1111/1365-2664.12760
Schaub, T., Klaassen, R. H. G., Bouten, W., Schlaich, A. E., & Koks, B. J. (2019). Collision risk of Montagu’s Harriers Circus pygargus with wind turbines derived from high‐resolution GPS tracking. Ibis, ibi.12788. https://doi.org/10.1111/ibi.12788
Searle, K., Butler, A., Mobbs, D., Trinder, M., McGregor, R., Cook, A., … Daunt, F. (n.d.). Study to examine how seabird collision risk, displacement and barrier effects could be integrated for assessment of offshore wind developments.
Seward, A., Taylor, R. C., Perrow, M. R., Berridge, R. J., Bowgen, K. M., Dodd, S., … Bolton, M. (2021). Effect of GPS tagging on behaviour and marine distribution of breeding Arctic Terns Sterna paradisaea. Ibis, 163(1), 197–212. https://doi.org/10.1111/IBI.12849
Skov, H., Heinänen, S., Norman, T., Ward, R. M., & Méndez-Roldán, S. Ellis, I. (2018). ORJIP Bird Collision and Avoidance Study. Final report. United Kingdom.
Thaxter, C. B., Johnston, D. T., Clewley, G. D., Humphreys, E. M., & Cook, A. S. C. . (2019). Improving our understanding of seabird behaviour at sea.
Thaxter, Chris B., Ross-Smith, V. H., Bouten, W., Clark, N. A., Conway, G. J., Rehfisch, M. M., & Burton, N. H. K. (2015). Seabird-wind farm interactions during the breeding season vary within and between years: A case study of lesser black-backed gull Larus fuscus in the UK. Biological Conservation, 186, 347–358. https://doi.org/10.1016/j.biocon.2015.03.027
Thaxter, Chris B., Ross-Smith, V. H., Clark, J. A., Clark, N. A., Conway, G. J., Marsh, M., … Burton, N. H. K. (2014). A trial of three harness attachment methods and their suitability for long-term use on Lesser Black-backed Gulls and Great Skuas. Ringing and Migration, 29(2), 65–76. https://doi.org/10.1080/03078698.2014.995546
Thaxter, Chris B., Ross-Smith, V. H., Clark, J. A., Clark, N. A., Conway, G. J., Masden, E. A., … Burton, N. H. K. (2016). Contrasting effects of GPS device and harness attachment on adult survival of Lesser Black-backed Gulls Larus fuscus and Great Skuas Stercorarius skua. Ibis, 158(2), 279–290. https://doi.org/10.1111/ibi.12340
Tjomlov, R. S., Skov, H., Armitage, M., Barker, M., Cuttat, F., & Thomas, K. (2021). Resolving key uncertainties of seabird flight and avoidance behaviours at offshore wind farms. Annual Report for April 2020 to October 2020. Report to AOWFL.
Toke, D. (2011). The UK offshore wind power programme: A sea-change in UK energy policy? Energy Policy, 39(2), 526–534. https://doi.org/10.1016/j.enpol.2010.08.043
Wakefield, E. D., Owen, E., Baer, J., Carroll, M. J., Daunt, F., Dodd, S. G., … Bolton, M. (2017). Breeding density, fine-scale tracking, and large-scale modeling reveal the regional distribution of four seabird species. Ecological Applications, 27(7), 2074–2091. https://doi.org/10.1002/eap.1591
Wischnewski, S., McCluskie, A., Bouten, W., Adlard, S., Babcock, M., & Wright, L. J. (n.d.). Plasticity in offshore space-use and behaviour across time governs the susceptibility of seabirds to offshore wind farms.
Wischnewski, S., Sansom, A., McCluskie, A., Bouten, W., Adlard, S., Aitken, D., … Wright, L. J. (n.d.). Temporal and spatial patterns in the offshore behaviour and distribution of kittiwakes: Lessons for Marine Spatial Planning.
Contact
Email: ScotMER@gov.scot