Tackling child poverty: third year progress report 2020-2021
The third annual progress report for 'Every child, every chance: tackling child poverty delivery plan 2018-2022'.
2. Assessing progress against the targets
This chapter provides an overview of key measures around child poverty in Scotland and includes information on:
- overall progress towards the child poverty targets
- updated child poverty data amongst priority groups
- trends on child poverty drivers
- poverty data in Scotland and the rest of the UK and
- progress towards modelling impact of policies on child poverty
Most of the data used to understand child poverty has a significant time-lag meaning that most of the data in the measurement framework relates to a period before the catastrophic impacts of the COVID-19 pandemic on Scottish society. Given the significance of this, other evidence is used to provide some additional context while we wait for data to become available.
Child poverty levels
Overall, the data indicates that significant progress needs to be achieved in the years ahead to deliver upon the 2030 targets.
Relative poverty has slowly increased while absolute child poverty, persistent poverty and the proportion of children who are in combined low income and material deprivation have remained relatively stable but still well above the targets. The most recent child poverty statistics, published in March 2021, relate to the period from April 2019 to March 2020, as such providing a picture of poverty pre COVID-19.
The charts below show change over time. Single year estimates help understand the situation at a certain point in time while three year averages show trends more accurately. Further information on historical trends over time can be found in the latest child poverty update[35].
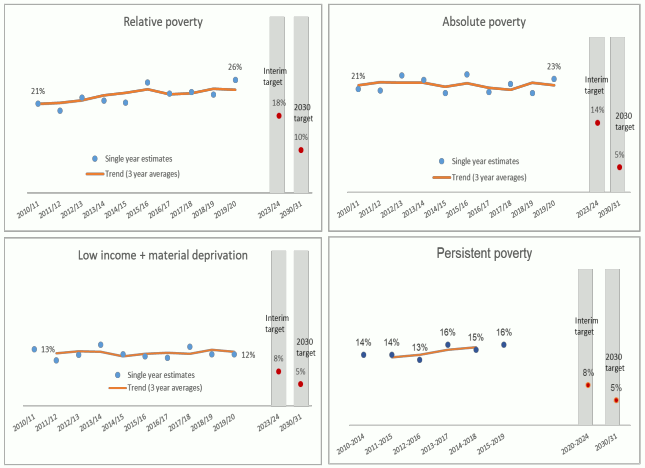
Recent projections suggest child poverty targets will be even more challenging to achieve given the pandemic and subsequent longer term impact on the economy. The economic effects of COVID-19 are likely to disproportionately affect those on low incomes with limited savings, many of whom work in sectors that have been subject to restrictions: hospitality, tourism, manufacturing, entertainment, non-food retail and wholesale, as well as sectors where working from home is more problematic. People working in these sectors were already much more likely to be in poverty.[36]
Child poverty priority groups
Every Child, Every Chance identified six priority groups that are at a higher than average risk of poverty. These were households with a disabled person, three or more children, a baby aged under 1, minority ethic, young mothers aged under 25, and lone parent families.
The priority groups identified remain at a higher than average risk of poverty. Particularly notable is the proportion in poverty amongst lone parents and minority ethic households, and how persistent poverty continues to be higher amongst households with three or more children.
The tables below provide latest statistics on poverty after housing costs for the most recent periods. Further details on poverty rates among priority groups over time are published online[37].
| Priority Group | Relative poverty | Absolute poverty | Low income + material deprivation |
|---|---|---|---|
| All children | 24% | 22% | 13% |
| Lone parent household | 38% | 35% | 26% |
| Minority ethnic household | 38% | 34% | 17% |
| Baby aged under 1 in household | 34% | 30% | 13% |
| 3+ children in household | 32% | 29% | 19% |
| Disabled person in household | 29% | 26% | 20% |
(Source: Family Resources Survey)
(Source: Understanding Society)
| Priority Group | Persistent poverty |
|---|---|
| All children | 16% |
| Disabled adult in benefit unit | 14% |
| 3+ children in benefit unit | 33% |
| Children under 5 in benefit unit (note: there is no data for baby under 1) | 27% |
We do not have estimates of poverty levels among all of the priority groups for all four of the child poverty measures. This is because the number of families surveyed in some of the groups is too small to provide a robust estimate of the percentage who are in poverty in this group in the wider population. However, each year, we focus on a specific priority group to better understand specific circumstances and challenges. This year the focus report is on households with a disabled person[38]. A full report will be published in the coming weeks.
The drivers of child poverty
To help understand what is driving child poverty trends over time, it is important to examine progress in relation to the things that we know influence child poverty levels, including employment, costs of living and social security[39]. Not all of the levers of change have been devolved to the Scottish Government. For example, the UK Government continues to have responsibility for the key means-tested benefits, including Universal Credit[40].
The most recent statistics on the drivers of poverty relate to the period up to March 2020. As such, some of the positive indications of progress in the drivers may not be long lasting with many workers being made redundant, furloughed or with working patterns shortened, and many sectors failing after long periods of inactivity as a result of the COVID-19 pandemic.
The latest data[41], pre COVID-19, indicated that some drivers of child poverty were moving in the right direction; this included key employment indicators, skills, and childcare availability. Housing costs and other costs of living remained relatively stable and evidence suggests that lower housing costs can be credited with lower poverty rates in Scotland compared to the rest of the UK. Still, lack of affordable childcare appears to remain a barrier, and high levels of food insecurity show the continued deprivation many families faced already pre pandemic.
For school age children, childcare available during the school holidays has remained relatively stable but the availability of childcare outside of school hours is increasing year by year. However, a quarter of the households paying for childcare for a child aged 0 to 11 report that they find it difficult or very difficult to afford childcare. The availability of affordable and accessible childcare can have a significant positive impact on maternal employment rates, particularly those with lower skills and educational attainment[42].
The COVID-19 pandemic has brought into sharp focus the critical role that childcare plays in supporting the labour market. Evidence suggests that during periods of lockdown with school and nursery closures, housework and childcare has fallen more on women than men. Women are one of the groups on which the economic effects of this crisis are falling disproportionately. In particular, households with only one earner are more exposed to the impacts of earnings reductions or losses and lone parents may be less likely to have someone to share childcare with, making paid work harder. Many more lone parents may be pushed into poverty in coming years.[43]
The latest data on food affordability (the percentage of income spent on food and non-alcoholic drinks) showed a picture pre pandemic where there had been an improvement for low income households with children. Still, people in poverty in Scotland were less likely to experience high food security than other parts of the UK[44]. More recently, loss of income because of the pandemic left many people struggling to cover the costs of essentials. Food Standards Scotland, through their Consumer Tracking survey [45], found that worries about being able to afford food peaked at the start of the pandemic (at 25%) and then stabilised at 18%. The research also showed that the proportion of households with children using foodbanks is higher (10%) than amongst all households (5-6% all households).
With regards to housing costs and other costs of living, the indicators suggest that things had, in general, remained relatively stable prior to COVID. The percentage of income spent on housing and food by all households with children in Scotland and low income households with children in Scotland has continued to remain static. However, the figures for Scotland continue to remain lower than for the UK as a whole.
There had also been a decrease in the median ratio of fuel running costs to net household income. This may be positive as families spending a greater percentage of their income on fuel may be less likely to afford other essential goods and services[46]. As previously mentioned, these trends do not take into account the impact of COVID-19 on these indicators and, with winter lockdowns and high levels of home-working, it is highly likely that these figures will increase for the 2020/21 period.
Other issues worth highlighting:
- Any paid work is not enough. Having paid work is an effective way out of poverty, and those families where all adults are in full-time work have a low poverty risk. But having a job is not always enough, for example when it does not pay well, or when someone is unable to work enough hours. Two thirds of children in poverty live in a working household.
- Delayed introduction of major policies. Some of the key policies aimed at reducing child poverty had a softer or delayed launch due to COVID-19 – including Parental Employability Support Fund and expansion of funded Early Learning and Childcare. Available statistics still precede the introduction of some policies and any impact will take some time to be evident.
- Slow impact is to be expected. While some drivers of change have moved in a positive direction, the impact of any of these changes in child poverty targets will take time to be evident. Some of the drivers will require some time to directly impact on financial improvements for households such as housing or childcare availability.
- The data refers to the pre COVID-19 period. The impact of the pandemic is predicted to be particularly harsh for some sectors of the population including low income households and priority families.
The most recent comprehensive comparison on poverty rates between the UK and Scotland can be found in the child poverty progress report published in 2020[47]. Updated data on key employment indicators show a modest increase in the average hourly pay which continues to be higher in Scotland than in the UK as a whole[48]. The difference in average number of hours worked per week, a key driver influencing income from employment, continues to be evident between Scotland (24 hours per week) and the UK as a whole (22 hours per week).
Details of trend data for the drivers of child poverty are presented in Annex A.
Evaluating our policies
Updates on individual policy evaluations are provided in chapter 1 of this progress report. As set out in the evaluation strategy[49], our evaluation efforts have been focused on those actions likely to have the biggest impact on the child poverty targets.
The Scottish Government’s Tackling Child Poverty Delivery Plan 2018-2022 also made a commitment to investigate methods to produce a quantitative, cumulative impact assessment of the policies on child poverty.
We are taking forward modelling work on child poverty which falls into two strands. First, we are assessing the cumulative impact of current Scottish Government policies on child poverty. This work was completed for the 2020 Progress Report but was suspended in light of the impacts of COVID-19. We are currently revising the work with additional policies and plan to publish this work in due course. Second, using the same modelling tool, we are carrying out scenario modelling to determine which interventions are required to meet the child poverty targets. This work will be used to help inform strategic decisions and will continue to be refined as we engage with internal and external stakeholders.
Local Child Poverty Action Reports are jointly developed by Local Authorities and Territorial Health Boards to outline activities and commitments to reducing child poverty in local areas. The 2019/2020 reports describe activity between April 2019 and March 2020, and include planned future activity for the year ahead. The Improvement Service analysed each report around commitment, partnership working, and a range of key policy levers.
The Improvement Service found that the reports highlighted strong partnership working and the ability to adapt different policy levers to suit local needs. Collectively, they assessed that while there is a recognition and frustration that local activities may not make significant ‘dents’ in national child poverty levels, it was clear that activities make a significant contribution locally and to individuals experiencing poverty in local areas.
The pandemic forced local areas to respond urgently with a shift of resource into a humanitarian response. Going forward, local areas will endeavour to return to a more strategic approach ensuring that local policy making is drawn from the voices of those with lived experience. In addition, the Improvement Service noted that local efforts could benefit from a more consistent and targeted approach to priority groups and those with protected characteristics.
Contact
Email: sjsu@gov.scot