Tackling Child Poverty Delivery Plan: progress report 2024-25
The third annual progress report for 'Best Start, Bright Futures: Tackling Child Poverty Delivery Plan 2022-2026'. Outlining action for the period 2024-25.
Section 2 - Assessing progress against the targets
While the rest of this report looks at progress from April 2024 to March 2025, this section draws on the available survey data, which covers up to March 2024. Specifically, this section includes:
- progress against the interim child poverty targets
- why the interim targets have not been met
- updated child poverty data on priority groups
- assessment of child poverty drivers (income from employment, cost of living and income from social security) including key indicators and contribution from policies
- progress towards 2030, including cumulative impact assessment
Progress against child poverty interim targets
The targets set by the Child Poverty (Scotland) Act 2017 are based on single year figures for three out of the four targets, and the latest single year figures for 2023-24 determine whether the interim targets have been met. The target for the persistent poverty measure is based on data from the 2020 to 2023 calendar years.
The latest statistics show that all measures are above interim target levels.
- 22% of children lived in households in relative poverty. Relative poverty measures the proportion of children living in in households with an equivalised income below 60% of the contemporary UK median income. Relative poverty falls if income growth at the lower end of the income distribution is greater than overall income growth. The interim target was set at <18%.
- 17% of children lived in households in absolute poverty. Absolute poverty measures changes in poverty relative to a point in time taking inflation into account. The absolute poverty line is fixed at 60% of median UK income in 2010-11. Specifically, it shows the proportion of children in families with an inflation adjusted equivalised income below 60% of the UK median income in 2010-11. Absolute poverty falls if low income households are seeing their incomes rise faster than inflation. The interim target was set at <14%
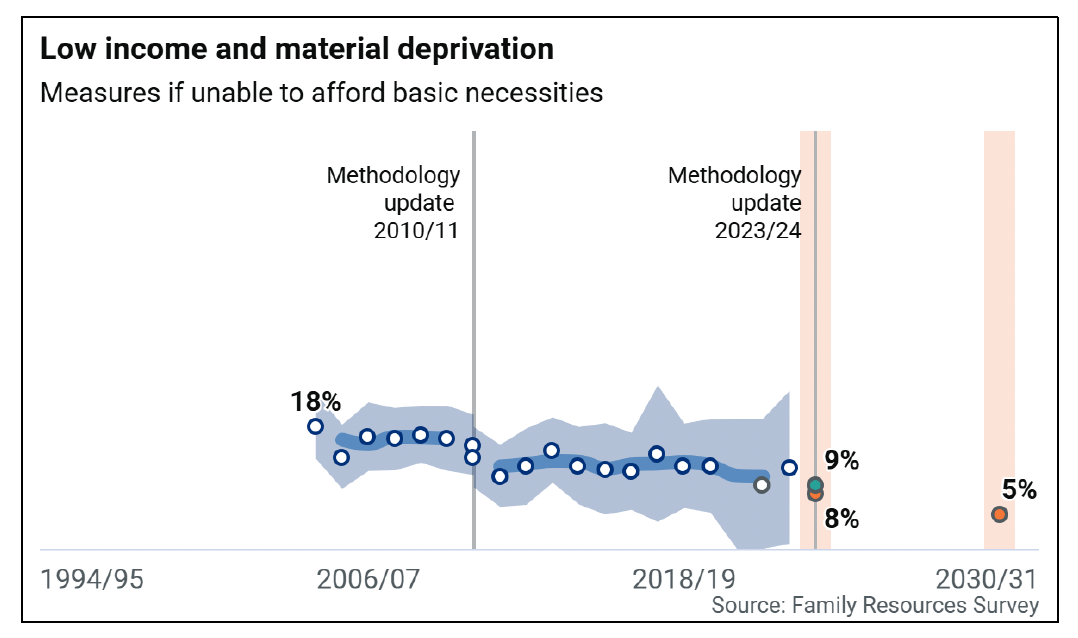
- 9% of children lived in households in combined low income and material deprivation. This measures whether households are able to afford basic necessities. Specifically, it represents the proportion of children in families with incomes less than 70% of the contemporary median that lack certain basic necessities. The interim target was set at <8%. This measure was updated for 2023-24 and is not comparable with previous years.
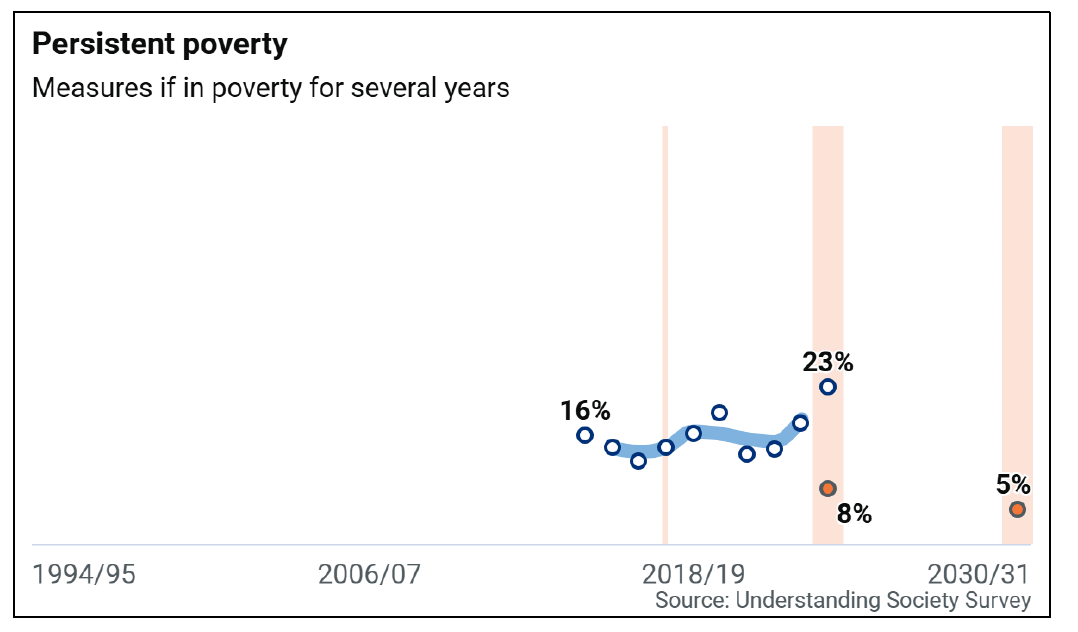
- 23% of children lived in households in persistent poverty. Persistent poverty measures whether people have been living in poverty for a number of years. Specifically, it shows the proportion of children in families who have been in relative poverty for three out of the past four years. The interim target was set at <8%.
A summary of the data is shown in Table 2.1.
| Measure | 2017-18 baseline prior to Act | 2022-23 estimates[1] | 2023-24 latest estimates* | 2023-24 Interim target | 2030-31 Final target |
|---|---|---|---|---|---|
| Relative child poverty | 24% | 26% | 22% | <18% | <10% |
| Absolute child poverty | 22% | 23% | 17% | <14% | <5% |
| Low income and material deprivation | 14%[2] | 12% | 9% | <8% | <5% |
| Persistent poverty | 14% (2013-17) | 17% (2018-22) | 23% (2019-23) | <8% | <5% |
Source: Family Resources Survey and Understanding Society Survey
While single year figures have fallen in the latest data, the long-term child poverty rates (looking at three-year averages) have shown little consistent change in recent years. However, the three-year average data shown does not yet include the full roll out of the Scottish Child Payment across all years. Specifically, trends for relative and absolute child poverty have been broadly stable over the past decade, meaning that a downward trend towards interim and final targets is yet to be seen. Trends for the combined low income and material deprivation measure have also been broadly stable prior to the measure being updated for 2023-24.
The estimate for persistent child poverty has fluctuated between 12% and 19% since data collection started in 2010, increasing to 23% in the latest period. Persistent poverty estimates tend to be routinely revised due to respondents dropping off and re-joining the survey in future years. For example, persistent poverty rates were previously reported to be as low as 10% in 2016-20, however this has subsequently been revised to 13%. With further reductions in sample size, there may be larger revisions going forwards. However, it should be noted that in the most recent wave, the survey included a boost of around 5,700 UK households. Data including this increased sample will not be available until the 2022-26 publication, when four years’ worth of data can be included. It is still unclear what the impact of the boost on the number of households with children in Scotland will be.
It is also useful to consider the persistent poverty indicator time frame in light of the contrasting indicator trends. The latest persistent poverty data looks back to 2019-23 and is derived from the Understanding Society Survey. In contrast, the latest data for the other child poverty targets is for 2023-24 and derived from the Family Resources Survey. The economic climate was different in Scotland during the persistent poverty period (Covid-19, cost of living crisis etc), where we see an increase, while more recent decreases in 2023-24 are seen for relative and absolute poverty indicators.
While the range, scale and impact of actions delivered by the Scottish Government and other partners to reduce child poverty over the years have been documented in the annual progress reports and local child poverty action reports, it is likely that they have mainly served to mitigate the pressures resulting from a difficult financial environment, rather than resulting in a marked drop in observed rates of poverty.
In recent years rates of relative child poverty after housing costs have remained around six percentage points below the UK average. As shown in table 2.2 below, in 2023-24, the first year in which the full impact of SCP was recorded in data, rates of relative and absolute poverty were nine percentage points lower. Further data will be required to determine any long-term impact on poverty trends.
Table 2.2: Child poverty target measures compared to UK
Shows rates after housing costs (AHC) and the percentage point change from the previous year. Persistent poverty latest year relates to 2019-2023 and percentage point change from 2018-2022. Low income and material deprivation cannot be compared with the previous year due to a change in question wording.
| Region | Relative poverty | Absolute poverty | Low income & mat. Dep. | Persistent poverty |
|---|---|---|---|---|
| UK latest (2023-24) | 31% | 26% | 19% | 18% |
| Change from 2022-23 | +1 | +1 | n/a | 0 |
| Scotland latest (2023-24) | 22% | 17% | 9% | 23% |
| Change from 2022-23 | -4 | -6 | n/a | +5 |
Source: Family Resources Survey and Understanding Society Survey
The Family Resources Survey (FRS) release strategy sets out plans to improve the quality of data collected. While recruitment and retention of sufficient interviewers has continued to be challenging, improvement plans include replacing survey responses for state benefits with information from administrative records where possible, and ensuring that the survey results better reflect receipt of main DWP benefits across the population. Following on from work with DWP to ensure receipt of the Scottish Child Payment was accurately reflected in the FRS data for 2023-24, Scottish Government analysts have been engaging with the DWP on an on-going basis to ensure reporting is robust and accurately reflects the impact of any changes.
Why the interim targets have not been met
The two Tackling Child Poverty Delivery Plans published to date have outlined a robust package of action to drive progress towards the targets and to break the cycle of poverty in the longer term. The delivery plans have been stress-tested through consultation processes, stakeholder engagement and ongoing Governance monitoring and reviews. There is widespread consensus that the overarching focus on the drivers of poverty reduction is the correct one and that our action is focusing on the correct issues. Cumulative impact modelling, published in February 2024, suggested there was a path toward meeting the interim targets. Delivery Plans have been developed with a thorough evidence base supporting the approach (such as the What Works evidence paper), and this has recently been reaffirmed with the international review of approaches to tackle child poverty.
Over the period of the two delivery plans, a range of factors have made the circumstances particularly challenging in terms of delivering on the aspirations of the Child Poverty (Scotland) Act 2017. This includes budgetary conditions, a period of increased volatility and instability, the impact of the wider policy landscape, and labour market conditions. These factors, and details of the impact of each on our delivery, are set out below. While each of these factors are important, in reality it is not possible to attribute failure to meet the targets to any one action or event – it is the cumulative impact of these, and broader issues, that have contributed.
Budgetary pressure
Since ‘Best Start, Bright Futures’ was published, financial pressures have meant budgets have been reduced impacting key policies, such as employability, housing, and childcare amongst others. As a result, the Plan could not be implemented at the scale originally envisaged. While this may make the final targets more difficult to meet, this will not have materially impacted the interim targets.
A period of increased volatility and instability
Since the Act came into force Scotland has been facing significant economic and societal changes, with research highlighting the impacts of the Covid-19 pandemic, economic impacts of EU exit and Russia’s illegal full-scale invasion of Ukraine, and cost of living pressures. All of these together presented serious economic and social challenges for Scotland and the UK, which have had a detrimental effect on businesses, communities, households, public sector budgets and the delivery of key public services.
While periods of crisis affect everyone, some households are more vulnerable than others to increased volatility. Low income households were, and continue to be, particularly adversely affected. They are financially more vulnerable to inflationary pressures than better-off households, and often pay more for essential goods and services. Evidence shows that the financial support provided by Scottish Government during the Covid-19 pandemic, for example, helped low income families to weather the financial strain of rising costs and reduced the need to cut back on essentials or take on debt to pay for goods.
Following on from Covid-19, Scotland as well as the rest of the UK, experienced a ‘cost of living crisis’. Low income households were particularly affected. Only recently (starting from 2023) have we seen a fall in inflation, which was accompanied by stronger earnings growth. However, the benefits of lower inflation are not immediately felt by households. Indeed, polling shows that for many people (including low income households) it does not feel like things are getting better. In a more mechanistic sense, achieving reductions in child poverty when price levels and earnings grow faster than usual represents an uphill battle, since these tend to determine the absolute and relative poverty lines respectively.
The wider policy landscape
The continuation of welfare reform policies, and wider cuts to investment in public services at a UK level, have had a significant bearing on child poverty. The policies implemented at UK level in the social security space have counteracted Scottish Government efforts to reduce child poverty. Particularly notable is the two-child limit, which will have a greater impact each year as more and more children born after 2017 are impacted. The impacts of the limit have already been evident in the statistics: while poverty rates have fallen for smaller families, they have risen for families with three or more children, with the composition of those in poverty consequently shifting towards this group. The freeze to working-age benefits between 2015 and 2020 also continues to have an impact: although the main rates of Universal Credit and other benefits have since been uprated, they remain lower than they would have been without the freeze. While devolution provides the Scottish Government with a range of powers to drive the child poverty mission, there are some areas outwith Scotland’s control, for example around employment law, migration, UK-wide social security, foreign policy and trade deals. All of which have an impact on the wider Scottish economy and quality and types of jobs available for people, including low income families.
Relationship between the labour market and poverty
The labour market can play a significant role in reducing child poverty. However, since the Plan came into force, there has been a steady increase in in-work poverty, meaning that for many families having a job is not a guaranteed route out of poverty. Indeed, 75% of children in relative poverty live in working households, with this proportion continuing to rise in recent years in line with the trend seen across the rest of the UK.
There are a number of factors that can compound the relationship between work and poverty:
- Employment rates and hourly wages are important, but so too are working hours (work intensity). The proportion of female employees aged 18 or over earning less than the Real Living Wage has fallen from 22% in 2017 to less than 13% in 2023,[3] although real wages have been broadly stagnant on average; while the employment rate among women with dependent children also increased at least up until the Covid-19 pandemic.[4] However, as discussed below, work intensity amongst low-income households with children has decreased. Recent microsimulation analysis also indicates that work intensity in families with children is noticeably lower in Scotland and the UK than in comparator European countries, particularly for lone-parent families[5]. The child poverty rate in families where all adults are in full-time work has remained consistently low in recent decades, at 5% in 2021-24 compared to 23% for children across the population.
- Earnings are not always, or even usually, stable.[6] This is particularly true in certain sectors (e.g. hospitality and social care) and for certain forms of employment (e.g. part-time work and temporary contracts) which can impact financial security for households.
- The relationship between earnings and poverty is not straightforward, because poverty is measured at a household level. If a low-paid person lives with a higher paid person, the household as a whole may not be counted as living in poverty.
- For relative poverty to be reduced, incomes for low income families need to grow faster than incomes for the higher income families. For absolute poverty to be reduced, incomes need to grow faster than inflation. Neither of these things have occurred to a sufficient degree in the period since the Plan came into effect.
Analysing what has driven changes
In order to better understand what has driven changes in child poverty rates over time, the Scottish Government has used a statistical method to decompose changes in child poverty rates into incidence effects (changes in poverty risk for different groups) and composition effects (changes in the relative size of different groups). The analysis focuses on four key characteristics: housing tenure, family type, work status, and number of children in the household. The analysis compared each of these characteristics: between 2015-18 (the last three years before the Child Poverty (Scotland) Act 2017) and 2021-24 (the latest three years of data).
While there was little change in aggregate rates of relative child poverty after housing costs between 2015-18 and 2021-24, this did mask some notable changes in poverty for subgroups, in particular relating to family size and work status:
- There were notable divergences in poverty for families depending on the number of children. Families with 1 child saw a decrease in child poverty rates from 25% to 22%, while families with 2 children saw their child poverty rate decrease from 20% to 14%. Due to the size of these groups together they pushed down the overall child poverty rate by 3.5 percentage points. However, children in families with 3 or more children saw increases in their relative poverty rate, from 32% to 41%, with the proportion of all children who live in larger families also increasing from 24% to 27%. The combined increase in proportion of children in larger families, and the higher child poverty rate among this group, counteracted the reductions seen in families with less children by 2.7 percentage points, resulting in an overall small decrease in child poverty. This divergence in outcomes is likely to be, at least in part, due to the two-child limit imposed on families with children born after April 2017.
- There were small increases (from 23% to 25%) in the child poverty rate for families that were in work, but with at least one adult working less than full time. This pushed aggregate child poverty rates up by just over 1 percentage point due to the relatively large size of this group, representing nearly half of children in poverty. Despite this, the overall child poverty rate decreased slightly due to two other groups. Families with no adults working, which tend to have the highest poverty rates, saw a decrease in their child poverty rate, and also decreased as a proportion of children across the population. Additionally, there was an increase in the proportion of children living in families with all adults in full time work. Due to the relatively high child poverty rate for families with no work, and relatively low child poverty rate for families with all adults working full-time, the change in relative size of these groups helped push down child poverty. These changes suggest that limited work intensity, alongside barriers to full-time work, are important factors in keeping relative child poverty rates from falling.
Child poverty rates amongst groups most at risk
There are some types of households who have a higher risk of poverty, and make up the majority of those in poverty, we refer to these as ‘priority groups’. These are households with a disabled person, three or more children, a baby aged under 1, minority ethnic households, mothers aged under 25, and lone parent families.
The latest available child poverty rates continue to show that those in priority family groups are more at risk of being in poverty than all children, and in particular those whose families have none of these characteristics. The latest figures are shown in Table 2.3, alongside comparative baseline year data when the Act came into force.
Since the Act came into force, reductions in poverty rates amongst priority groups have been mixed. Relative poverty is slightly lower than when the Act came into force for lone parent (-4 percentage points) and disabled households (-3 percentage points). In contrast, ethnic minority households and children in households with a baby under one saw relative poverty increase by 3 percentage points. For families with three or more children, the increase has been more pronounced at 9 percentage points. Intersectional analysis of relative poverty highlights considerable overlaps between larger families and other priority family characteristics. Notably this includes families with a disabled person (49%), lone parents (33%), and ethnic minority households (25%). Therefore, increases in poverty rates for larger families will impact all other family types. It is worth noting as well, that poverty rates for priority groups are calculated by combining a number of years of data. This means that the full impact of the two-child limit will not be fully evident yet.
With respect to absolute poverty rates, decreases have been seen for children in households with a baby (-5 percentage points) or a disabled person (-4 percentage points). There has been little change to absolute poverty for lone parents or minority ethnic groups. Whereas amongst children in households with three or more children, absolute poverty increased by 7 percentage points. Multiple studies[7] have shown the negative impact that the two-child limit has had for poverty rates in general, and for large families in particular. Scottish Government analysis estimates that by the end of 2024-25, the two-child limit withheld a cumulative total of £377 million from Scottish households since it was introduced, equivalent to £424 million in 2024-25 prices.[8]
| Relative poverty | Absolute poverty | |||||
|---|---|---|---|---|---|---|
| Baseline of 2015-18 | Latest estimates 2021-24 | Diff ppts | Baseline of 2015-18 | Latest estimates 2021-24 | Diff ppts | |
| All children | 24% | 23% | -1 pp | 22% | 20% | -2 pp |
| Lone parent household | 40% | 36% | -4 pp | 35% | 32% | -3 pp |
| Minority ethnic household | 34% | 37% | +3 pp | 32% | 31% | -1 pp |
| 3+ children in household | 32% | 41% | +9 pp | 29% | 36% | +7 pp |
| Disabled person in household | 30% | 27% | -3 pp | 27% | 23% | -4 pp |
| Baby aged under 1 in household | 32% | 35% | +3 pp | 30% | 25% | -5 pp |
| Mothers aged under 25 | 55% | No data | No data | 49% | No data | No data |
Source: Family Resources Survey, Scottish Government analysis
There is no data on the other two targets of low income and material deprivation, and persistent poverty. Low income and material deprivation data cannot be shown by priority family types. This is because the questions on material deprivation have changed in the latest survey year and as such cannot be combined to provide a single estimate. Persistent poverty data comes from the Understanding Society survey. It is not possible to update figures by priority family group due to small sample sizes. But considering the consistent greater risk of poverty for priority groups under other indicators, it is expected that persistent poverty will also be higher.
Since 2018, we have published further details on poverty rates among priority groups over time and a summary evidence review of barriers and what works for these groups. A detailed report for each priority family group has also been published. These focus reports look at child poverty rates and progress in relation to each of the three drivers of poverty, alongside wider evidence. Previously published reports include: minority ethnic families, lone parent families, families with a disabled adult or child, families with mothers aged 25 or under, and families with a baby. In addition, Public Health Scotland has published a focus report for families with three or more children. These reports are complemented with analysis on other groups at higher risk of poverty. In addition, this annual progress report is accompanied with a focus report on gendered poverty, specifically on the link between poverty and gender and how policies that form part of ‘Best Start, Bright Futures’ take a gendered lens to policy making.
The drivers of child poverty
In order to better understand changes in the target measures of child poverty, we look at the three drivers of poverty. That is: income from employment, cost of living, and income from social security and benefits in-kind. The measurement framework provides a range of indicators for each of the drivers that can be tracked over time. In addition, the below summary of progress includes impact findings from evaluations of relevant policies.
Income from employment
As noted previously, a job does not guarantee a life out of poverty or financial security. Indeed, there has been a slow but constant upward trend in the levels of in-work poverty amongst households with children. This is due to a combination of various factors, including limited growth in earnings (particularly for low-paid jobs) and low work intensity (number of hours worked).
The economy in Scotland has undergone a reset since the start of 2022 following Covid-19 and more recently the inflation shock which has placed significant strain on household finances. While the first half of 2024 saw improvements across a range of key economic indicators (GDP strengthened modestly, increased business activity, positive real earnings growth and positive consumer sentiment), the data collected as part of this report covers March 2023 till March 2024. This means that improvements in the economy were not yet evident. With economic growth remaining largely flat across 2022 to 2023, it is expected that indicators around driving income from employment are also stable from previous years.
We monitor a range of indicators to better understand progress (or lack of) in supporting families to increase their income through paid work. Overall, indicators in this space have remained largely unchanged from the previous reporting year.
Specifically, hourly pay has remained largely unchanged in real terms since 2017, with nominal increases eroded by inflation. While there have been continuous increases in the number of people being paid the Real Living Wage, it is uncertain whether parents are benefitting from this. We have also seen an improvement in the gender pay gap, though the gap still remains and women continue to be paid less than men. Limited earning growth will put added pressure on household budgets.
A similar pattern is seen in the number of hours worked. Low-income households with children continue to work less hours than all households with children. Over time, work intensity amongst low-income households with children has also decreased (from 24 hours worked on average in 2017-20 to 21 hours in 2021-24). This compared to around 32 and 31 hours respectively amongst all households with children. Unpaid work, such as caring for children or other family members/friends, remains a key barrier to increasing paid hours. This particularly affects women, who continue to do most of the unpaid work in the household. We also know that parental work intensity is higher in countries with lower poverty rates, supported by policies such as strong childcare systems.
Employability support can help parents to increase their earnings. In fact, as stated in the previous section of this report, there have been continuous increases in the number of parents reached through employability support. Positive outcomes are achieved for those who engage with the service, though at limited scale. For example, amongst those reached by the service (from 2019 till 2024), 31% had entered employment and a further 14% had entered further or higher education or training.
The Fairer Futures Partnerships - which bring local and national partners together to build more integrated, responsive services for families at risk of poverty - have also demonstrated ways to enhance the provision of employability support. This has involved enhancing connections to wider support services to tackle employment barriers more holistically and build capabilities, and developing and testing new ways of delivering employability with employers. For example, in Dundee, learning from the Fairer Futures Partnership has been used to shape the redesign of the employability service, by strengthening community support models and using targeted keyworker outreach; in Glasgow, the Partnership has tested ‘intermediate labour market’ projects that provide a supported bridge to employment, by providing a work placement, accompanied by additional training or support; and in Clackmannanshire, there has been increased tailoring and joining up of employability support with other services (childcare, financial advice, vocational training, mentoring) through a ‘One Stop Shop’, and work with public sector employers to offer flexible working arrangements, through a collaboration with Flexibility Works. Findings from these evaluations will be published in the next month.
A key barrier to increasing income through paid work is the availability of childcare. This is evidenced in the evaluation of No One Left Behind. Childcare responsibilities preventing access to training or work was reported as an issue by 53% of single parents; 25% women and 5% men. Generally, normal full-time working hours for parents are longer than school hours. That is why, as part of the measurement framework, we look at the percentage of day care places that are open before and after school hours. Since tracking began there has been a continuous increase in the proportion providing a more wrap-around support during school terms. In 2023, 56% of day care places were open before and/or after school hours (compared with 41% in 2017 as the Act came into force). Wrap-around support can facilitate family logistics around paid work patterns – particularly for women who do most of the unpaid childcare and are more likely to reduce working paid hours to accommodate family demands.
While provision during school term-time seems to be increasing, there has been a drop in the proportion of children’s day care places that operate during the school holidays, with this falling from 67% in 2021 and 2022 to 56% in 2023 (see Annex A). It is unclear from the wider evidence what is causing this recent drop. We know that parents also use a range of wider services, including activity and hobby clubs, to extend the school day and provide childcare options. These are often more affordable than registered childcare services and their usage is not captured in day care places data. We recognise this through our School Age Childcare Programme and are considering the full range of services that families might use to provide childcare options.
The expansion of funded early learning and childcare (ELC) (i.e. the 1140 hours per year of free childcare) and policies on school age childcare, including investment in six childcare Early Adopter Communities, are expanding access to affordable childcare for low-income families. An Interim Evaluation Report published in August 2024 found that there were promising signs that the ELC expansion is having positive impacts for parents supporting them to work or look for work and reducing costs for families. Evaluation of funding to test new models of school age childcare also found qualitative evidence that projects had contributed to parents being able to start, maintain or progress their career, and to improvements in parental health and wellbeing.
Cost of living
The cost of living is the term used to refer to the prices of goods and services in the economy. Inflation refers to the rate of increase in these prices. There are various metrics for measuring inflation. For this section we will look at Consumer Price Index (CPI) inflation.
Following a peak during 2022 (at 11.1%), inflation slowly decreased over 2023 stabilising in 2024 above the 2% target[9]. The full benefits of the lower inflation rate recorded in 2024 will still not be evident in this report as indicators on cost of living cover the period 2023-24 when inflation was still on a downward trend from its peak. The latest CPI rate for March 2025 was 2.6%[10] and the Office for Budget Responsibility forecasts[11] do not expect CPI inflation to reach the Bank of England’s 2% target again until 2029.
We understand that low-income families have relatively few resources to draw on when challenged, and that the additional support provided in Scotland can be a lifeline for many families.[12] Low-income families are more vulnerable to increases in the cost of living as they spend a greater proportion of their income on essentials (such as housing, energy or food). While inflation has dropped, it does not mean that prices drop, only that they increase at a slower pace, hence, the impact on low-income families will not be immediate. There are limited signs of improvements for families. Affordability of transport has increased with the proportion of income spent on transport dropping for all families with children, including those on a low income. Evidence shows that transport policies are indeed having a positive impact for families. The Young Person’s Free Bus Travel Scheme in particular, is having significant financial benefits for young people and their families, making travel more affordable. It also appears to have increased young people’s access to services and opportunities and improved independence and autonomy.
However, for many low income families coping with the cost of living continues to be a struggle.
- Low income households continue to spend a greater proportion of their income on housing. However, there has been a stabilised drop in the proportion spend on housing since 2018. Reduced budgets for the housing affordability programme meant that the peak recorded in 2023 could not be further increased. The 2025-2026 affordable homes budget of £768 million more than reinstates the Affordable Housing Supply Programme to 2023-24 levels, with £15.8 million more being available to invest when compared to 2023-2024 levels. In the year ending December 2024, an estimated 2,699 households with children have been helped into affordable housing. At the same time, there has been a 5% increase in the number of children in temporary accommodation in September 2024 compared to the previous year– this increase is not evidence across the board, with 20 councils seeing a reduction.
- Issues around affordability of childcare persist. 27% of parents continue to find it difficult or very difficult to afford their childcare costs.
- A quarter of low income households with children experience food insecurity. New Trussell statistics show that 240,000 emergency food parcels were distributed in Scotland last year, representing a 10% decrease from the previous year. The decrease is greater than across the whole of the UK (<8%). In the same period, parcels for children dropped by 11%. Further drops in inflation as well as the expansion of free school meals and the support during holidays should alleviate food insecurity further, though this is still to be seen. Latest data shows more free school lunches are being provided than ever before, with a record number of children registered too.
- Many families had difficulty affording energy bills. The percentage of households with children experiencing fuel poverty in 2023 stands at 34%.
- Many low income households still struggle around financial resilience. In fact, we see levels of debt increasing again, but use of high cost credit dropping to its lowest level and savings increasing. The indicators provide part of a picture. A recent in-depth review of debt in Scotland emphasises that it is too soon to fully understand the impact of the cost of living crisis on debt in Scotland. However, there is an increasing proportion of households struggling to pay bills and pay off debts. As an example, it shows energy debt, council tax debt, types of consumer credit and borrowing from friends and family increasing.
Income from social security and benefits in-kind
Means-tested social security benefits are designed to help with living costs and often supplement the income that households receive from other sources, primarily employment. However, due to different circumstances some households may not receive any income from paid work at a given point in time, and may rely entirely on benefit income to pay for living costs. As such, income from social security and benefits in-kind can play a significant role in supporting parents out of poverty.
Indeed, across various evaluations, we see the clear positive impact social security and benefits in-kind have on families. The Scottish Government publish annual estimates of benefit take-up rates. That is, the proportion of people eligible for benefits that go on to get them. These show that for the five family payments in particular (Scottish Child Payment, the three Best Start Grant payments and Best Start Foods), estimated take-up rates are high and indicate the majority of families (all living in low income households) eligible for these payments get them, directly ensuring that families have more income and contributing directly to reducing poverty. The latest take-up rate estimate for Scottish Child Payment for children aged under 6 was at 97% (nearly universal). Take up rates are also recorded for under 16s following the expansion of the benefit. In its first year (2023-24), take up stood at 89% which is similar to that achieved in 2021-22 amongst under 6s (at 87%) when it was first introduced.
We track the proportion of households with children who are eligible for Universal Credit. There has been a slight increase in eligibility in this reporting year’s figures. This may reflect changes in other indicators such as the slight reductions in hourly pay and median hours worked for low income households with children, as well as the small reduction in the percentage of parents in secure work contracts. These changes may mean that a greater proportion of families are eligible for Universal Credit. However, the increase may also reflect the ongoing transition from legacy benefits to Universal Credit, which can affect whether some families are eligible for means-tested benefits. It may also reflect demographic changes.
We also track the real value of both out-of-work and in-work benefits. An increase in the real terms value of both out-of-work and in-work benefits was observed in the latest year of data, reflecting the high inflation rates of recent years combined with the lag in benefit uprating, as well as Local Housing Allowances being rebased at the 30th percentile. However, apart from the temporary boost to Universal Credit during the Covid-19 pandemic, the broad trend is that the real-terms value of benefits have declined steadily over time, reflecting the presence of ongoing caps and freezes in the benefit system.
Progress towards 2030
While this section focuses on poverty data relating to the interim target year (2023-24), it is still necessary to look at progress towards the final targets in 2030. There are various ways we can do that. For this report, we look at trends in poverty rates for the four targets and also at the Scottish Government’s Cumulative Impact Assessment.
Trends in poverty rates
Overall, child poverty rates have shown little consistent change in recent years, and the trends for relative and absolute child poverty have been broadly stable over the past decade. We assess trends by looking at three-year averages. Trends for the combined low income and material deprivation measure have also been broadly stable prior to the measure being revised for 2023-24, and the estimate for persistent child poverty has fluctuated since data collection started in 2010.
Trends for all child poverty targets are shown in Figures 1 to 4 below. The dots and labels show single-year estimates. Shaded areas show indicative 95% confidence intervals around single-year estimates. The lines show three-year averages.

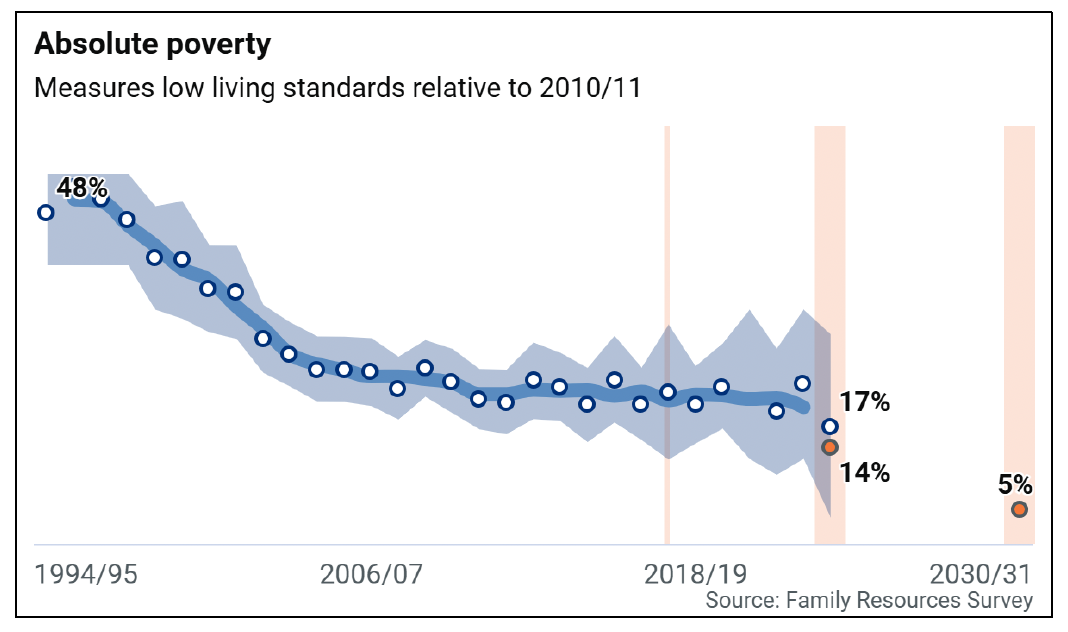
While we have seen drops in the single year figures for relative poverty and absolute poverty over the most recent period, we will need to see whether this reflects a longer term downward trend in future. We would not expect to see a substantive reduction in long term trends at this stage, due to the full impact of key policies such as the Scottish Child Payment only taking effect from 2023-24 onwards. Impact of these policies on child poverty rates should be more evident in future years.
Despite stable trends in child poverty levels, data and wider evidence show that the Scottish Government’s policy actions are having a positive impact for families.
- Impact modelling estimates that our policies are anticipated to keep around 70,000 children out of relative poverty and 60,000 children out of absolute poverty in 2025-26. The impact of Scottish Government policies grows over time to reach 10 percentage point (or 100,000 children) by 2028-29. Further detail in the next section.
- Rates of relative child poverty levels in Scotland are lower than the UK average – 23% compared to 30% in 2021-24 (31% England, 31% Wales and 24% NI), suggesting that additional policies implemented in Scotland are helping low income families.
- Evaluation of key policies do show that low income families are being supported. There have been continuous increases in the number of parents reached through employability support and positive impacts on health and wellbeing are also being recorded, though this is still done at limited scale. A constant increase in levels of take-up of social security benefits is also evident. Further, evidence also points towards positive impacts around systems change, with increases in collaboration and partnerships.
Assessing the cumulative impact of the policy package
We assess the cumulative impact of the policy package in two distinct ways. Firstly, through economic modelling which allows us to estimate the impact that the package of policies can have on child poverty rates. Secondly, through qualitative assessment of how various policies are working together to foster system change. A summary of our learning in both areas is below.
The latest modelling estimates that in 2025-26, a package of ten Scottish Government policies will cumulatively reduce the relative child poverty rate by 7 percentage points, and the absolute child poverty rate by 6 percentage points, compared to if those policies were not in place. This would represent keeping 70,000 and 60,000 children out of poverty respectively, with similar impacts on deep poverty (defined as living on <50% of median equivalised income). The impacts grow to reach 10 percentage points (100,000 children) by 2028-29 for relative poverty and 11 percentage points (110,000 children) from 2026-27 onward for absolute poverty. On average, households with children in the poorest 10% of households benefit from the policy package by an estimated £2,600 per year in 2025-26, representing over 20% of their income. This value is projected to grow to an average of £3,700, or nearly 30% of income, by 2029-30.
It should be noted that these estimates are subject to multiple sources of uncertainty and may be sensitive to changes in the economic environment. Nonetheless, the modelling will continue to be a useful tool, particularly in the development of the final delivery plan to be published by the end of March 2026.
Importantly, we also need to understand how well policies are working together to drive the child poverty agenda. Alongside this report we are publishing learning from our evaluation of place based, system change initiatives. This is the baseline report in assessing progress towards system change in the context of child poverty. The findings highlight that there are early signs of positive developments and implementation. Initiatives at the implementation stage reported positive signs of changing structures and cultures, which were seen to be creating the building blocks for longer-lasting system change.
Given that system change initiatives take time to implement and as a result time to see impact, it is not possible to assess the impact of these initiatives on child poverty outcomes so far. As policies become more embedded, it will be important to consider the impacts on families accessing services, as well as any barriers they may experience. That is especially relevant in terms of how these vary by group including by priority families. The learning is gathered through evaluations of place-based initiatives and due to the challenges in evaluating initiatives seeking to change the system, it is likely to be difficult to directly attribute reductions in child poverty to system change initiatives. Even so, evaluations will set out the pathways by which interventions should impact on poverty outcomes and indicate the likely contribution to child poverty reduction.
Contact
Email: TCPU@gov.scot