Tackling child poverty delivery plan: fourth year progress report 2021 to 2022
The fourth annual progress report for 'Every child, every chance: tackling child poverty delivery plan 2018-2022'.
3. Assessing progress against the targets
The COVID-19 pandemic impacted on many aspects of the Scottish economy, the labour market and in turn, people's lives. It has exacerbated inequalities which already existed.[21]
It is evident from the data considered in this report that the impact of the pandemic on the drivers of poverty around employability and cost of living was significant. In line with general labour market trends in Scotland, there have been increases in underemployment and drops in employment rates. This has been accompanied by an increase in the proportion of income spent on food and other essentials.
At the same time, however, the measure for persistent poverty shows a marked drop. While difficult to read for impact on longer term trends, the various emergency responses during the pandemic could have supported this decline. Further evidence shows that the increased financial help provided was crucial in supporting families in poverty, with the rapid response of local authorities and third sector organisations also playing a key role.
While the rest of this report looks at progress from April 2021 to March 2022, including in relation to the implementation and impact of action, this chapter covers up to March 2021, as per available data. It builds on the previous progress report[22] which looked at the period April 2019 to March 2020. This report is framed upon the evaluation strategy and measurement framework.[23]
Specifically, this chapter includes:
- overall progress towards the child poverty targets;
- updated child poverty data amongst priority groups;
- trends on child poverty drivers (income from employment, cost of living and income from social security and benefits in-kind).
Most of the data sources used to monitor and interpret progress towards meeting the targets were significantly impacted by COVID-19. Many national surveys which relied on face to face interviews could not continue as normal. This affected the robustness and reliability of many data sources for Scotland, including our ability to measure progress towards child poverty targets, and progress towards the drivers of poverty. Details on how COVID-19 impacted data collection can be found in Box 1. Progress towards targets and measures will be fully updated again in June 2023.
Box 1: Impact of COVID-19 on data collection
Which child poverty measures could be updated and why?
Only one out of the four statutory child poverty measures could be updated in 2022, that is persistent poverty. The other three targets (relative poverty, absolute poverty, and low income and material deprivation) rely on data from the Family Resources Survey. Due to the impact of the pandemic on data collection, primarily the halting of survey interviews, the survey did not provide a representative sample for Scotland.
As such, data on relative poverty, absolute poverty, and low income and material deprivation, as well as other poverty and income estimates for Scotland for the latest three-year period (2018-21), were not robust enough to be published as official statistics. This report includes data up to and including 2019-20 for these three targets. These statistics were already reported as part of the year 3 report.
Data for persistent poverty is collected via Understanding Society. This survey was affected less by the pandemic. We are thus able to publish an indicator of persistent poverty for the period 2016-2020, to go alongside the indicators of relative and absolute poverty, and low income and material deprivation we published for 2017-20 in last year's progress report.
Similarly, some indicators from the measurement framework rely on data sources which had also been impacted by the pandemic restrictions (e.g. the Scottish Household Survey). Details of indicators affected can be found in Annex A.
What was the impact of the pandemic on the Family Resources Survey?
The Family Resources Survey (FRS) is a UK-wide annual household survey. Interviews are conducted face to face in people's homes. The FRS is owned by the UK Department for Work and Pensions (DWP).
When the first UK-wide lockdown happened in spring 2020, interviews could no longer take place in person. Instead, households participating in the FRS were sent a letter and asked to contact their interviewer to arrange a phone interview. Participating in the survey is voluntary and, initially, only a small proportion of households did call to arrange an interview. With restrictions loosening later in the year, DWP implemented a range of improvements for contacting households, which improved response rates, although not to the level of a usual year (23% response rate in 2020-21 vs. 49% in 2019-20), and not enough for the Scottish sample. Sample size as well as sample composition were affected.
During the data quality assurance process, which involved analysts from all devolved administrations, issues were found in the Scottish and Welsh subsamples. DWP analysts concluded that the data quality of the regional samples did not satisfy Official Statistics standards, and resulting statistics could potentially be misleading. In Scotland, the data suggested that a higher proportion of higher income households responded. This means that low income households, and importantly those in poverty, were under-represented. For transparency, data for Scotland on relative poverty, absolute poverty and material deprivation were published though not as official statistics. The latest estimates are unreliable as they are not based on a representative sample of Scotland.
Child poverty rates
This progress update is the first one to report on data collected during the COVID-19 pandemic. Due to the significant impact of the pandemic on data collection, we could only update the persistent poverty measure which now covers the period until the end of 2020. For the other three indicators data shown is the same as per reported last year. We have still included it in this report for completeness.
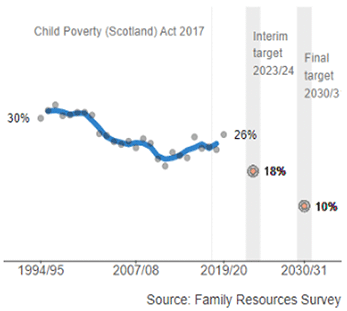
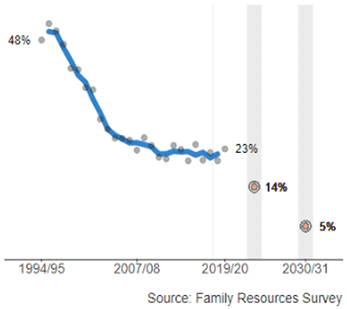
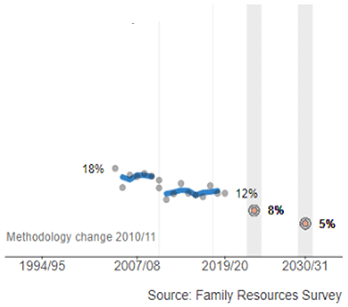
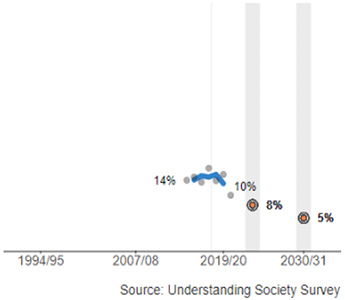
The charts in Figure 1 show change over time for the most recent official statistics. Single-year estimates (grey markers) help understand the situation at a certain point in time, while three-year averages (blue lines) show trends more accurately.[24]
Only Persistent Poverty could be updated in this report, which shows a marked drop to 10% (2019-20). This includes data from the first year of the pandemic, that is until December 2020.
Figure 1: Child Poverty targets
Child poverty priority groups
As we set out 'Every Child, Every Chance', there are some households which have a higher than average risk of being in poverty. We refer to these as 'priority groups'. These are households with a disabled person, three or more children, a baby aged under 1, minority ethnic households, mothers aged under 25, and lone parent families.
In this progress report, we can now look at persistent poverty for two priority family groups; that is households with a disabled person and families with children under 5.[25] Data for other priority groups is not available due to limited sample sizes. However, amongst the data available, it is clear that persistent poverty remained higher amongst priority groups (at 18%) when compared to levels for all children (at 10%).
| Persistent poverty | |
|---|---|
| All children | 10% |
| Disabled adult in benefit unit | 18% |
| Children under 5 in benefit unit (note: there is no data for baby under 1) | 18% |
(Source: Understanding Society)
The other three child poverty targets were not updated for 2020-21. However, we are providing last year's statistics for completeness (see Table 2). Further details on poverty rates among priority groups over time are published online.[26]
| Relative poverty | Absolute poverty | Low income and material deprivation | |
|---|---|---|---|
| All children | 24% | 22% | 13% |
| Lone parent household | 38% | 35% | 26% |
| Minority ethnic household | 38% | 34% | 17% |
| Baby aged under 1 in household | 34% | 30% | 13% |
| 3+ children in household | 32% | 29% | 19% |
| Disabled person in household | 29% | 26% | 20% |
(Source: Family Resources Survey)
In addition, we have deepened our understanding of the priority groups around the drivers of poverty and what works for them. In the past year we have published:
- A summary slide pack on latest evidence for the priority groups.[27] The aim of the pack was to inform policies and programmes to reduce child poverty in development of 'Best Start, Bright Futures'. This publication includes information for each priority group on: key demographics, drivers of poverty and key issues to consider;
- An evidence review on what works.[28] The report includes a chapter (see Chapter 2) which explores in further detail what the evidence says works or should work for each of the priority groups. However, it is important to remember that there is considerable overlap across the different priority groups, with families in poverty likely to fall into two or more of these categories.[29] Those families with entangled characteristics are those experiencing particularly complex and layered forms of disadvantage and adversity.
In order to better understand the issues priority groups face and how their characteristics overlap, we will shortly publish two focus reports. The first focuses on households where mothers are aged under 25 and the second on households where there is a baby under the age of 1. These reports will be published in summer 2022 and will then be available as part of the annex to this report.[30]
The drivers of child poverty
Our approach is to look at the drivers of poverty to explain trends in overall indicators. We have continued with this approach even where data on overall outcomes is uncertain, such as for 2020-21. As such, this report examines the three main drivers of poverty, i.e. income from employment, cost of living and income from social security and benefits in-kind.[31]
It should be noted, however, that due to the impact of COVID-19 restrictions on the data collection of many national surveys, as with the overall poverty measures, some indicators on the measurement framework could not be updated. Where the data is available and can be trusted to be reliable and robust, new data and trends have been added. Full information available in Annex A.
The year three report indicated that some child poverty drivers were moving in the right direction. Change was anticipated to take time. During 2020, families had to adjust to living during a pandemic with all the implications this could have had on their incomes and family life in general.
Since then, evidence showed that:
- The impacts of COVID-19, arising from the direct and indirect effects of contracting the illness, as well as the lockdown measures put in place to control spread of the virus, were significant and unequal. Before the pandemic hit, there were already inequalities across many domains such as income, wealth, living standards, labour market participation, health, education and life chances. COVID-19 has exacerbated many of these pre-existing inequalities and exposed the vulnerability of some population groups to adverse shocks. The crisis has also drawn out more harshly the effect of deprivation as a spatial focus for multiple inequalities and poor outcomes. The groups most adversely impacted included those already on low incomes, children and young people, disabled people, people of minority ethnicities and women;[32]
- The quick emergency response provided by Scottish Government was welcomed by low income households. There are indications that it indeed supported people in poverty to cope with the financial pressures during the first year of the pandemic.[33],[34] Longer term impacts of the pandemic on child poverty and the impact of policies to support families through the pandemic are still to be seen.
Looking now at each driver of poverty in detail.
Income from employment
Being in work can have a positive impact on poverty outcomes as earnings from paid work are the single largest source of income for most households in Scotland. However, evidence shows that it is not only a matter of having a job, but instead a well-paid, stable and secure contract that allow families to not live in poverty.
COVID-19 has impacted the Scottish labour market as a whole. Over the first year of the pandemic there were general (amongst the 16 to 64 population) drops in employment rate, an increase in underemployment and an increase in those economically inactive.[35] People on low income were more likely to be working in shutdown sectors and on insecure contracts and, as such, were more likely to be harder hit by changes to their employability status.
Indicators showed a positive trend in terms of a continued slight increase in hourly pay and hours worked amongst low income families. However, this is in line with continuous increases in most years from 2012-2015.[36] At the same time, however, there was a slight increase in the proportion of children in households where no one is working. Similar to general trends, underemployment increased for low income households, which can be partly explained by the furlough scheme and restrictions on businesses during 2020.
To understand the longer term prospects for low income families, the measurement framework includes data on the attainment gap. That is the gap in educational outcomes amongst children living in the most and least deprived areas of Scotland. Despite considerable impact of COVID-19 across the 2020-21 academic year, the evidence indicates positive progress towards closing the poverty related attainment gap.[37] This is expected to reduce the differences in longer term outcomes, such as progression to Higher Education or work.
For school aged children, international evidence shows that school building closures are likely to have had a negative effect on pupil progress and attainment, and socio-economically deprived children and young people are amongst those who may have been most negatively affected.[38] Scottish stakeholders reported similar experiences to that suggested by international evidence. They identified that both the mental and physical health and wellbeing of children and young people may have been negatively impacted during school building closures. In fact, data from Achievement of Curriculum for Excellence Levels in primary schools showed an increasing level of pupils meeting expected levels in both literacy and numeracy until 2020-21. It is important to remember that 2020-21 was a period of school building closures and other disruptions for pupils. Over the period 2020-21, attainment decreased and the gap between pupils from most and least deprived areas widened.[39]
For younger, pre-school aged children, recent data from Public Health Scotland, based on Child Health Reviews from the Child Health Surveillance Programme, indicates that there has been a rise in developmental concerns noted at Child Health Reviews at the 13-15 month and 27-30 month points. Similar trends have been found for children's performance in early primary school.[40]
Cost of living
The cost of living is the term used when referring to the prices of day-to-day goods and services. Price increases have a particular impact on low income households as they spend a higher proportion of income on essential goods and services.
During the first year of the pandemic, many families saw their income from employment being reduced. The reduced income impacted on many aspects of families' lives. When looking at affordability of housing specifically, experiences since the pandemic started were mixed. Individual circumstances differed by job sector, housing tenure, and a number of other factors including which social security benefits and financial relief schemes people within households had access to. Given this complexity and the lack of robust data on trends during this period, it is difficult to compare housing affordability in this period to pre-2020 levels. We await further data on housing affordability to better understand how this has been impacted.
The indicators show a very slight upward trend on the percentage of income spent on food, particularly for low income households. Evidence indicated that the strengthened income support provided during that first year of the pandemic, including furlough, the £20 uplift to Universal Credit and Working Tax Credits, pandemic support payments and the continued provision of free school meals during closed down periods, eased household worry about food and other essentials.[41]
For many families the cost of childcare can be a significant expense. The Early Learning and Childcare (ELC) expansion in particular helped families who already use ELC with childcare affordability. There appeared to be more childcare places opened during school holidays and out-of-school hours. While the long term effects of the pandemic on families and the economy are still not known, the growing evidence from a range of research studies suggests many young children and their families have been negatively affected in terms of their wellbeing and development, especially those who were already disadvantaged.[42]
Looking forwards, the cost of living crisis[43] faced during 2022 is anticipated to have a more detrimental impact on those already on low incomes, including those experiencing poverty. Some priority families will be adversely and disproportionately affected, such as larger families and families with a disabled family member. The full impact of the current cost of living crisis will not yet be reflected in the data used in this report. However, this is something that will be monitored going forwards.
Income from social security and benefits in-kind
Social security is designed to supplement the income that households receive from other sources, primarily employment. As such, income from social security and benefits in-kind can play a significant role in supporting parents out of poverty.
The provision of social security and benefits in-kind for families in Scotland is delivered by DWP, Social Security Scotland, and Scottish local authorities. Currently, around 85% of benefits are reserved to the UK Government, with the rest being devolved to the Scottish Government.[44]
From the indicators collected, the value of out-of-work benefits to a family of two adults and two children has gone down in 2021 after an increase in 2020. The overall trend reflects a period of holding rises to benefits of 1 per cent for three years from 2013, and then freezing of benefits in cash terms for four years from 2016. This indicator does not include the extra support, in addition to benefits, that was extended during the pandemic, which we have covered in more detail below.
The value of in-work benefits is on a more prominent downward trend. As well as the approach to uprating benefits noted above, this period has also seen increases in the National Living Wage, which means more wage income for a full-time worker has replaced money received in benefits. A temporary boost for Working Tax Credit for workers in 2020-21 has also been withdrawn by the UK Government, so the increase in this indicator seen in 2020 was not sustained.
A recent research study[45] evaluated the impact of the wide range of additional financial and in-kind support funded by the Scottish Government and delivered through local authorities, Social Security Scotland, and the third sector. This range of support was designed to assist people to manage the challenges experienced over the course of the pandemic. It included amongst others: COVID hardship payments; Scottish Child Payment Bridging Payments; Low Income Pandemic Payments, and; self-isolation support services. The temporary £20 weekly increase in Universal Credit was generally seen as the most valuable extra financial support. This was especially the case for people who were not eligible for Scottish Child Payment Bridging Payments and those at risk of severe financial hardship. Many people were concerned about losing the Universal Credit £20 increase, and how they would make ends meet without it. The payments, and extra pandemic support, reduced the financial difficulties that came from using more food and energy through working from home, higher food and energy prices, and the extra costs of schooling and entertaining children at home.
However, it is anticipated that the loss of income through the cut to Universal Credit and loss of furlough are likely to further increase financial hardship for families. For example, analysis has shown that reversing key UK Government welfare reforms that have occurred since 2015 would bring an estimated 70,000 people out of poverty in Scotland, including 30,000 children in 2023-24. In isolation, reversing the benefit freeze or reversing the two-child limit and the removal of the family element, would lift 10,000 out of poverty for each of those policies.[46]
Details of trend data for the drivers of child poverty are presented in Annex A.
Evaluating our policies
Updates on individual policy evaluations are provided in section 2 of this progress report. As set out in the evaluation strategy, our evaluation efforts have been focused on those actions likely to have the biggest impact on the child poverty targets.
'Every Child, Every Chance' also made a commitment to investigate methods to produce a quantitative, cumulative impact assessment of the policies on child poverty. This modelling underpinned the development of 'Best Start, Bright Futures'. It assessed the cumulative impact of a package of Scottish Government policies on child poverty, including policies already in place, in addition to those introduced in the second plan.
The modelling indicated that based on the data available at the time, around 17% of children would be living in relative poverty in 2023-24. This would represent a reduction of around 9 percentage points compared to 2019-20, the latest year of official statistics. The absolute child poverty rate was modelled to fall by 7 percentage points between 2019-20 and 2023-24, to around 16%.
The assessment indicated that the policy package plays a significant role in driving a lower poverty rate. We estimated that the relative child poverty rate would have been 2 percentage points higher in 2019-20 if the policy package of the time had not been in place, with 20,000 more children living in poverty.[47] By 2023-24, with the introduction of additional policies, this impact was projected to increase to 10 percentage points.[48] However, it is not possible to fully disentangle its effects from that of external factors in the wider economy; for example, benefit caseloads will be impacted by changes in the labour market, while benefit rates will be impacted by inflation. These external factors also represent significant sources of uncertainty, particularly in the current economic climate.
The current cost of living crisis poses a challenge to progress to reach both the interim and final targets, at least until increases in wages and benefit rates offset the current high inflation rates. This issue is particularly relevant for the absolute poverty and material deprivation targets. The absolute poverty line is uprated each year for inflation, so increases in the cost of living will have a direct impact on absolute child poverty rates. It is also likely that families will report higher levels of material deprivation while inflation rates remain high – particularly for essential items like energy and food which are currently driving high inflation. On the other hand, relative poverty (and therefore persistent poverty) is not directly adjusted for the cost of living. This underscores the importance of having four targets of child poverty and using a basket of indicators to track progress.
Local action
Local Child Poverty Action Reports are jointly developed by local authorities and Territorial Health Boards to outline activities and commitments to reducing child poverty in local areas. The 2020-21 reports describe activity between April 2020 and March 2021, and include planned future activity for the year ahead. The Improvement Service analysed each report around commitment, partnership working and a range of key policy levers.
The Improvement Service considered the 2020-21 reports and found that, in general, the reports indicated a sustained, high-level commitment to addressing child poverty at local level. The reports demonstrate an increased awareness of the importance of involving those with lived experience in policy development.
Despite the pressing challenges posed by COVID-19, the reports suggest an increasingly strategic approach to tackling child poverty at local level and a willingness to engage a range of policy levers including housing, procurement and the role of local authorities and health boards as anchor institutions. This has developed through practice sharing, collaboration and engagement. Data and evidence is not consistent throughout the reports, however. Although some areas have been successful in innovative approaches to understanding their population and the impact their actions are having.
While there is still a long way to go to ensure support reaches those at highest risk of poverty, targeted initiatives are in place in many areas to help overcome the barriers that those in the priority groups can face. For example, Fife has focused the community engagement around 'No One Left Behind' by involving those with lived experience in service planning and initiatives targeted at the priority groups.
There is a sharpened focus on the need to support families in a joined up, holistic and intuitive way and an awareness that local reports have an important role to play in delivering that.
Contact
Email: tcpu@gov.scot