Summary Statistics For Schools In Scotland 2021
Headline statistics from the annual pupil and teacher census and early learning and childcare provision conducted in September 2021 and attendance, absence and exclusions for the 2020 to 2021 school year.
Chapter 3: School teachers
53,581 teachers in schools compared to 52,672 in 2020 (excludes ELC)
13.2 pupil teacher ratio for publicly funded schools
80% of teachers on the 2020/21 Teacher Induction Scheme were in employment the following school year
| Local Authority | Primary | Secondary | Special | Centrally employed | Total |
|---|---|---|---|---|---|
| Aberdeen City | 884 | 778 | 30 | 53 | 1,745 |
| Aberdeenshire | 1,377 | 1,269 | 49 | 36 | 2,731 |
| Angus | 582 | 567 | 0 | 23 | 1,172 |
| Argyll and Bute | 432 | 410 | 6 | 13 | 860 |
| City of Edinburgh | 1,684 | 1,665 | 172 | 93 | 3,615 |
| Clackmannanshire | 299 | 227 | 29 | 2 | 556 |
| Dumfries and Galloway | 654 | 670 | 23 | 75 | 1,421 |
| Dundee City | 659 | 631 | 57 | 29 | 1,375 |
| East Ayrshire | 607 | 554 | 81 | 20 | 1,263 |
| East Dunbartonshire | 585 | 699 | 53 | 38 | 1,374 |
| East Lothian | 506 | 499 | 0 | 25 | 1,031 |
| East Renfrewshire | 612 | 690 | 35 | 3 | 1,341 |
| Falkirk | 760 | 819 | 77 | 6 | 1,663 |
| Fife | 1,798 | 1,651 | 102 | 85 | 3,636 |
| Glasgow City | 2,782 | 2,398 | 337 | 105 | 5,621 |
| Highland | 1,079 | 1,187 | 44 | 42 | 2,352 |
| Inverclyde | 370 | 375 | 44 | 6 | 795 |
| Midlothian | 504 | 471 | 25 | 24 | 1,024 |
| Moray | 475 | 455 | 0 | 22 | 952 |
| Na h-Eileanan Siar | 161 | 149 | 0 | 8 | 317 |
| North Ayrshire | 701 | 665 | 41 | 54 | 1,462 |
| North Lanarkshire | 1,824 | 1,651 | 239 | 64 | 3,778 |
| Orkney Islands | 122 | 128 | 0 | 7 | 257 |
| Perth and Kinross | 683 | 649 | 15 | 39 | 1,386 |
| Renfrewshire | 841 | 840 | 87 | 26 | 1,793 |
| Scottish Borders | 500 | 509 | 39 | 6 | 1,054 |
| Shetland Islands | 160 | 158 | 0 | 11 | 329 |
| South Ayrshire | 529 | 531 | 29 | 40 | 1,128 |
| South Lanarkshire | 1,696 | 1,634 | 149 | 0 | 3,480 |
| Stirling | 437 | 489 | 20 | 17 | 963 |
| West Dunbartonshire | 463 | 431 | 50 | 16 | 959 |
| West Lothian | 1,021 | 881 | 126 | 0 | 2,029 |
| All local authorities | 25,783 | 24,731 | 1,959 | 988 | 53,461 |
| Grant aided | 23 | 51 | 46 | # | 120 |
| Scotland | 25,807 | 24,782 | 2,005 | 988 | 53,581 |
Table 3.2 shows that the total number of teachers (primary, secondary, special and centrally employed) increased by 909 between 2020 and 2021. Total teacher numbers rose in each year from 2014 to 2021. (Statistics pre-2015 are available from the supplementary statistics and historical time series).
One of the drivers for the increase in teacher numbers could be the additional funding that has been made available to local authorities for the recruitment of more teachers. Further information on funding for additional teachers including COVID-19 education recovery funding and the Attainment Scotland Fund, can be found in the background notes.
Although the number of teachers has increased since 2020, this was not the case for each local authority. In 28 local authorities the number of teachers increased or stayed the same, with the largest increase of 9% seen in Moray; followed by Inverclyde, with an increase of 6%. The other four local authorities saw small decreases in teachers this year, of up to 2%.
| Local Authority | 2015 | 2016 | 2017 | 2018 | 2019 | 2020 | 2021 |
|---|---|---|---|---|---|---|---|
| Aberdeen City | 1,632 | 1,603 | 1,624 | 1,636 | 1,675 | 1,725 | 1,745 |
| Aberdeenshire | 2,650 | 2,655 | 2,675 | 2,650 | 2,696 | 2,720 | 2,731 |
| Angus | 1,136 | 1,125 | 1,133 | 1,160 | 1,172 | 1,197 | 1,172 |
| Argyll and Bute | 844 | 841 | 825 | 861 | 834 | 846 | 860 |
| City of Edinburgh | 3,193 | 3,213 | 3,281 | 3,346 | 3,452 | 3,518 | 3,615 |
| Clackmannanshire | 490 | 528 | 513 | 512 | 520 | 554 | 556 |
| Dumfries and Galloway | 1,479 | 1,466 | 1,470 | 1,436 | 1,436 | 1,413 | 1,421 |
| Dundee City | 1,375 | 1,367 | 1,330 | 1,321 | 1,316 | 1,340 | 1,375 |
| East Ayrshire | 1,151 | 1,149 | 1,189 | 1,185 | 1,205 | 1,233 | 1,263 |
| East Dunbartonshire | 1,204 | 1,217 | 1,245 | 1,248 | 1,269 | 1,366 | 1,374 |
| East Lothian | 920 | 913 | 935 | 960 | 973 | 1,008 | 1,031 |
| East Renfrewshire | 1,213 | 1,227 | 1,265 | 1,277 | 1,306 | 1,322 | 1,341 |
| Falkirk | 1,581 | 1,605 | 1,620 | 1,634 | 1,629 | 1,688 | 1,663 |
| Fife | 3,476 | 3,494 | 3,498 | 3,503 | 3,530 | 3,627 | 3,636 |
| Glasgow City | 4,779 | 4,869 | 5,020 | 5,263 | 5,352 | 5,446 | 5,621 |
| Highland | 2,357 | 2,355 | 2,365 | 2,388 | 2,300 | 2,284 | 2,352 |
| Inverclyde | 734 | 735 | 738 | 745 | 730 | 751 | 795 |
| Midlothian | 866 | 873 | 892 | 930 | 941 | 985 | 1,024 |
| Moray | 874 | 848 | 856 | 868 | 866 | 873 | 952 |
| Na h-Eileanan Siar | 324 | 321 | 327 | 327 | 313 | 312 | 317 |
| North Ayrshire | 1,332 | 1,371 | 1,396 | 1,393 | 1,376 | 1,412 | 1,462 |
| North Lanarkshire | 3,406 | 3,474 | 3,502 | 3,545 | 3,590 | 3,742 | 3,778 |
| Orkney Islands | 255 | 260 | 253 | 250 | 251 | 247 | 257 |
| Perth and Kinross | 1,337 | 1,329 | 1,329 | 1,346 | 1,329 | 1,346 | 1,386 |
| Renfrewshire | 1,596 | 1,633 | 1,656 | 1,676 | 1,674 | 1,778 | 1,793 |
| Scottish Borders | 1,049 | 1,052 | 1,055 | 1,070 | 1,038 | 1,065 | 1,054 |
| Shetland Islands | 323 | 318 | 323 | 322 | 320 | 329 | 329 |
| South Ayrshire | 1,063 | 1,043 | 1,056 | 1,048 | 1,065 | 1,101 | 1,128 |
| South Lanarkshire | 3,176 | 3,202 | 3,282 | 3,298 | 3,341 | 3,438 | 3,480 |
| Stirling | 921 | 942 | 925 | 934 | 938 | 954 | 963 |
| West Dunbartonshire | 921 | 928 | 961 | 956 | 980 | 964 | 959 |
| West Lothian | 1,880 | 1,899 | 1,924 | 1,924 | 1,909 | 1,971 | 2,029 |
| All local authorities | 49,538 | 49,858 | 50,464 | 51,012 | 51,327 | 52,555 | 53,461 |
| Grant aided | 141 | 127 | 127 | 126 | 122 | 117 | 120 |
| Scotland | 49,679 | 49,985 | 50,592 | 51,138 | 51,449 | 52,672 | 53,581 |
(1) Includes centrally employed teachers.
Table 3.3 shows pupil teacher ratios (PTRs) which give a measure of the size of the teaching workforce relative to the pupil population. The national PTR decreased from 13.3 in 2020 to from 13.2 in 2021, the lowest national PTR since 2008. (Statistics pre-2014 are available from the supplementary statistics and historical time series).
Across Scotland, 26 local authorities have decreased or maintained their PTR from 2020. The biggest decrease was seen in Moray, which decreased by 1.1. Since 2015, North Ayrshire and North Lanarkshire have had the largest decrease in PTR at 1.4. The largest increase in PTR since 2015 was in Dumfries and Galloway at 0.5.
| Local Authority | 2015 | 2016 | 2017 | 2018 | 2019 | 2020 | 2021 |
|---|---|---|---|---|---|---|---|
| Aberdeen City | 13.6 | 14.0 | 14.0 | 14.1 | 13.8 | 13.7 | 13.9 |
| Aberdeenshire | 13.3 | 13.4 | 13.3 | 13.5 | 13.3 | 13.4 | 13.4 |
| Angus | 13.2 | 13.3 | 13.3 | 13.1 | 13.0 | 12.8 | 12.9 |
| Argyll and Bute | 12.4 | 12.3 | 12.5 | 12.0 | 12.2 | 12.0 | 11.7 |
| City of Edinburgh | 14.9 | 15.1 | 15.1 | 15.1 | 14.9 | 14.8 | 14.5 |
| Clackmannanshire | 13.4 | 12.5 | 12.9 | 13.0 | 12.8 | 12.0 | 12.1 |
| Dumfries and Galloway | 12.7 | 12.7 | 12.8 | 13.1 | 13.1 | 13.2 | 13.2 |
| Dundee City | 13.0 | 13.2 | 13.7 | 13.8 | 13.9 | 13.7 | 13.4 |
| East Ayrshire | 13.9 | 13.9 | 13.3 | 13.5 | 13.4 | 13.2 | 12.9 |
| East Dunbartonshire | 13.6 | 13.5 | 13.4 | 13.6 | 13.5 | 12.7 | 12.7 |
| East Lothian | 15.1 | 15.4 | 15.2 | 15.1 | 15.1 | 14.8 | 14.6 |
| East Renfrewshire | 13.7 | 13.7 | 13.5 | 13.5 | 13.2 | 13.2 | 13.1 |
| Falkirk | 13.5 | 13.5 | 13.5 | 13.4 | 13.5 | 13.0 | 13.1 |
| Fife | 14.0 | 14.1 | 14.1 | 14.2 | 14.2 | 13.9 | 13.8 |
| Glasgow City | 13.8 | 13.8 | 13.5 | 13.1 | 13.0 | 12.9 | 12.6 |
| Highland | 13.1 | 13.1 | 13.0 | 12.9 | 13.5 | 13.5 | 13.1 |
| Inverclyde | 13.5 | 13.5 | 13.4 | 13.2 | 13.6 | 13.1 | 12.3 |
| Midlothian | 14.2 | 14.2 | 14.2 | 13.8 | 14.0 | 13.7 | 13.5 |
| Moray | 13.7 | 14.1 | 13.9 | 13.7 | 13.8 | 13.9 | 12.8 |
| Na h-Eileanan Siar | 10.3 | 10.5 | 10.3 | 10.2 | 10.6 | 10.7 | 10.4 |
| North Ayrshire | 13.6 | 13.3 | 13.1 | 13.1 | 13.1 | 12.8 | 12.2 |
| North Lanarkshire | 14.4 | 14.1 | 14.0 | 13.8 | 13.7 | 13.2 | 13.0 |
| Orkney Islands | 10.5 | 10.4 | 10.8 | 11.1 | 11.1 | 11.3 | 10.9 |
| Perth and Kinross | 13.3 | 13.6 | 13.5 | 13.3 | 13.6 | 13.5 | 13.1 |
| Renfrewshire | 14.6 | 14.3 | 14.2 | 14.1 | 14.2 | 13.4 | 13.3 |
| Scottish Borders | 13.8 | 13.8 | 13.8 | 13.6 | 14.0 | 13.6 | 13.7 |
| Shetland Islands | 10.0 | 10.2 | 10.0 | 10.1 | 10.2 | 10.0 | 10.1 |
| South Ayrshire | 13.2 | 13.4 | 13.3 | 13.3 | 13.2 | 13.0 | 12.7 |
| South Lanarkshire | 13.7 | 13.7 | 13.4 | 13.4 | 13.4 | 13.1 | 13.0 |
| Stirling | 13.4 | 13.2 | 13.5 | 13.5 | 13.5 | 13.4 | 13.3 |
| West Dunbartonshire | 13.5 | 13.4 | 13.1 | 13.1 | 12.8 | 13.0 | 13.0 |
| West Lothian | 14.1 | 14.1 | 14.0 | 14.1 | 14.3 | 13.9 | 13.6 |
| All local authorities | 13.7 | 13.7 | 13.6 | 13.6 | 13.6 | 13.3 | 13.2 |
| Grant aided(2) | 8.6 | 9.2 | 9.3 | 9.4 | 9.6 | 10.0 | 9.7 |
| Scotland | 13.7 | 13.7 | 13.6 | 13.6 | 13.6 | 13.3 | 13.2 |
(1) Includes centrally employed teachers.
(2) The pupil teacher ratio for grant aided schools in 2011-2016 was amended in October 2017. See background notes for details.
Chart 1 shows that the age profile of teachers has changed much over the past 10 years. The prominent peak of teachers aged in their fifties, as seen in 2011, no longer exists. In 2021, teacher numbers were highest between the ages of 25 and 41.
The average (mean) age of primary, secondary and special school teachers was 40 in 2021, compared to 43 in 2011, so the teacher workforce was, on average, younger in 2021 than in 2011.
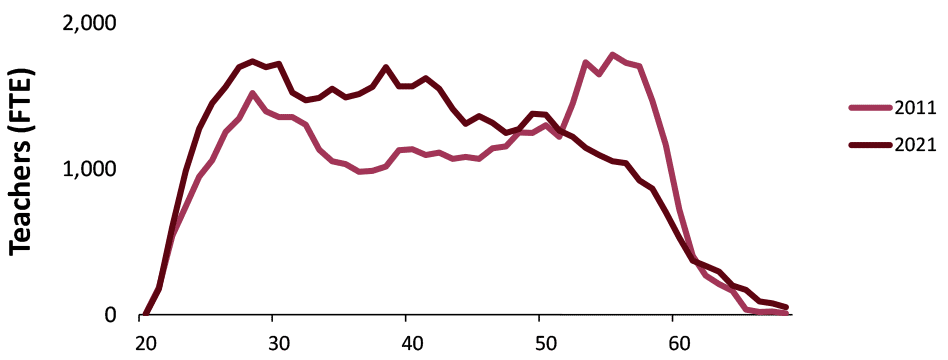
Table 3.4 shows that there are many more female teachers than male, especially in the primary sector where 89% of teachers are female. However, in both primary and secondary sectors there was a lower proportion of female teachers in promoted posts compared to main grade or chartered teachers. In secondary schools 65% of teachers at all grades were female compared to 44% of head teachers.
A new role of Lead Teacher was established in June 2021 by the Scottish Negotiating Committee for Teachers. There were no Lead Teachers in post at the time of this year’s school staff census in September.
Teaching posts were classified into three employment types for the purposes of the school staff census: Permanent, Temporary and Teacher Induction Scheme. Teachers may be employed on a permanent contract but be recorded in the staff census as temporary if they are working in a post classified as a temporary employment type, for example while covering a vacancy. The proportion of teachers in temporary posts was 13% (compared with 12% last year). This increase in temporary posts was seen across the primary, secondary and special school sectors. Further details on the recording of employment types is included in the background notes.
In 2021, the percentage of teachers working part-time, as a proportion of all FTE, was 17%. There was a higher rate amongst females (20%), than males (8%) (data not shown).
Table 3.4: Teacher characteristics, Percentage of Full Time Equivalents (FTE)
| Characteristic | School Type | Total | |||
|---|---|---|---|---|---|
| Primary | Secondary | Special | Centrally Employed | ||
| Female | 89 | 65 | 77 | 83 | 77 |
| Male | 11 | 35 | 23 | 17 | 23 |
| Characteristic | School Type | Total | |||
|---|---|---|---|---|---|
| Primary | Secondary | Special | Centrally Employed | ||
| Under 25 | 6 | 5 | 2 | 1 | 6 |
| 25 to 34 | 32 | 29 | 17 | 9 | 30 |
| 35 to 44 | 28 | 28 | 32 | 25 | 28 |
| 45 to 54 | 23 | 23 | 31 | 34 | 24 |
| 55 or over | 10 | 14 | 18 | 31 | 13 |
| Average Age | 39 | 41 | 44 | 48 | 40 |
| Characteristic | School Type | Total | |||
|---|---|---|---|---|---|
| Primary | Secondary | Special | Centrally Employed | ||
| White - Scottish | 70 | 63 | 66 | 54 | 66 |
| White - other British | 21 | 24 | 22 | 26 | 23 |
| White - other | 2 | 4 | 5 | 5 | 3 |
| Minority ethnic group | 1 | 2 | 2 | 5 | 2 |
| Not known | 4 | 4 | 3 | 8 | 4 |
| Not disclosed | 2 | 3 | 2 | 3 | 2 |
| Characteristic | School Type | Total | |||
|---|---|---|---|---|---|
| Primary | Secondary | Special | Centrally Employed | ||
| Permanent | 78 | 83 | 84 | 85 | 81 |
| Temporary | 16 | 11 | 16 | 15 | 13 |
| Teacher Induction Scheme | 7 | 6 | 0 | 0 | 6 |
| Characteristic | School Type | Total | |||
|---|---|---|---|---|---|
| Primary | Secondary | Special | Centrally Employed | ||
| Head teacher | 6 | 1 | 5 | 4 | 4 |
| Percentage female | 84 | 44 | 79 | 77 | 78 |
| Depute head teacher | 5 | 5 | 7 | 3 | 5 |
| Percentage female | 88 | 57 | 77 | 86 | 74 |
| Principal teacher | 7 | 22 | 10 | 11 | 14 |
| Percentage female | 86 | 63 | 73 | 76 | 69 |
| Teacher or chartered | 81 | 73 | 78 | 83 | 77 |
| Percentage female | 90 | 66 | 77 | 84 | 79 |
| All - percentage female | 89 | 65 | 77 | 83 | 77 |
| Characteristic | School Type | Total | |||
|---|---|---|---|---|---|
| Primary | Secondary | Special | Centrally Employed | ||
| Full-time | 79 | 87 | 81 | 70 | 83 |
| Percentage female | 88 | 62 | 75 | 80 | 75 |
| Part-time | 21 | 13 | 19 | 30 | 17 |
| Percentage female | 95 | 83 | 86 | 91 | 90 |
(1) More information on the ethnicity categories can be found in the Ethnicity section in the background notes.
(2) The mode of working is the percentage of FTE by working pattern in a school sector at a particular grade. See background notes for more details.
Teachers provisionally registered with the General Teaching Council for Scotland (GTCS) (for example those that have recently completed their initial teacher education) are required to complete a period of probation before becoming eligible for full registration. Probation can be completed through either the one year full-time Teacher Induction Scheme (TIS) or a flexible route.
Table 3.5 shows the percentage of previous TIS probationers who were in teaching posts in a publicly funded school in Scotland in the year following their probation. The percentage of teachers in such employment in the first year following probation has decreased to 80% for the most recent cohort (2020/21) from 85% for the cohort last year. This is the lowest rate since the 2013/14 cohort but remains substantially higher than the three cohorts from 2007/08 to 2009/10 when less than 60% of teachers found such employment in the first year following their probation. Teachers not in a post in a publicly funded school may be teaching elsewhere (including abroad or in the independent sector), in non-teaching employment or unemployed.
For the 2020/21 cohort, the proportion of TIS probationers in a full-time permanent post at the time of the following year’s census was 31%, down from 38% for the previous cohort. This proportion has decreased for the last five years from a high of 57% for the 2016/17 cohort. The proportion of the TIS probationer cohort that were in a full-time temporary post at the time of the following year’s census was higher, having risen from 27% in 2015/16 to 42% in 2019/20 and 2020/21.
Statistics on pre 2014/15 cohorts are available from the supplementary statistics.
Further breakdowns of post-probationer data, by sector, local authority and secondary subject can be found on the post probationer teacher employment dashboard.
| TIS probationer cohort | |||||||
|---|---|---|---|---|---|---|---|
| 2014/15 | 2015/16 | 2016/17 | 2017/18 | 2018/19 | 2019/20 | 2020/21 | |
| Full-time permanent | 45 | 55 | 57 | 55 | 48 | 38 | 31 |
| Full-time temporary | 35 | 27 | 28 | 27 | 30 | 42 | 42 |
| Part-time permanent | 2 | 2 | 1 | 2 | 2 | 1 | 1 |
| Part-time temporary | 4 | 2 | 2 | 3 | 5 | 3 | 6 |
| Other(1) | 14 | 13 | 12 | 13 | 16 | 15 | 20 |
| All teaching post types’ | 86 | 87 | 88 | 87 | 84 | 85 | 80 |
| Headcount of teachers in cohort | 2,448 | 2,524 | 2,630 | 2,852 | 2,836 | 3,076 | 3,123 |
(1) The “Other” category includes those teaching elsewhere, including in the independent sector, those who have found supply work, and those who are unemployed or who have left teaching, although this detail is not included in the census data.
Table 3.6 shows the percentage of TIS probationers in teaching posts up to seven years following their probation.
| Sep-15 | Sep-16 | Sep-17 | Sep-18 | Sep-19 | Sep-20 | Sep-21 | |
|---|---|---|---|---|---|---|---|
| 2014/15 cohort | 86 | 83 | 82 | 80 | 79 | 79 | 78 |
| 2015/16 cohort | 87 | 84 | 83 | 81 | 80 | 79 | |
| 2016/17 cohort | 88 | 85 | 83 | 83 | 82 | ||
| 2017/18 cohort | 87 | 84 | 84 | 84 | |||
| 2018/19 cohort | 84 | 85 | 85 | ||||
| 2019/20 cohort | 85 | 84 | |||||
| 2020/21 cohort | 80 |
Contact
Email: school.stats@gov.scot