Summary Statistics for Follow-up Leaver Destinations, No. 3: 2021 Edition
This statistical publication provides information on the follow-up destinations of 2019/20 school leavers from publicly funded schools in Scotland
Part of
Chapter 2: School leaver follow-up destinations
- 92.2 per cent of 2019/20 school leavers were in a positive follow-up destination (92.9 per cent for 2018/19).
- 42.9 per cent of school leavers were in Higher Education (the most common follow-up destination).
2.1 Destinations
Table 1 shows that 92.2 per cent of all 2019/20 school leavers were in a positive follow-up destination. This was slightly lower than for 2018/19 (92.9 per cent).
Table 1 also shows that, 42.9 per cent of the 2019/20 leavers were in Higher Education – the most common follow-up destination. This was higher than for 2018/19 (38.4 per cent) and is the highest share since consistent records began in 2009/10. The percentage of school leavers in Further Education has also increased from 23.3 per cent in 2018/19 to 23.6 per cent in 2019/20.
The percentage of school leavers in Employment has decreased from 28.0 per cent for 2018/19 leavers to 21.3 per cent in 2019/20, the lowest figure since 2009/10.
The percentage of school leavers who were Unemployed (Unemployed Seeking or Unemployed Not Seeking) has increased from 5.8 per cent for 2018/19 to 6.8 per cent for 2019/20 leavers.
| Destination | 2014/15 | 2015/16 | 2016/17 | 2017/18 | 2018/19 | 2019/20 |
|---|---|---|---|---|---|---|
| Higher Education | 36.8 | 37.3 | 38.3 | 39.0 | 38.4 | 42.9 |
| Further Education | 23.4 | 22.4 | 23.0 | 22.6 | 23.3 | 23.6 |
| Training | 2.5 | 1.5 | 1.5 | 1.6 | 2.3 | 3.2 |
| Employment | 27.8 | 28.7 | 28.3 | 28.3 | 28.0 | 21.3 |
| Voluntary Work | 0.4 | 0.4 | 0.5 | 0.6 | 0.5 | 0.3 |
| Activity Agreement | 0.7 | 0.9 | 1.0 | 0.9 | z | z |
| Personal Skills Development | 0.4 | 0.4 | 0.5 | 0.3 | 0.4 | 0.8 |
| Positive Destinations | 92.2 | 91.6 | 93.1 | 93.3 | 92.9 | 92.2 |
| Unemployed Seeking | 5.6 | 5.7 | 4.3 | 3.8 | 3.5 | 4.1 |
| Unemployed Not Seeking | 1.6 | 1.8 | 1.8 | 1.8 | 2.3 | 2.7 |
| Unknown | 0.6 | 0.9 | 0.7 | 1.1 | 1.3 | 1.0 |
| Other Destinations | 7.8 | 8.4 | 6.9 | 6.7 | 7.1 | 7.8 |
| Number of Leavers | 52,337 | 52,113 | 51,172 | 49,650 | 49,655 | 47,351 |
Note 1: For 2018/19 onwards, support previously recorded as Activity Agreements is recorded in the Training category. For more information see section 4.4.
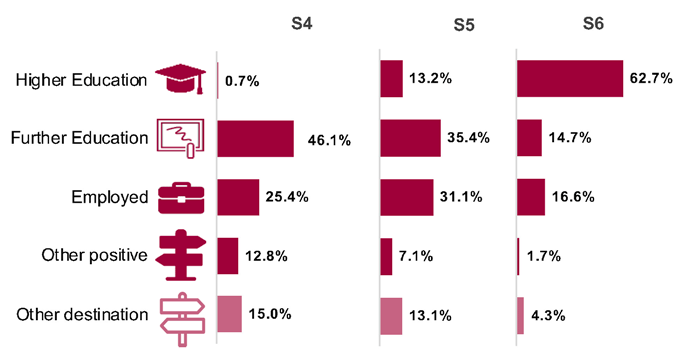
2.2 Destinations by stage
The follow-up destinations of 2019/20 school leavers by stage of leaving (Chart 1) show:
- the majority of S6 leavers were in Higher Education (62.7 per cent);
- the most common follow-up destination for S5 leavers was Further Education (35.4 per cent) followed by Employment (31.1 per cent);
- the most common destination for S4 leavers was Further Education (46.1 per cent).
Note 2: Other positive includes Personal Skills Development, Training and Voluntary Work.
Note 3: Other destinations include Unemployed Seeking, Unemployed Not Seeking and Unknown.
Note 4: A small percentage of school leavers left in other stages not shown in this graph. For more information, see the supplementary tables. A list of these tables is available in section 4.7.
A breakdown of the number of school leavers by stage is available in Table C1.1 of the supplementary tables (see supporting files). Analysis of the 2019/20 school leaver cohort[2] was published in February. These statistics showed that the 2019/20 cohort was the smallest school leaver cohort since consistent records began in 2009/10 and that 62.8 per cent of the school leaver cohort were made up of S6 leavers, 25.8 per cent were S5 leavers and 11.4 per cent were S4 leavers. Analysis of these figures alongside the Pupil Census[3] suggests that the reduction in the number of school leavers in 2019/20 does not correspond to a reduction in the associated number of senior phase pupils recorded on school rolls at the beginning of the school year. It is possible that some S4 and S5 pupils who might have otherwise left school in 2019/20 decided instead to stay at school for reasons related to the coronavirus (COVID-19) pandemic. Further detail on the trends of the school leaver cohort by size and stage of leaving is available in 'Summary Statistics for Attainment and Initial Leaver Destinations, No. 3: 2021 Edition' (chapter 2).
2.3 Destinations by deprivation
Chart 2 shows that the percentage of school leavers in a positive follow-up destination has decreased slightly for leavers from both the most deprived and least deprived areas in 2019/20, based on the Scottish Index of Multiple Deprivation (SIMD). The deprivation gap has remained broadly the same as in 2018/19, falling slightly from 8.4 percentage points in 2018/19 to 8.3 percentage points in 2019/20. The deprivation gap has slightly narrowed because the proportion in a positive follow-up destination decreased by more for pupils from the least deprived areas than for those from the most deprived areas.
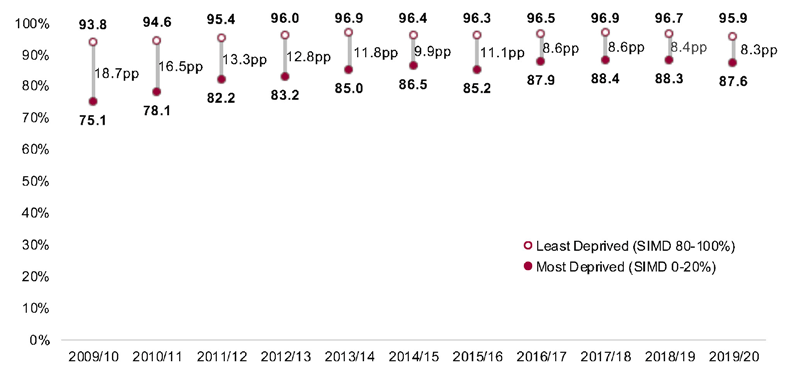
Note 5: pp = percentage point difference between most and least deprived SIMD quintile
Note 6: Based on SIMD 2009 for 2009/10 and 2010/11, SIMD 2012 for 2011/12 to 2015/16 and SIMD 2016 for 2016/17, 2017/18, 2018/19 and 2019/20. More information on the Scottish Index of Multiple Deprivation 2016 can be found at: https://www.gov.scot/publications/scottish-index-multiple-deprivation-2016/.
Table 2 below provides a breakdown of follow-up school leaver destinations by SIMD. It shows that pupils from the most deprived areas continue to be less likely to be in Higher Education than those from the least deprived areas, 9 months after the end of the school year.
In 2019/20, the most common destination for leavers from the most deprived areas was Further Education at 31.5 per cent.
In 2019/20, 10.8 per cent of leavers from the most deprived areas were unemployed, compared to 3.6 per cent of leavers from the least deprived areas.
| Follow-up Destination | 0-20% (Most Deprived) | 20-40% | 40-60% | 60-80% | 80-100% (Least Deprived) | Percentage point gap | Total |
|---|---|---|---|---|---|---|---|
| Higher Education | 27.0 | 33.5 | 42.7 | 50.3 | 62.6 | 35.6 | 42.9 |
| Further Education | 31.5 | 27.8 | 23.5 | 20.3 | 14.2 | -17.4 | 23.6 |
| Training | 6.3 | 4.2 | 2.3 | 1.7 | 1.0 | -5.3 | 3.2 |
| Employment | 20.5 | 23.8 | 23.7 | 21.6 | 17.4 | -3.1 | 21.3 |
| Voluntary Work | 0.4 | 0.3 | 0.4 | 0.3 | 0.3 | -0.1 | 0.3 |
| Personal Skills Development | 1.9 | 0.7 | 0.5 | 0.5 | 0.4 | -1.5 | 0.8 |
| Positive Destinations | 87.6 | 90.3 | 93.0 | 94.7 | 95.9 | 8.3 | 92.2 |
| Unemployed seeking | 6.6 | 5.2 | 3.8 | 2.7 | 2.2 | -4.4 | 4.1 |
| Unemployed Not Seeking | 4.2 | 3.4 | 2.2 | 2.0 | 1.4 | -2.8 | 2.7 |
| Unknown | 1.6 | 1.2 | 0.9 | 0.6 | 0.6 | -1.1 | 1.0 |
| Other Destinations | 12.4 | 9.7 | 7.0 | 5.3 | 4.1 | -8.3 | 7.8 |
| Number of Leavers | 10,439 | 9,149 | 9,024 | 9,469 | 9,270 | 47,351 |
Note 7: Based on SIMD 2016. More information on the Scottish Index of Multiple Deprivation can be found at: https://www.gov.scot/publications/scottish-index-multiple-deprivation-2016/.
Note 8: The percentage point gap measures the difference between leavers from the (20%) most and least deprived areas.
Section 2.1 showed that the proportion of all school leavers that were in a Higher Education follow-up destination increased between 2018/19 and 2019/20 to a record high while the proportion who were in Employment decreased to a record low. Time series data of destinations by deprivation (see section 4.7) shows that the proportion who were in a Higher Education follow-up destination increased among all SIMD groups but by least among those from the most deprived areas. Leavers from each SIMD group saw a decrease in the proportion entering Employment with there being no clear pattern by deprivation. Meanwhile, the proportion who were in Training and Personal Skills Development (PSD) follow-up destinations increased among all SIMD groups, but by more among those from the most deprived areas.
A time series of destinations by SIMD is available in the supplementary tables (see supporting files). A list of these tables is available in section 4.7.
2.4 Destinations by pupil characteristics
Table 3 shows the percentage of school leavers in a positive follow-up destination by various characteristics.
The percentage of 2019/20 school leavers in positive follow-up destinations has decreased for most groups, compared to 2018/19. The (percentage point) decrease was larger among males than among females; among those with an Additional Support Need than among those without; and among those from Remote Small Towns compared to those from other urban/rural categories. The percentage in a positive follow-up destination increased between 2018/19 and 2019/20 among some minority ethnic groups (including African/Black/Caribbean, Asian – Pakistani and Asian – Indian). However, the overall number of leavers in these ethnicity categories, in particular Asian-Indian, are relatively small and subject to fluctuation year-on-year.
As in previous cohorts, school leavers in 2019/20 with an Additional Support Need (ASN) were less likely to go on to a positive follow-up destination, compared to leavers without a recorded ASN (87.2 per cent compared to 94.9 per cent).
Pupils of an Asian ethnic background tend to be more likely to go on to a positive follow-up destination than those from other ethnic backgrounds.
Females continue to be more likely to be in a positive destination than males; 93.6 per cent of females and 90.9 per cent of males were in a positive destination.
Remote Small Towns had the lowest proportion of leavers in positive destinations (91.1 per cent), while Remote Rural areas continued to have the highest (93.8 per cent).
More information on destinations by pupil characteristics is available in the supplementary tables (see supporting files). A list of these tables is available in section 4.7.
| Pupil Characteristic | 2014/15 | 2015/16 | 2016/17 | 2017/18 | 2018/19 | 2019/20 |
|---|---|---|---|---|---|---|
| Sex | ||||||
| Male | 91.4 | 90.9 | 92.4 | 92.4 | 92.1 | 90.9 |
| Female | 92.9 | 92.3 | 94.0 | 94.3 | 93.7 | 93.6 |
| Ethnicity1 | ||||||
| White - Scottish | 92.1 | 91.5 | 93.0 | 93.2 | 92.7 | 92.0 |
| White - non-Scottish | 92.2 | 92.8 | 93.9 | 94.2 | 93.5 | 92.3 |
| Mixed or multiple ethnic groups | 93.0 | 93.0 | 92.7 | 93.6 | 92.8 | 91.7 |
| Asian - Indian | 96.3 | 96.9 | c | 97.2 | 94.4 | 95.4 |
| Asian - Pakistani | 95.2 | 92.5 | 95.7 | 93.5 | 94.8 | 95.6 |
| Asian - Chinese | 97.1 | 95.9 | c | 96.8 | c | c |
| Asian - Other | 96.2 | 95.1 | 95.3 | 93.9 | c | c |
| African/ Black/ Caribbean2 | 94.4 | 92.3 | 93.9 | 96.0 | 94.1 | 95.1 |
| All other categories3 | 91.2 | 88.4 | 94.5 | 92.0 | 93.6 | 93.3 |
| Not Disclosed/Not known | 90.6 | 88.8 | 90.7 | 89.8 | 88.9 | 90.2 |
| Urban/Rural | ||||||
| Large Urban Areas | 91.6 | 90.2 | 92.4 | 92.4 | 92.4 | 92.2 |
| Other Urban Areas | 91.7 | 91.6 | 92.4 | 92.9 | 92.1 | 91.4 |
| Accessible Small Towns | 93.5 | 93.6 | 93.3 | 93.7 | 93.7 | 93.0 |
| Remote Small Towns | 93.5 | 93.3 | 94.6 | 94.8 | 93.6 | 91.1 |
| Accessible Rural | 92.7 | 92.4 | 95.2 | 95.1 | 94.5 | 93.7 |
| Remote Rural | 95.8 | 93.2 | 96.4 | 95.9 | 94.6 | 93.8 |
| Additional Support Needs4 | ||||||
| ASN | 86.2 | 85.2 | 87.7 | 88.4 | 87.9 | 87.2 |
| No ASN | 93.7 | 93.5 | 95.0 | 95.3 | 95.1 | 94.9 |
| All Leavers | 92.2 | 91.6 | 93.1 | 93.3 | 92.9 | 92.2 |
Note 9: Some categories have been grouped together due to small numbers. Some categories contain between 100-200 leavers and may be subject to fluctuation. Comparisons between groups should take this into account.
Note 10: The 'African/ Black/ Caribbean' category includes 'African', 'African - Other', and the 'Caribbean or Black' categories. 'All other categories' includes 'Other - other' and 'Other - Arab'.
Note 11: Pupils who have a Coordinated Support Plan (CSP), Individualised Education Programme (IEP), Child's Plan, are assessed or declared disabled, or have another need.
Contact
Email: school.stats@gov.scot