Summary Statistics for Attainment and Initial Leaver Destinations, No. 5: 2023 Edition
This statistical publication provides information on the educational attainment and initial destinations of 2021/22 school leavers from publicly funded schools in Scotland.
Part of
Chapter 3: School Leaver Destinations
- 95.7 per cent of 2021/22 school leavers were in a positive initial destination. This is an increase from 2020/21 (95.5 per cent) and the highest since consistent records began in 2009/10.
- The most common initial destination was Higher Education, with 41.2 per cent of leavers in this category. This is a decrease from 2020/21 (45.1 per cent).
- 25.1 per cent of leavers were in Employment. This is an increase from 2020/21 (22.6 per cent) and the highest since consistent records began.
- The percentage of school leavers in a positive initial destination has increased for leavers from both the (20%) most deprived and (20%) least deprived areas, compared to 2020/21.
- The gap between the two groups has decreased from 4.8 percentage points in 2020/21 to 4.4 percentage points in 2021/22, the lowest it has been since consistent records began in 2009/10.
As described in section 1.2.1, the coronavirus pandemic (COVID-19) will have had an impact on the initial destination choices made by, and opportunities available to, school leavers. The greatest effect of the pandemic on school leaver destinations is likely to have been seen in 2019/20. However it is likely that there has been some ongoing impact on the destinations of some 2020/21 and 2021/22 school leavers. The impacts of COVID-19 should be kept in mind when interpreting changes between 2019/20, 2020/21 and 2021/22, and when comparing these to other years.
3.1 Destinations of School Leavers
Table 1 shows that 95.7 per cent of all 2021/22 school leavers were in a positive initial destination. This was higher than in 2020/21 (95.5 per cent) and the highest since consistent records began in 2009/10.
The proportion of leavers in Higher Education decreased from 45.1 per cent in 2020/21 – which was the highest since consistent records began in 2009/10 – to 41.2 per cent in 2021/22. This decrease brings the proportion of school leavers in Higher Education in 2021/22 back into line with figures seen before the COVID-19 pandemic.
The proportion of school leavers in Further Education increased from 23.3 per cent in 2020/21 – the lowest on record since 2009/10 – to 25.5 per cent in 2021/22. While this was an increase from the record low in 2020/21, it was still the second lowest proportion of leavers in Further Education since 2009/10.
Combining the results for these two categories shows that 66.7 per cent of 2021/22 school leavers were in Higher or Further Education three months after the end of the school year. This is a decrease from 2020/21 (68.4 per cent) and was driven by the reduction in the proportion of leavers in Higher Education.
The percentage of school leavers in Employment three months after leaving school increased from 22.6 per cent in 2020/21 to 25.1 per cent in 2021/22, a rise of 2.5 percentage points. This is the highest proportion since consistent records began in 2009/10.
The percentage of school leavers who were Unemployed (either Unemployed Seeking or Unemployed Not Seeking) decreased from 4.2 per cent in 2020/21 to 3.9 per cent for 2021/22 school leavers. This is the lowest proportion since consistent records began.
| Destination Category | 2016/17 | 2017/18 | 2018/19 | 2019/20 | 2020/21 | 2021/22 |
|---|---|---|---|---|---|---|
| Higher Education | 40.7 | 41.1 | 40.3 | 44.2 | 45.1 | 41.2 |
| Further Education | 26.8 | 26.5 | 27.3 | 28.1 | 23.3 | 25.5 |
| Training | 2.2 | 1.9 | 3.5 | 3.7 | 3.7 | 2.9 |
| Employment | 22.0 | 22.7 | 22.9 | 16.2 | 22.6 | 25.1 |
| Voluntary Work | 0.5 | 0.7 | 0.6 | 0.5 | 0.4 | 0.5 |
| Activity Agreement | 1.2 | 1.2 | [z] | [z] | [z] | [z] |
| Personal Skills Development | 0.4 | 0.4 | 0.5 | 0.8 | 0.5 | 0.5 |
| Positive Destinations | 93.9 | 94.6 | 95.0 | 93.3 | 95.5 | 95.7 |
| Unemployed Seeking | 4.4 | 3.7 | 3.1 | 4.1 | 2.5 | 2.3 |
| Unemployed Not Seeking | 1.4 | 1.3 | 1.4 | 1.8 | 1.7 | 1.5 |
| Unknown | 0.4 | 0.4 | 0.4 | 0.7 | 0.3 | 0.4 |
| Other Destinations | 6.1 | 5.4 | 5.0 | 6.7 | 4.5 | 4.3 |
| Number of Leavers | 51,300 | 49,748 | 49,760 | 47,454 | 50,746 | 55,237 |
Note 1: From 2018/19, support previously recorded as Activity Agreements is recorded in the Training category. As a result, the proportion of school leavers recorded in the Training category is not directly comparable prior to and post 2018/19. For more information see section 7.3.1.
Note 2: The 'Unknown' status in 2019/20 may have been affected by local partnerships' ability to track school leavers through home visits during the COVID-19 pandemic.
Note 3: Percentages may not total 100 due to rounding.
Note 4: Data from 2009/10 to 2021/22 are available in the supplementary tables.
Note 5: [z] = not applicable (see section 7.4.2 for a full list of symbols used in tables).
3.2 Destinations by Stage
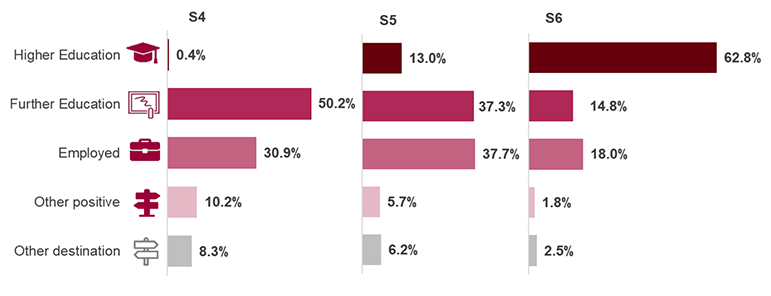
Chart 2 shows the initial destinations of 2021/22 school leavers by stage of leaving. It shows that:
- the majority of S6 leavers entered Higher Education (62.8 per cent);
- the most common initial destination for S5 leavers was Employment (37.7 per cent) followed closely by Further Education (37.3 per cent);
- half of S4 leavers entered Further Education (50.2 per cent).
[note 6] [note 7]
Note 6: 'Other positive' includes Personal Skills Development, Training and Voluntary Work.
Note 7: 'Other destination' includes Unemployed Seeking, Unemployed Not Seeking and Unknown.
3.3 Destinations by Deprivation
The National Improvement Framework uses a range of measures to monitor the poverty-related attainment gap. Following a user consultation in 2022, school leaver initial destinations was added as a new key measure. This section presents the data for this measure. Three other key measures, relating to school leaver attainment, are also presented in this report, in section 4.3
Chart 3 shows that the percentage of school leavers in a positive initial destination increased in 2021/22 compared to 2020/21, for leavers from both the (20%) most deprived and (20%) least deprived areas, based on the Scottish Index of Multiple Deprivation (SIMD) (see section 7.2.4).
Between 2020/21 and 2021/22 the proportion of school leavers in a positive initial destination increased by more amongst leavers from the most deprived areas than it did amongst those from the least deprived areas. This led to a decrease in the deprivation gap, from 4.8 percentage points in 2020/21 to 4.4 percentage points in 2021/22 – the smallest gap since consistent records began in 2009/10. The proportion of leavers from the most deprived areas in a positive destination increased from 92.8 per cent in 2020/21 to 93.4 per cent in 2021/22. The proportion of leavers from the least deprived areas in a positive destination increased from 97.6 per cent to 97.8 per cent.
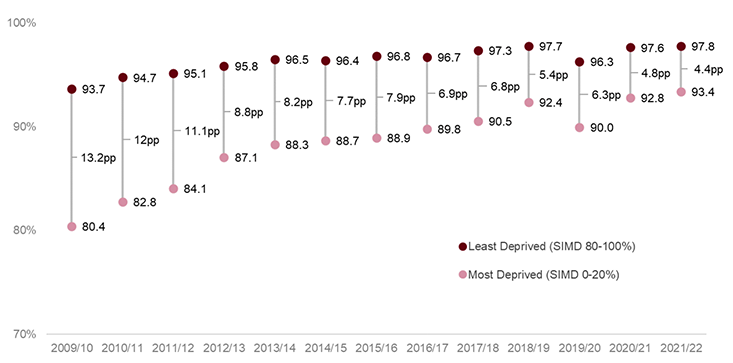
Note 8: pp = percentage point difference between most deprived and least deprived SIMD quintiles
Note 9: Based on SIMD 2009 for 2009/10 and 2010/11, SIMD 2012 for 2011/12 to 2015/16, SIMD 2016 for 2016/17 to 2019/20 and SIMD 2020 for 2020/21 and 2021/22. More information can be found on the Scottish Index of Multiple Deprivation
Time series data of destinations by deprivation (available in Table 2 in the supplementary tables) suggests that the narrowing of the gap between 2020/21 and 2021/22 is mainly due to the proportions of school leavers in employment. Whilst the proportion of school leavers entering employment increased across all SIMD groups between 2020/21 and 2021/22, the size of the increase was greater amongst school leavers from the most deprived areas (2.8 percentage points) than amongst those from the least deprived areas (1.7 percentage points).
Table 2 provides a breakdown of initial school leaver destinations by SIMD for 2021/22. It shows, for example, that pupils from the most deprived areas continue to be less likely to enter Higher Education than those from the least deprived areas.
In 2021/22, the most common destination for leavers from the most deprived areas was Further Education at 35.6 per cent.
In 2021/22, 6.0 per cent of leavers from the most deprived areas were unemployed, compared to 2.0 per cent of leavers from the least deprived areas.
| 2021/22 Initial Destination | 0-20% (Most Deprived) | 20-40% | 40-60% | 60-80% | 80-100% (Least Deprived) | Percentage point gap | Total |
|---|---|---|---|---|---|---|---|
| Higher Education | 26.4 | 32.4 | 39.1 | 48.3 | 62.3 | 35.9 | 41.2 |
| Further Education | 35.6 | 30.7 | 25.0 | 20.1 | 14.5 | -21.1 | 25.5 |
| Training | 5.8 | 3.7 | 2.2 | 1.7 | 0.8 | -4.9 | 2.9 |
| Employment | 24.3 | 27.2 | 28.7 | 25.9 | 19.4 | -4.9 | 25.1 |
| Voluntary Work | 0.4 | 0.4 | 0.5 | 0.5 | 0.6 | 0.1 | 0.5 |
| Personal Skills Development | 0.9 | 0.5 | 0.4 | 0.4 | 0.2 | -0.7 | 0.5 |
| Positive Destinations | 93.4 | 94.9 | 95.9 | 97.0 | 97.8 | 4.4 | 95.7 |
| Unemployed Seeking | 3.7 | 2.9 | 2.3 | 1.4 | 1.2 | -2.5 | 2.3 |
| Unemployed Not Seeking | 2.3 | 1.7 | 1.1 | 1.4 | 0.8 | -1.5 | 1.5 |
| Unknown | 0.6 | 0.5 | 0.5 | 0.2 | 0.2 | -0.4 | 0.4 |
| Other Destinations | 6.6 | 5.1 | 4.1 | 3.0 | 2.2 | -4.4 | 4.3 |
| Number of Leavers | 12,152 | 10,837 | 10,540 | 11,178 | 10,530 | [z] | 55,237 |
Note 10: Based on Scottish Index of Multiple Deprivation 2020.
Note 11: The percentage point gap measures the difference between leavers from the most and least deprived areas.
Note 12: Percentages may not total 100 due to rounding.
Note 13: [z] = not applicable. (See section 7.4.2 for full list of symbols used in tables.)
3.4 Destinations by Pupil Characteristics
Table 3 shows the percentage of school leavers who entered a positive initial destination by various characteristics.
The percentage of 2021/22 school leavers in positive initial destinations has increased for almost all groups, compared to 2020/21.
School leavers in 2021/22 with an Additional Support Need (ASN) were less likely to be in a positive initial destination (93.4 per cent) than leavers without a recorded ASN (97.3 per cent). This result is consistent with previous years. These statistics relate to leavers from mainstream schools only; similar statistics relating to destinations of mainstream and special school leavers combined are available in supplementary table L3.1.
Leavers in 2021/22 who were declared or assessed disabled were also less likely to be in a positive initial destination (92.3 per cent) than leavers who were not (95.8 per cent).
The proportions of school leavers in a positive initial destination increased for most ethnic groups between 2020/21 and 2021/22. Some figures have been suppressed due to the small numbers of school leavers involved. Amongst those groups for which data can be reported, the highest proportion of school leavers in a positive initial destination in 2021/22 was amongst African/ Black/ Caribbean leavers (98.8 per cent).
Female pupils continue to be more likely to enter positive destinations than male pupils: 96.3 per cent of female school leavers were in a positive initial destination in 2021/22, compared to 95.2 per cent of male leavers. This result is consistent with previous years although the gap has narrowed in 2021/22.
Accessible Rural and Remote Rural areas had the highest proportions of leavers in positive initial destinations in 2021/22 (both 96.6 per cent), whilst Remote Small Towns had the lowest (93.9 per cent).
More information on destinations by pupil characteristics is available in the supplementary tables.
| Pupil Characteristic | 2016/17 | 2017/18 | 2018/19 | 2019/20 | 2020/21 | 2021/22 |
|---|---|---|---|---|---|---|
| Sex | ||||||
| Male | 92.9 | 93.5 | 94.2 | 92.1 | 94.7 | 95.2 |
| Female | 94.9 | 95.6 | 95.9 | 94.6 | 96.2 | 96.3 |
| Ethnicity | ||||||
| White - Scottish | 93.7 | 94.4 | 94.9 | 93.2 | 95.5 | 95.6 |
| White - non-Scottish | 94.7 | 95.1 | 95.8 | 93.3 | 95.1 | 95.6 |
| Mixed or multiple ethnic groups | 94.9 | 95.5 | 93.8 | 92.3 | 96.5 | 94.6 |
| Asian - Indian | [c] | 97.2 | 97.2 | [c] | [c] | [c] |
| Asian - Pakistani | 96.5 | 95.8 | 97.1 | 97.2 | 96.7 | 98.6 |
| Asian - Chinese | [c] | 98.0 | [c] | [c] | [c] | [c] |
| Asian - Other | 96.4 | 97.0 | [c] | 95.0 | 97.0 | 97.4 |
| African/ Black/ Caribbean | 95.3 | 96.9 | 96.4 | 94.7 | 97.5 | 98.8 |
| All other categories | 93.7 | 91.7 | 93.7 | 93.4 | 94.9 | 96.3 |
| Not Disclosed/Not known | 92.7 | 91.5 | 92.8 | 91.2 | 92.7 | 95.5 |
| Urban/Rural | ||||||
| Large Urban Areas | 93.0 | 93.6 | 95.0 | 93.1 | 95.6 | 96.3 |
| Other Urban Areas | 93.4 | 94.4 | 94.5 | 92.7 | 94.9 | 95.0 |
| Accessible Small Towns | 94.5 | 94.8 | 95.7 | 94.2 | 95.7 | 96.2 |
| Remote Small Towns | 94.7 | 95.0 | 94.9 | 92.9 | 94.7 | 93.9 |
| Accessible Rural | 95.5 | 95.9 | 96.1 | 94.7 | 96.5 | 96.6 |
| Remote Rural | 96.0 | 96.7 | 95.8 | 94.5 | 96.7 | 96.6 |
| Additional Support Needs | ||||||
| ASN | 89.8 | 90.9 | 91.9 | 89.6 | 92.8 | 93.4 |
| No ASN | 95.3 | 96.0 | 96.5 | 95.4 | 97.0 | 97.3 |
| Disabled status | ||||||
| Declared or assessed disabled | 91.8 | 92.1 | 93.3 | 90.0 | 92.6 | 92.3 |
| Not declared or assessed disabled | 93.9 | 94.6 | 95.1 | 93.4 | 95.6 | 95.8 |
| All Leavers | 93.9 | 94.6 | 95.0 | 93.3 | 95.5 | 95.7 |
Note 14: Some categories have been grouped together due to small numbers. Some categories (typically 'Asian – Indian', 'Asian – Chinese' contain between 100-200 leavers and due to relatively small numbers may be subject to fluctuation. Comparisons between groups should take this into account.
Note 15: The 'African/ Black/ Caribbean' category includes 'African', 'African - Other', and the 'Caribbean or Black' categories.
Note 16: 'All other categories' includes 'Other - other' and 'Other - Arab'.
Note 17: Pupils who have a Coordinated Support Plan (CSP), Individualised Educational Programme (IEP) or Child's Plan are assessed or declared disabled or have another need.
Note 18: [c] = value suppressed to protect against the risk of disclosure of personal information. (See section 7.4.2 for full list of symbols used in tables.)
Contact
Email: school.stats@gov.scot