Summary Statistics for Attainment and Initial Leaver Destinations, No. 4: 2022 Edition
This statistical publication provides information on the educational attainment and initial destinations of 2020/21 school leavers from publicly funded schools in Scotland.
Part of
Chapter 4: School Leaver Attainment
- 66.0 per cent of school leavers left with one pass or more at SCQF Level 6 or better in 2020/21.
- 2.1 per cent of school leavers attained no passes at SCQF Level 3 or better in 2020/21.
- 96.5 per cent of leavers attained literacy at SCQF Level 3 or better in 2020/21.
- Similarly, 96.1 per cent of leavers attained numeracy at this level in 2020/21.
4.1 Attainment Data
Attainment data in this section accounts for National Qualifications achieved throughout all stages of a pupil's education at school. The range of qualifications included in the main measures in this publication can be found in the diagram in section 1.4.
The Scottish Credit and Qualifications Framework (SCQF) is used as the basis for reporting attainment. This publication reports the number of passes at a given SCQF level or better and highest SCQF level achieved at SCQF Levels 3 to 7. SCQF levels, in ascending order, indicate the level of difficulty of a particular qualification, and allow for broad comparisons to be made between qualifications. For more information, see sections 1.4 and 7.2.2.
As outlined in section 1.1.2, the coronavirus (COVID-19) pandemic led to the cancellation of 2020 and 2021 National 5 (SCQF Level 5), Higher (SCQF Level 6) and Advanced Higher (SCQF Level 7) exams and alternative approaches were taken to determining grades. This will have affected the attainment of many 2020/21 and 2019/20 school leavers presented in this report.
A dashed line break in the series has been placed between 2018/19 and 2019/20. This indicates that care must be taken when comparing attainment of school leavers in 2018/19 and before, with that of school leavers in 2019/20 and beyond. In addition, care should also be taken when comparing the attainment of 2019/20 and 2020/21 school leavers. Interpretation of changes must take full account of the different certification methods used in different years, and changes in the attainment levels in 2019/20 and 2020/21 should not be seen as an indication that performance has improved or worsened, without further evidence.
In addition, as outlined in chapter 2, the relative size and make-up of last year's (2019/20) school leaver cohort indicated that it is likely some S4 and S5 pupils who might have otherwise left school in 2019/20 decided instead to stay at school, possibly for reasons related to the coronavirus (COVID-19) pandemic. Pupils in this position, many of whom will have left school in 2020/21, will have had opportunities to gain additional qualifications and/or higher levels of qualifications, than if had they left in 2019/20. This should also be kept in mind when comparing attainment over time.
4.2 Attainment of School Leavers
Table 4 shows that 32.0 per cent of 2020/21 school leavers left with one pass or more at SCQF Levels 3 to 5 as their highest qualification (1.8 per cent at SCQF Level 3, 8.5 per cent at SCQF Level 4 and 21.7 per cent at SCQF Level 5). 66.0 per cent left with one pass or more at SCQF Level 6 or 7 (41.8 per cent at SCQF Level 6 and 24.2 per cent at SCQF Level 7) - the highest level since 2009/10. This should be interpreted with care given the change in assessment methods in 2020 and 2021, as outlined above and in section 1.1.2.
A small proportion (2.1 per cent) of school leavers attained no passes in National Qualifications at SCQF Level 3 or better in 2020/21. Some of these school leavers have attainment either in courses at SCQF Levels 1 or 2, or in courses/units not covered in these statistics (such as National Progression Awards, National Certificates and Awards). These data can be found in supplementary tables A1.4a and A1.4b.
| Percentage | ||||||
| SCQF Level | 2015/16 | 2016/17 | 2017/18 | 2018/19 | 2019/20 | 2020/21 |
|---|---|---|---|---|---|---|
| No passes at SCQF 3 or better | 2.0 | 2.0 | 2.2 | 2.2 | 2.0 | 2.1 |
| SCQF Level 3 | 1.7 | 1.7 | 1.6 | 1.9 | 2.2 | 1.8 |
| SCQF Level 4 | 10.7 | 10.2 | 10.3 | 10.9 | 10.1 | 8.5 |
| SCQF Level 5 | 23.9 | 24.9 | 23.8 | 24.5 | 21.8 | 21.7 |
| SCQF Level 6 | 42.6 | 41.9 | 42.0 | 41.4 | 40.6 | 41.8 |
| SCQF Level 7 | 19.1 | 19.3 | 20.2 | 19.1 | 23.2 | 24.2 |
| Number of leavers | 52,305 | 51,300 | 49,748 | 49,760 | 47,454 | 50,746 |
Note 19: A dashed line break has been placed between the attainment figures for 2018/19 and 2019/20 school leavers reflecting the impact of the change to the assessment approach in 2020 and 2021 on 2019/20 and 2020/21 school leaver attainment. Further information can be found in section 1.1.2.
Table 5 provides information on the number of passes achieved by school leavers at each SCQF Level or better.
A time series from 2009/10 to 2020/21 is presented in Table 5 in the supplementary tables.
| 2020/21 | Percentage | ||||||
|---|---|---|---|---|---|---|---|
| SCQF Level | 1 pass or more | 2 passes or more | 3 passes or more | 4 passes or more | 5 passes or more | 6 passes or more | 7 passes or more |
| 3 or better | 97.9 | 96.5 | 94.6 | 92.4 | 89.1 | 82.9 | 70.6 |
| 4 or better | 96.2 | 93.9 | 91.8 | 89.2 | 85.5 | 79.3 | 67.6 |
| 5 or better | 87.7 | 81.9 | 76.3 | 69.9 | 62.6 | 54.1 | 43.6 |
| 6 or better | 66.0 | 57.7 | 50.5 | 43.4 | 35.3 | 23.6 | 12.2 |
| 7 | 24.2 | 11.0 | 3.7 | 0.4 | [low] | 0.0 | 0.0 |
| 2019/20 | Percentage | ||||||
| SCQF Level | 1 pass or more | 2 passes or more | 3 passes or more | 4 passes or more | 5 passes or more | 6 passes or more | 7 passes or more |
| 3 or better | 98.0 | 96.3 | 94.1 | 91.8 | 88.1 | 81.2 | 67.9 |
| 4 or better | 95.8 | 93.3 | 90.9 | 88.1 | 84.1 | 77.6 | 64.9 |
| 5 or better | 85.7 | 79.2 | 73.0 | 66.4 | 59.2 | 51.0 | 40.5 |
| 6 or better | 63.9 | 55.2 | 47.9 | 40.9 | 32.9 | 21.5 | 10.7 |
| 7 | 23.2 | 10.4 | 3.5 | 0.3 | [c] | [c] | 0.0 |
| 2018/19 | Percentage | ||||||
| SCQF Level | 1 pass or more | 2 passes or more | 3 passes or more | 4 passes or more | 5 passes or more | 6 passes or more | 7 passes or more |
| 3 or better | 97.8 | 96.1 | 94.0 | 91.6 | 87.7 | 80.5 | 66.3 |
| 4 or better | 95.9 | 93.6 | 91.2 | 88.2 | 84.0 | 77.1 | 63.5 |
| 5 or better | 85.1 | 77.6 | 70.5 | 63.4 | 55.8 | 47.8 | 37.6 |
| 6 or better | 60.5 | 50.6 | 43.0 | 36.1 | 28.7 | 18.5 | 8.9 |
| 7 | 19.1 | 8.0 | 2.7 | 0.3 | [c] | [c] | 0.0 |
Note 20: A dashed line break has been placed between the attainment figures for 2018/19 and 2019/20 school leavers reflecting the impact of the change to the assessment approach in 2020 and 2021 on 2019/20 and 2020/21 school leaver attainment. Further information can be found in section 1.1.2.
4.3 Attainment by Deprivation
In 2017, the Scottish Government consulted on proposals for measuring the poverty related attainment gap and milestones towards closing it; focusing on the impact of the education system as a whole and using a range of measures that reflect key stages of the learner journey and the breadth of issues that can impact on attainment.
The outcome was a basket of 11 key measures (supported by 15 sub-measures) of the attainment gap, three of which are based on school leaver attainment by deprivation, namely:
- The proportion of leavers attaining one pass or more at SCQF Level 4 or better
- The proportion of leavers attaining one pass or more at SCQF Level 5 or better
- The proportion of leavers attaining one pass or more at SCQF Level 6 or better
Chart 4 shows the proportions of school leavers from the most and least deprived areas who attained 1 pass or more at SCQF Levels 4 or better, 5 or better and 6 or better. As described in Section 1.1.2, care should be taken when making comparisons between 2020/21 and earlier years and any increase or decrease should not be interpreted as indicating improving or worsening performance without further evidence.
At SCQF Level 4 or better, the gap between the proportion of school leavers from the most deprived and least deprived areas attaining 1 pass or more was 6.3 percentage points. This is down from 7.1 percentage points in 2019/20, due to an increase in the proportion of leavers from the most deprived areas who attained a pass at this level.
Following a steady reduction in the gap from 2009/10 (11.3 percentage points) to 2016/17 (5.9 percentage points), the gap then widened each year until 2019/20, when it was the widest it had been since 2012/13 (7.1 percentage points). In 2020/21 the gap has narrowed, and is now similar to levels from the years 2014/15 and 2015/16.
At SCQF Level 5 or better, the gap was 18.2 percentage points in 2020/21. This is down from 20.8 percentage points in 2019/20. Between 2019/20 and 2020/21 the proportion attaining 1 pass or more has increased for school leavers from both the most and the least deprived areas, but increased by more for those from the most deprived areas, which has led to the gap narrowing.
Between 2009/10 and 2016/17 the attainment gap at SCQF Level 5 or better reduced steadily from 33.3 percentage points to 19.3 percentage points. Between 2017/18 and 2018/19 it remained broadly stable at just over 20 percentage points and increased to 20.8 percentage points in 2019/20 before the drop to 18.2 percentage points in 2020/21.
At SCQF Level 6 or better, the gap was 34.4 percentage points in 2020/21. This is down from 36.1 percentage points in 2019/20. The proportion attaining 1 pass or more has increased for school leavers from both the most and least deprived areas, but has increased by more for those from the most deprived areas, which has led to the gap narrowing.
Over the longer term, the gap has reduced from 45.6 percentage points in 2009/10.
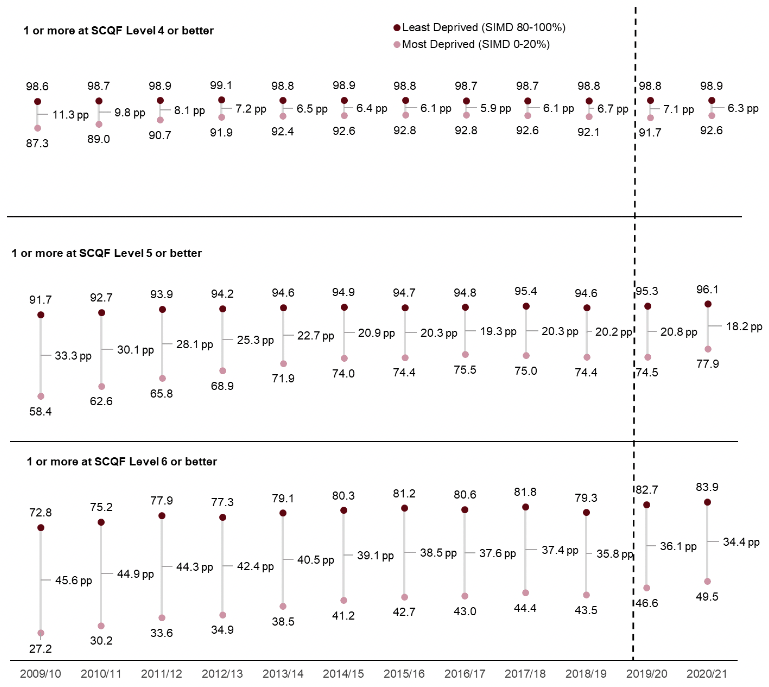
Note 21: pp = percentage point difference between most and least deprived quintile
Note 22: Based on the Scottish Index of Multiple Deprivation (SIMD) 2009 for 2009/10 and 2010/11, SIMD 2012 for 2011/12 to 2015/16, SIMD 2016 for 2016/17 to 2019/20, and SIMD 2020 for 2020/21. More information on the Scottish Index of Multiple Deprivation.
Note 23: A dashed line break has been placed between the attainment figures for 2018/19 and 2019/20 school leavers reflecting the impact of the change to the assessment approach in 2020 and 2021 on 2019/20 and 2020/21 school leaver attainment. Further information can be found in section 1.1.2.
4.4 Attainment by Pupil Characteristics
Table 6 shows school leaver attainment by pupil characteristic, such as sex and ethnicity. It shows that females are continuing to outperform males at SCQF Levels 4 to 6 or better, with the gap being wider at higher SCQF levels.
Pupils recorded as Asian-Chinese continue to have high levels of attainment compared to other groups, with 94.7 per cent achieving one pass or more at SCQF Level 6 or better.
Pupils with a recorded Additional Support Need (ASN) are less likely to achieve SCQF Levels 4 to 6 or better, than pupils without an ASN.
In 2020/21 pupils living in Accessible Rural and Remote Rural areas are the most likely to achieve at SCQF Levels 4 or better and 5 or better whilst at SCQF level 6 or better pupils living in Accessible Rural areas and Large Urban areas have the highest levels of attainment.
Broad patterns in attainment by pupil characteristic are typically stable year on year, although small numbers in some characteristic groups mean fluctuations do occur. Table 6 shows that, compared to 2019/20, a higher percentage of 2020/21 school leavers achieved one pass or more at SCQF Level 4, 5 and 6 or better across almost all characteristic breakdowns.
| Percentage | ||||||
| Pupil Characteristic | 2019/20 | 2020/21 | ||||
|---|---|---|---|---|---|---|
| 1 or more at SCQF Level 4 or better | 1 or more at SCQF Level 5 or better | 1 or more at SCQF Level 6 or better | 1 or more at SCQF Level 4 or better | 1 or more at SCQF Level 5 or better | 1 or more at SCQF Level 6 or better | |
| Sex | ||||||
| Male | 95.0 | 83.2 | 57.8 | 95.6 | 85.8 | 60.6 |
| Female | 96.6 | 88.3 | 70.1 | 96.8 | 89.5 | 71.5 |
| Ethnicity | ||||||
| White - Scottish | 95.7 | 85.2 | 62.7 | 96.1 | 87.3 | 64.9 |
| White - non-Scottish | 95.5 | 86.1 | 65.3 | 95.6 | 87.9 | 66.4 |
| Mixed or multiple ethnic groups | 95.5 | 89.7 | 70.2 | 97.1 | 91.3 | 76.2 |
| Asian - Indian | [c] | [c] | 82.3 | [c] | [c] | 84.9 |
| Asian - Pakistani | 99.0 | 94.0 | 80.4 | 99.2 | 93.6 | 79.8 |
| Asian - Chinese | [c] | [c] | 92.5 | 100.0 | [c] | 94.7 |
| Asian - Other | 97.0 | 92.6 | 79.9 | [c] | 91.4 | 81.4 |
| African/ Black/ Caribbean | 97.1 | 93.8 | 78.2 | 98.2 | 93.9 | 83.7 |
| All other categories | 93.7 | 85.4 | 65.4 | 96.0 | 88.4 | 63.9 |
| Not Disclosed/Not known | 92.8 | 79.7 | 61.7 | 93.1 | 83.2 | 61.5 |
| Urban/Rural | ||||||
| Large Urban Areas | 95.7 | 85.9 | 65.9 | 96.0 | 87.8 | 67.8 |
| Other Urban Areas | 95.4 | 83.9 | 61.0 | 96.0 | 86.2 | 63.8 |
| Accessible Small Towns | 96.3 | 86.8 | 65.8 | 96.4 | 89.1 | 67.2 |
| Remote Small Towns | 95.1 | 85.0 | 59.1 | 95.3 | 85.5 | 62.4 |
| Accessible Rural | 96.6 | 88.6 | 66.9 | 97.1 | 90.0 | 68.6 |
| Remote Rural | 97.0 | 89.8 | 67.0 | 97.0 | 90.8 | 67.1 |
| Additional Support Needs | ||||||
| ASN | 90.8 | 71.4 | 43.3 | 92.1 | 75.4 | 47.1 |
| No ASN | 98.5 | 93.5 | 75.1 | 98.6 | 94.8 | 77.0 |
| All Leavers | 95.8 | 85.7 | 63.9 | 96.2 | 87.7 | 66.0 |
Note 24: Some categories have been grouped together due to small numbers. Some categories (typically 'Asian – Indian' and 'Asian – Chinese') contain between 100-200 leavers and due to relatively small numbers may be subject to fluctuation. Comparisons between groups should take this into account.
Note 25: The 'African/Black/Caribbean' category includes 'African', 'African - Other' and 'Caribbean or Black' categories
Note 26: 'All other categories' includes 'Other - other' and 'Other - Arab'.
Note 27: Pupils who have a Coordinated Support Plan (CSP), Individualised Educational Programme (IEP) or Child's Plan are assessed or declared disabled or have another need.
4.5 Literacy and Numeracy
Literacy and numeracy are key skills for any school leaver. Literacy is taken to be the ability to communicate by reading, writing and listening and talking. Numeracy is defined as the ability to use numbers in order to solve problems by counting, doing calculations, measuring, and understanding graphs and charts.
A range of courses are included in the literacy and numeracy measures, as set out in background note 7.2.2. These courses are selected based upon the outcomes and assessment standards for SQA's literacy and numeracy units at National 3, 4 and 5, with the key criterion being that the main purpose of the qualification or award is to improve literacy and/or numeracy skills.
When looking at achievement in literacy and numeracy, a pass in relevant units (rather than full qualifications, for example) can count as achieving literacy or numeracy at that level. With unit based courses, a pupil who did not pass the full course, but did achieve the relevant units, would be counted as achieving literacy or numeracy at that level.
Mandatory unit assessments were removed from National 5s in 2017/18 and from Highers in 2018/19. This means that it is no longer mandatory for a pupil to complete unit assessments in order to achieve National 5 and Higher qualifications. This change is likely to have an effect on the literacy and numeracy attainment figures over time.
Table 7 shows the percentage of school leavers attaining literacy and numeracy at SCQF Levels 3 to 5 or better. At each level, more leavers attained literacy skills than numeracy skills, and this was more marked at higher SCQF levels.
At SCQF Level 3 or better, 96.5 per cent of 2020/21 school leavers attained literacy and 96.1 per cent attained numeracy. At SCQF Level 4 or better, 94.6 per cent of school leavers attained literacy and 91.6 per cent attained numeracy. At SCQF Level 5 or better, 83.4 per cent of school leavers attained literacy and 72.4 per cent attained this level in numeracy.
| Percentage | ||||||||
| SCQF Level | Literacy | Numeracy | ||||||
|---|---|---|---|---|---|---|---|---|
| 2017/18 | 2018/19 | 2019/20 | 2020/21 | 2017/18 | 2018/19 | 2019/20 | 2020/21 | |
| 3 or better | 96.3 | 96.1 | 96.2 | 96.5 | 95.8 | 95.8 | 96.1 | 96.1 |
| 4 or better | 94.3 | 93.9 | 93.9 | 94.6 | 90.8 | 91.4 | 91.6 | 91.6 |
| 5 or better | 81.6 | 81.7 | 81.7 | 83.4 | 69.1 | 68.7 | 71.0 | 72.4 |
Note 28: As described above caution should be exercised if making comparisons over time.
Contact
Email: andrew.white@gov.scot