Summary Statistics for Attainment and Initial Leaver Destinations, No. 4: 2022 Edition
This statistical publication provides information on the educational attainment and initial destinations of 2020/21 school leavers from publicly funded schools in Scotland.
Part of
Chapter 3: School Leaver Destinations
- 95.5 per cent of 2020/21 school leavers were in a positive initial destination (93.3 per cent for 2019/20). This is the highest since consistent records began in 2009/10.
- 45.1 per cent of school leavers were in Higher Education (the highest proportion of all categories, and the highest percentage since consistent records began in 2009/10).
- The percentage of school leavers in a positive initial destination has increased in 2020/21 for leavers from both the (20%) most deprived and (20%) least deprived areas compared to 2019/20.
- The gap between the two groups has decreased from 6.3 percentage points in 2019/20 to 4.8 percentage points in 2020/21 (the lowest it has been since consistent records began in 2009/10).
As described in section 1.1.1, the 2019/20 and 2020/21 figures on school leavers' initial destinations will reflect the impact of the coronavirus pandemic (COVID-19) on choices made by, and opportunities available to, leavers in these years.
Particular care should therefore be taken when interpreting changes between 2019/20, 2020/21, and other years. The pandemic will have been at least partly responsible for the relatively low proportion of 2019/20 school leavers in a positive destination compared to surrounding years and the size of the latest increase in 2020/21 should be interpreted with this in mind.
3.1 Destinations of School Leavers
Table 1 shows that 95.5 per cent of all 2020/21 school leavers were in a positive initial destination. This was higher than in 2019/20 (93.3 per cent) and the highest since consistent records began in 2009/10.
In 2020/21, 68.4 per cent of school leavers were in Higher or Further Education approximately 3 months after leaving school. This was lower than in 2019/20 (72.2 per cent) but higher than in 2018/19 (67.6 per cent). This drop between 2019/20 and 2020/21 was driven by a drop in the proportion of school leavers in Further Education. Between 2019/20 and 2020/21 the proportion of school leavers in Further Education decreased from 28.1 per cent to 23.3 per cent – the lowest on record. Over the same period (2019/20 to 2020/21) the proportion of leavers in Higher Education increased from 44.2 per cent to 45.1 per cent – the highest proportion since 2009/10.
The percentage of school leavers in Employment has increased from 16.2 per cent in 2019/20 to 22.6 per cent in 2020/21. This increase follows a large drop from 22.9 per cent in 2018/19 to the record low figure of 16.2 per cent in 2019/20, reflecting the impact of the coronavirus pandemic (COVID-19) on school leavers' choices and opportunities. The subsequent increase in 2020/21 brings the proportion of school leavers entering employment back into line with pre-pandemic figures.
The percentage of school leavers who were Unemployed has decreased from 6.0 per cent for 2019/20 to 4.2 per cent for 2020/21 school leavers.
| Destination Category | 2015/16 | 2016/17 | 2017/18 | 2018/19 | 2019/20 | 2020/21 |
|---|---|---|---|---|---|---|
| Higher Education | 40.3 | 40.7 | 41.1 | 40.3 | 44.2 | 45.1 |
| Further Education | 26.6 | 26.8 | 26.5 | 27.3 | 28.1 | 23.3 |
| Training | 2.3 | 2.2 | 1.9 | 3.5 | 3.7 | 3.7 |
| Employment | 22.3 | 22.0 | 22.7 | 22.9 | 16.2 | 22.6 |
| Voluntary Work | 0.5 | 0.5 | 0.7 | 0.6 | 0.5 | 0.4 |
| Activity Agreement | 1.0 | 1.2 | 1.2 | [z] | [z] | [z] |
| Personal Skills Development | 0.5 | 0.4 | 0.4 | 0.5 | 0.8 | 0.5 |
| Positive Destinations | 93.5 | 93.9 | 94.6 | 95.0 | 93.3 | 95.5 |
| Unemployed Seeking | 5.0 | 4.4 | 3.7 | 3.1 | 4.1 | 2.5 |
| Unemployed Not Seeking | 1.2 | 1.4 | 1.3 | 1.4 | 1.8 | 1.7 |
| Unknown | 0.2 | 0.4 | 0.4 | 0.4 | 0.7 | 0.3 |
| Other Destinations | 6.5 | 6.1 | 5.4 | 5.0 | 6.7 | 4.5 |
| Number of Leavers | 52,305 | 51,300 | 49,748 | 49,760 | 47,454 | 50,746 |
Note 1: From 2018/19, support previously recorded as Activity Agreements is recorded in the Training category. As a result, the proportion of school leavers recorded in the Training category is not directly comparable prior to and post 2018/19. For more information see section 7.3.1.
Note 2: The 'Unknown' status in 2019/20 may be affected by local partnerships' ability to track school leavers through home visits during the COVID-19 pandemic.
Note 3: Percentages may not total 100 due to rounding.
Note 4: Data from 2009/10 to 2020/21 are available in the supplementary tables.
Note 5: [z] = not applicable (see section 7.3.2 for full list of symbols used in tables).
3.2 Destinations by Stage
Chart 2 shows the initial destinations of 2020/21 school leavers by stage of leaving. It shows that:
- the majority of S6 leavers entered Higher Education (65.7 per cent);
- the most common initial destination for S5 leavers was Employment (36.4 per cent) followed by Further Education (35.0 per cent);
- S4 leavers were most likely to enter Further Education (49.0 per cent).
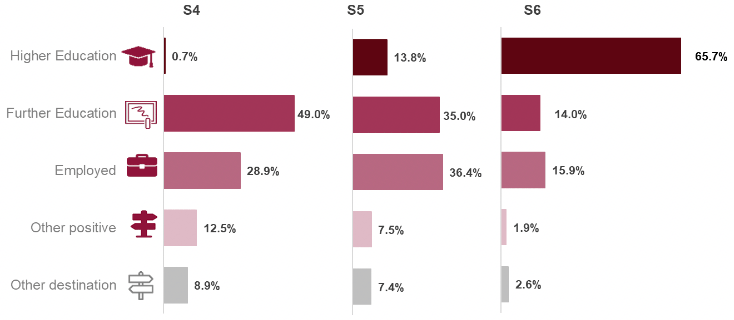
Note 6: 'Other positive' includes Personal Skills Development, Training and Voluntary Work.
Note 7: 'Other destination' includes Unemployed Seeking, Unemployed Not Seeking and Unknown.
3.3 Destinations by Deprivation
Chart 3 shows that the percentage of school leavers in a positive initial destination has increased in 2020/21 compared to 2019/20, for leavers from both the (20%) most deprived and (20%) least deprived areas, based on the Scottish Index of Multiple Deprivation (SIMD) (see section 7.2.4).
Between 2019/20 and 2020/21 the proportion of school leavers in a positive initial destination has increased by more amongst leavers from the most deprived areas than it has amongst those from the least deprived areas. This has led to a decrease in the deprivation gap, from 6.3 percentage points in 2019/20 to 4.8 percentage points in 2020/21 – the smallest gap on record. It should be noted that the size of the 2019/20 deprivation gap was likely affected by the coronavirus pandemic (COVID-19). Interpretation of the change between 2019/20 and 2020/21 should bear this in mind.
Time series data of destinations by deprivation (available in Table 2 in the supplementary tables) suggests that the narrowing of the gap between 2019/20 and 2020/21 is largely due to the proportions of school leavers entering employment. Section 3.1 showed that the proportion of all school leavers entering employment increased by 6.4 percentage points between 2019/20 and 2020/21. Whilst the proportion of school leavers entering employment increased across all SIMD groups between 2019/20 and 2020/21, the size of the increase was greater amongst school leavers from the most deprived areas (6.6 percentage points) than amongst those from the least deprived areas (4.4 percentage points).
Table 2 provides a breakdown of initial school leaver destinations by SIMD for 2020/21. It shows, for example, that pupils from the most deprived areas continue to be less likely to enter Higher Education than those from the least deprived areas.
In 2020/21, the most common destination for leavers from the most deprived areas was Further Education at 33.8 per cent.
In 2020/21, 6.6 per cent of leavers from the most deprived areas were unemployed, compared to 2.3 per cent of leavers from the least deprived areas.
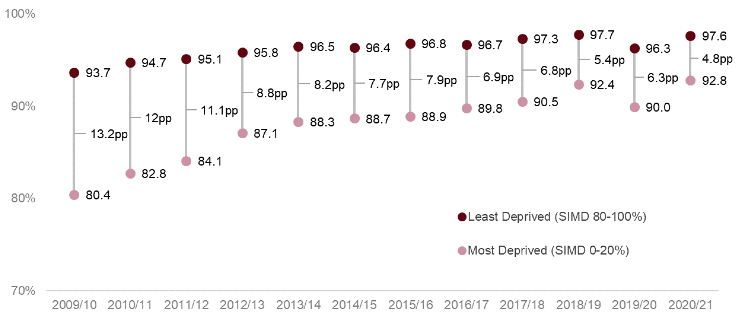
Note 8: pp = percentage point difference between most and least deprived SIMD quintile
Note 9: Based on SIMD 2009 for 2009/10 and 2010/11, SIMD 2012 for 2011/12 to 2015/16, SIMD 2016 for 2016/17 to 2019/20 and SIMD 2020 for 2020/21. More information can be found on the Scottish Index of Multiple Deprivation
| 2020/21 Initial Destination | 0-20% (Most Deprived) | 20-40% | 40-60% | 60-80% | 80-100% (Least Deprived) | Percentage point gap | Total |
|---|---|---|---|---|---|---|---|
| Higher Education | 29.2 | 36.5 | 43.9 | 52.1 | 65.1 | 35.9 | 45.1 |
| Further Education | 33.8 | 27.8 | 22.5 | 18.4 | 13.0 | -20.8 | 23.3 |
| Training | 6.9 | 5.0 | 2.7 | 2.2 | 1.3 | -5.5 | 3.7 |
| Employment | 21.4 | 24.3 | 26.1 | 23.5 | 17.7 | -3.7 | 22.6 |
| Voluntary Work | 0.4 | 0.4 | 0.3 | 0.4 | 0.4 | [low] | 0.4 |
| Personal Skills Development | 1.0 | 0.5 | 0.3 | 0.2 | 0.1 | -0.9 | 0.5 |
| Positive Destinations | 92.8 | 94.5 | 95.9 | 96.8 | 97.6 | 4.8 | 95.5 |
| Unemployed Seeking | 4.3 | 3.0 | 2.4 | 1.7 | 1.1 | -3.1 | 2.5 |
| Unemployed Not Seeking | 2.4 | 2.1 | 1.5 | 1.3 | 1.1 | -1.3 | 1.7 |
| Unknown | 0.6 | 0.4 | 0.3 | 0.2 | 0.1 | -0.4 | 0.3 |
| Other Destinations | 7.2 | 5.5 | 4.1 | 3.2 | 2.4 | -4.8 | 4.5 |
| Number of Leavers | 10,916 | 9,888 | 9,744 | 10,312 | 9,886 | 50,746 |
Note 10: Based on Scottish Index of Multiple Deprivation 2020.
Note 11: The percentage point gap measures the difference between the most and least deprived pupils.
Note 12: Percentages may not total 100 due to rounding.
Note 13: [low] = value less than 0.05%. (See section 7.3.2 for full list of symbols used in tables.)
3.4 Destinations by Pupil Characteristics
Table 3 shows the percentage of school leavers who entered a positive initial destination by various characteristics.
The percentage of 2020/21 school leavers in positive initial destinations has increased for almost all groups, compared to 2019/20.
School leavers in 2020/21 with an Additional Support Need (ASN) were less likely to go on to a positive initial destination, compared to leavers without a recorded ASN (92.8 per cent compared to 97.0 per cent) – a result consistent with previous years. These statistics relate to leavers from mainstream schools only; similar statistics relating to destinations of mainstream and special school leavers combined are available in Supplementary Table L3.1.
The proportions of school leavers in a positive destination increased for most ethnic groups between 2019/20 and 2020/21. The highest proportion of school leavers in a positive destination in 2020/21 was amongst the African / Black / Caribbean group.
Females continue to be more likely to enter positive destinations than males: 96.2 per cent of females and 94.7 per cent of males entered a positive destination in 2020/21. This result is consistent with previous years.
Remote Rural areas had the highest proportion of leavers in positive destinations in 2020/21 (96.7 per cent), whilst Remote Small Towns had the lowest (94.7 per cent).
More information on destinations by pupil characteristics is available in the supplementary tables.
| Pupil Characteristic | 2015/16 | 2016/17 | 2017/18 | 2018/19 | 2019/20 | 2020/21 |
|---|---|---|---|---|---|---|
| Sex | ||||||
| Male | 92.6 | 92.9 | 93.5 | 94.2 | 92.1 | 94.7 |
| Female | 94.4 | 94.9 | 95.6 | 95.9 | 94.6 | 96.2 |
| Ethnicity | ||||||
| White - Scottish | 93.4 | 93.7 | 94.4 | 94.9 | 93.2 | 95.5 |
| White - non-Scottish | 94.0 | 94.7 | 95.1 | 95.8 | 93.3 | 95.1 |
| Mixed or multiple ethnic groups | 92.8 | 94.9 | 95.5 | 93.8 | 92.3 | 96.5 |
| Asian - Indian | [c] | [c] | 97.2 | 97.2 | [c] | [c] |
| Asian - Pakistani | 93.6 | 96.5 | 95.8 | 97.1 | 97.2 | 96.7 |
| Asian - Chinese | [c] | [c] | 98.0 | [c] | [c] | [c] |
| Asian - Other | 95.9 | 96.4 | 97.0 | [c] | 95.0 | 97.0 |
| African/ Black/ Caribbean | 93.8 | 95.3 | 96.9 | 96.4 | 94.7 | 97.5 |
| All other categories | 93.1 | 93.7 | 91.7 | 93.7 | 93.4 | 94.9 |
| Not Disclosed/Not known | 92.3 | 92.7 | 91.5 | 92.8 | 91.2 | 92.7 |
| Urban/Rural | ||||||
| Large Urban Areas | 92.4 | 93.0 | 93.6 | 95.0 | 93.1 | 95.6 |
| Other Urban Areas | 93.8 | 93.4 | 94.4 | 94.5 | 92.7 | 94.9 |
| Accessible Small Towns | 94.1 | 94.5 | 94.8 | 95.7 | 94.2 | 95.7 |
| Remote Small Towns | 94.6 | 94.7 | 95.0 | 94.9 | 92.9 | 94.7 |
| Accessible Rural | 94.2 | 95.5 | 95.9 | 96.1 | 94.7 | 96.5 |
| Remote Rural | 94.7 | 96.0 | 96.7 | 95.8 | 94.5 | 96.7 |
| Additional Support Needs | ||||||
| ASN | 89.1 | 89.8 | 90.9 | 91.9 | 89.6 | 92.8 |
| No ASN | 94.8 | 95.3 | 96.0 | 96.5 | 95.4 | 97.0 |
| All Leavers | 93.5 | 93.9 | 94.6 | 95.0 | 93.3 | 95.5 |
Note 14: Some categories have been grouped together due to small numbers. Some categories (typically 'Asian – Indian', 'Asian – Chinese' contain between 100-200 leavers and due to relatively small numbers may be subject to fluctuation. Comparisons between groups should take this into account.
Note 15: The 'African/ Black/ Caribbean' category includes 'African', 'African - Other', and the 'Caribbean or Black' categories.
Note 16: 'All other categories' includes 'Other - other' and 'Other - Arab'.
Note 17: Pupils who have a Coordinated Support Plan (CSP), Individualised Educational Programme (IEP) or Child's Plan are assessed or declared disabled or have another need.
Note 18: [c] = value suppressed to protect against the risk of disclosure of personal information. (See section 7.3.2 for full list of symbols used in tables.)
Contact
Email: andrew.white@gov.scot