State of the economy: May 2022
This report summarises recent developments in the global and Scottish economy and provides an analysis of the performance of, and outlook for, the Scottish economy.
Labour Market
The labour market is tight: high levels of vacancies, low unemployment and shortages of workers affecting many sectors.
Employment and Unemployment
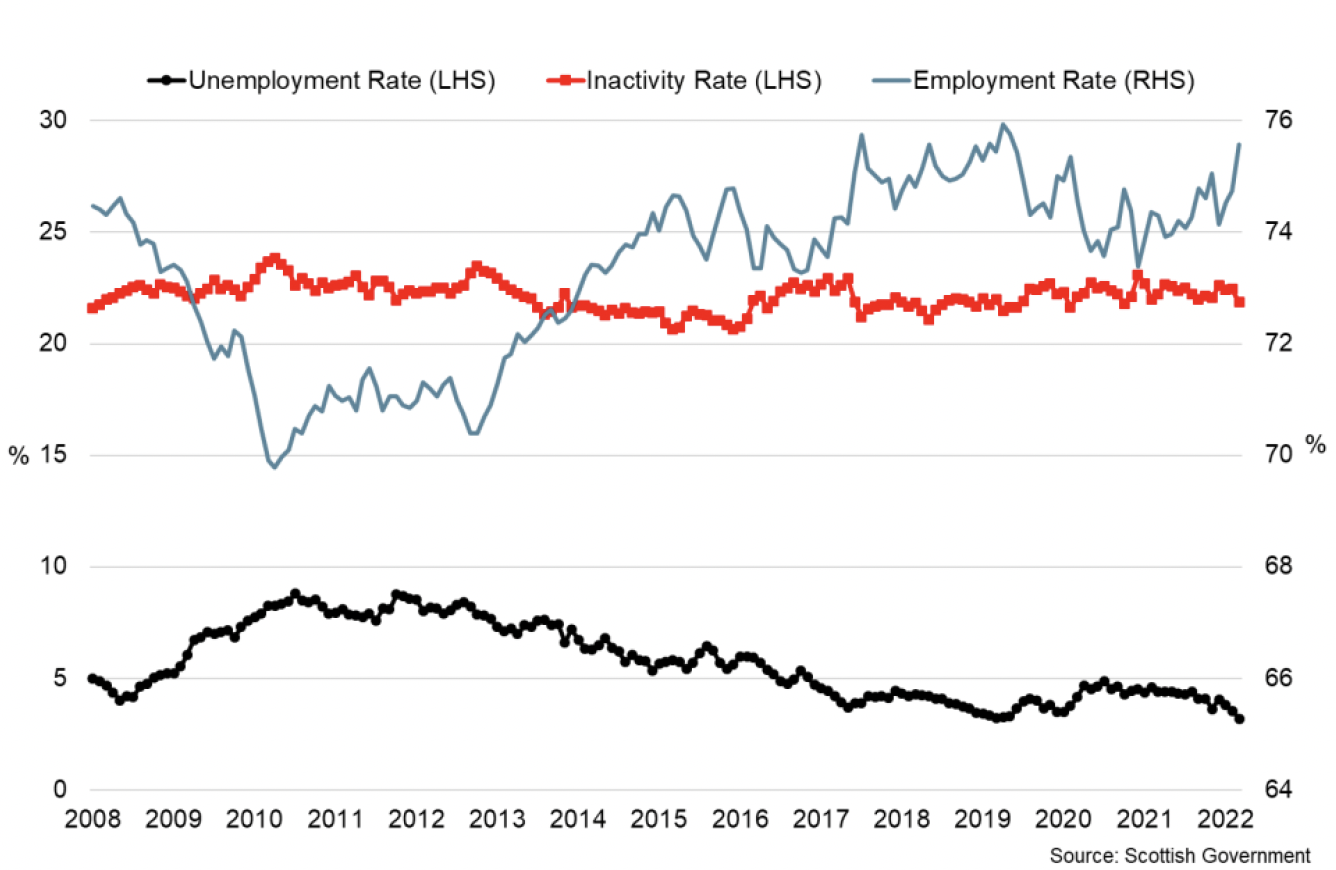
The latest labour market statistics for January to March 2022 in Scotland show there was 2.682 million people in employment (rate of 75.6%, up 1.3 percentage points over the year), 88,000 people unemployed (rate of 3.2%, down 1.2 percentage points over the year) and 749,000 people economically inactive (rate of 21.9%, down 0.3 percentage points). [20]
Wider labour market indicators showed signs of further strengthening in April. Pay As You Earn (PAYE) Real Time Information flash estimates indicate the number of payrolled employees in Scotland increased by 9,000 in April to 2.42 million.[21] Compared with the same month the year before, the number of employees had risen 4.0% and compares with a rise of 4.2% in the UK over the same period.
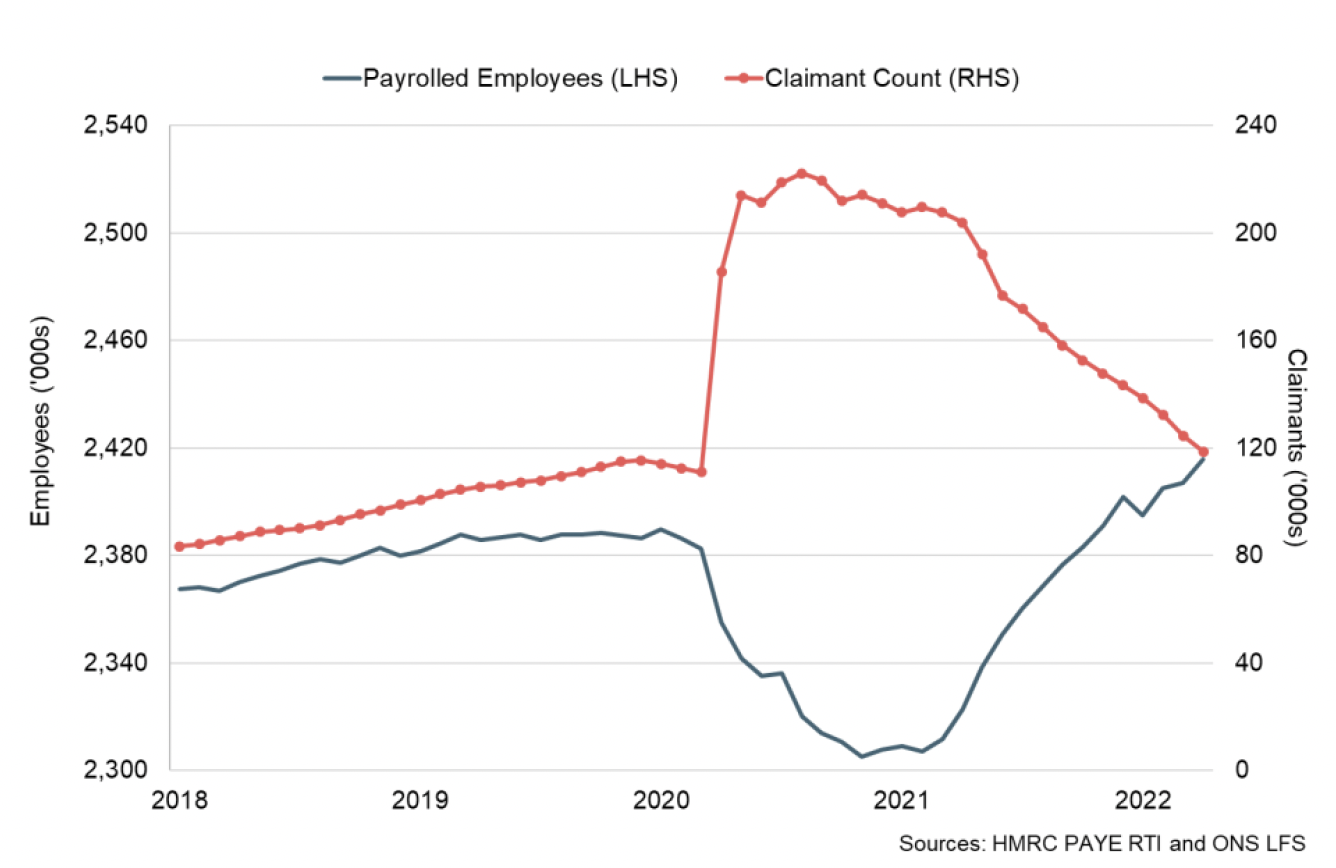
Scotland's Claimant Count (the number of claimants of Job Seekers Allowance and claimants of Universal Credit claiming principally for the reason of being unemployed) also continued its downward trend in April, down 4.8% (6,000) over the month to a claimant count rate of 3.9%. Overall, the claimant count has fallen 47% from its peak in August 2020 and 25% since September when the furlough scheme ended. However, it remains 5.5% higher than its pre-pandemic level in February 2020.[22]
Demand for staff
Business surveys have also signalled that labour market tightness has persisted into the start of the second quarter of 2022 with strong demand and declining availability placing upward pressures on pay. The latest Report on Jobs signalled that overall demand for staff (vacancies) continued to grow in April (76.3, up from 73.4 in March) with demand for both permanent and temporary staff increasing over the month.[23]
Supply side challenges in the labour market have also continued with candidate availability (labour supply) continuing to fall and the rate of decline the sharpest of 2022.
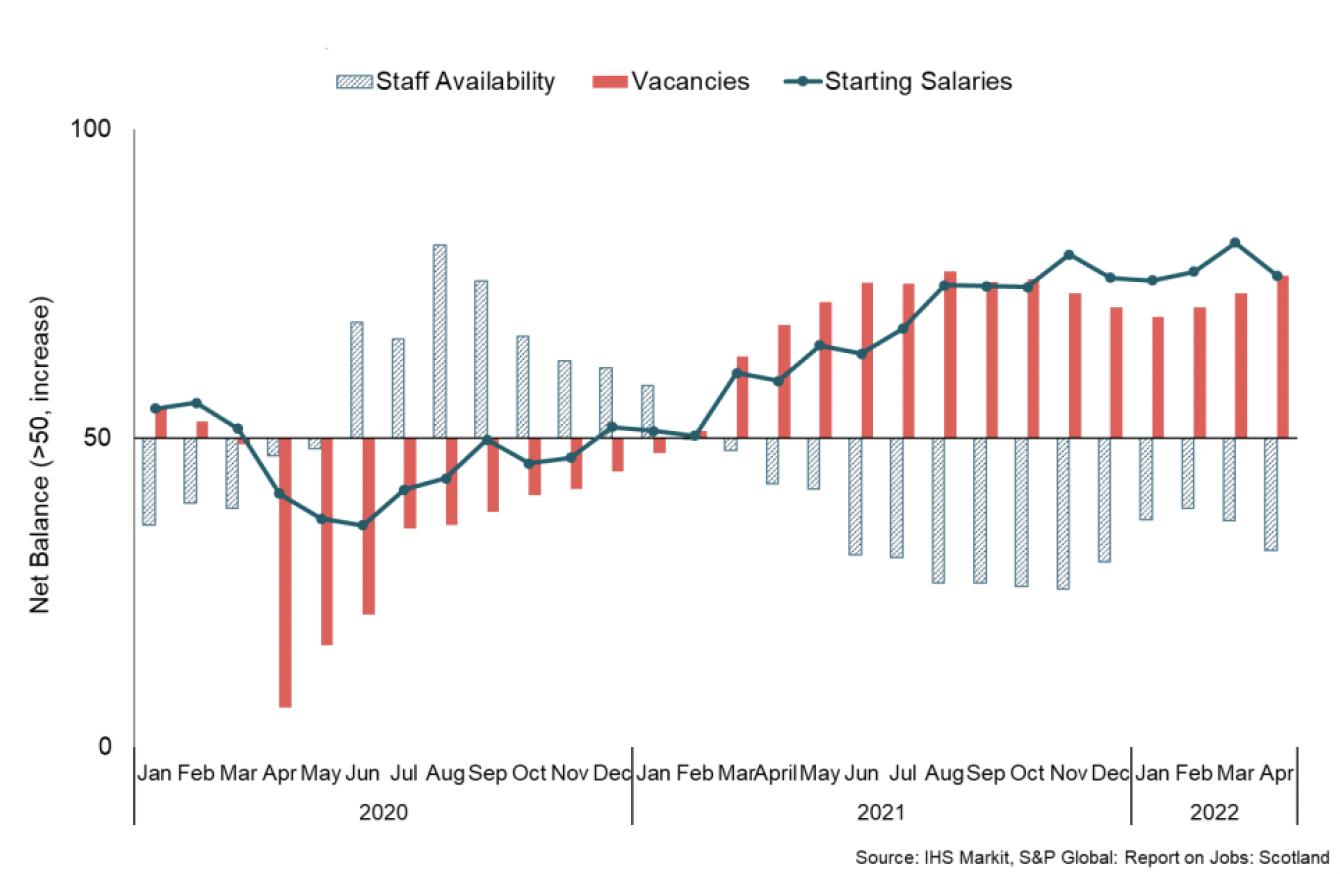
Adzuna online vacancies data also signal that strong demand for staff continued at the beginning of May, with online job vacancies 44.1% higher than in February 2020.[24] The strength in demand for staff, coupled with low unemployment, falls in candidate availability and anecdotal evidence of challenges in recruiting the necessary staff, meant upward pressure on rates of pay elevated in April, with both starting salaries and wages increasing rapidly.
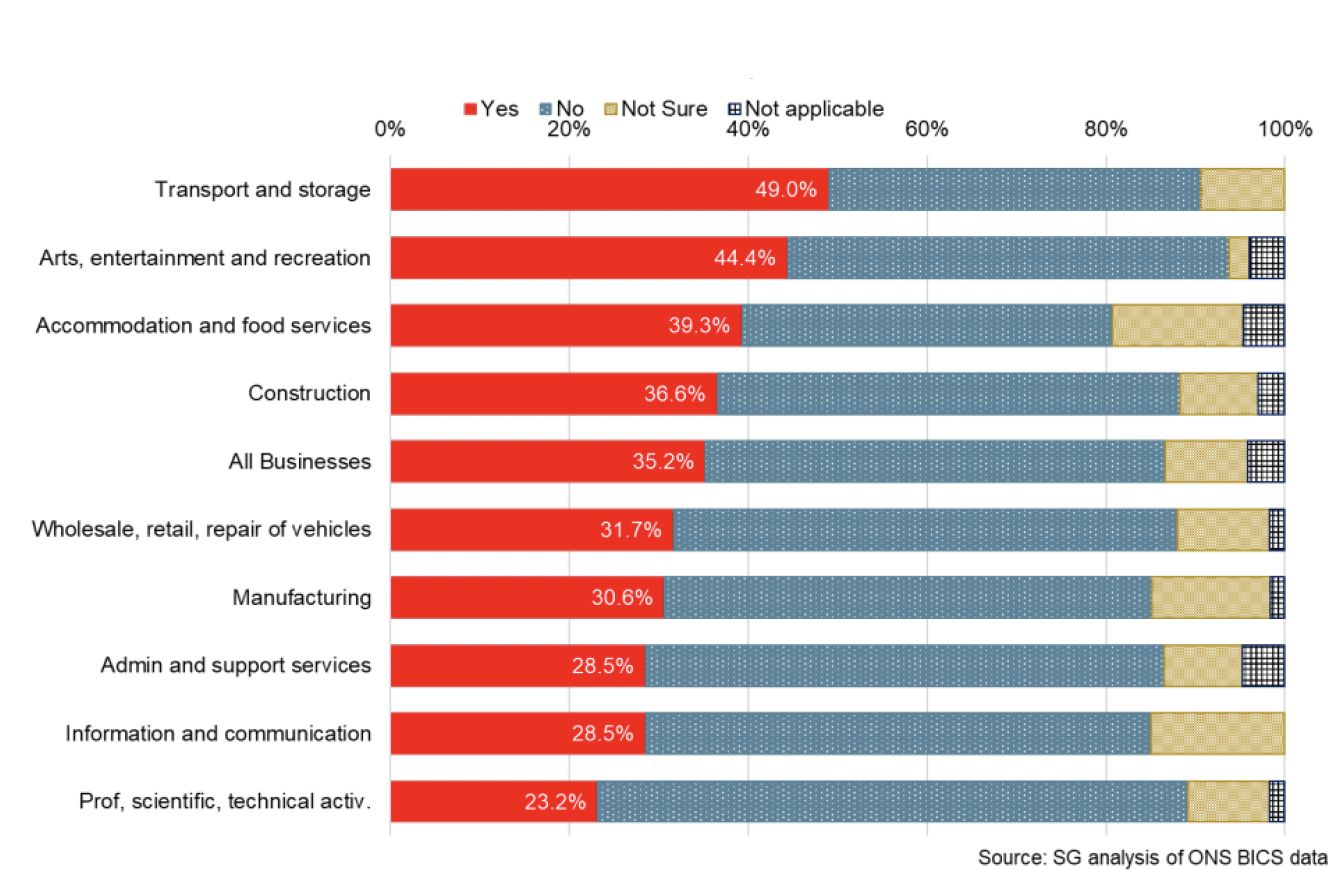
Labour shortages continue to affect a range of sectors with 35% off all businesses experiencing a shortage of workers in April. The overall share has remained broadly stable since the start of the year and remains most notable in transport and storage (49%), arts, entertainment and recreation (44%), and accommodation and food services (39%).[25]
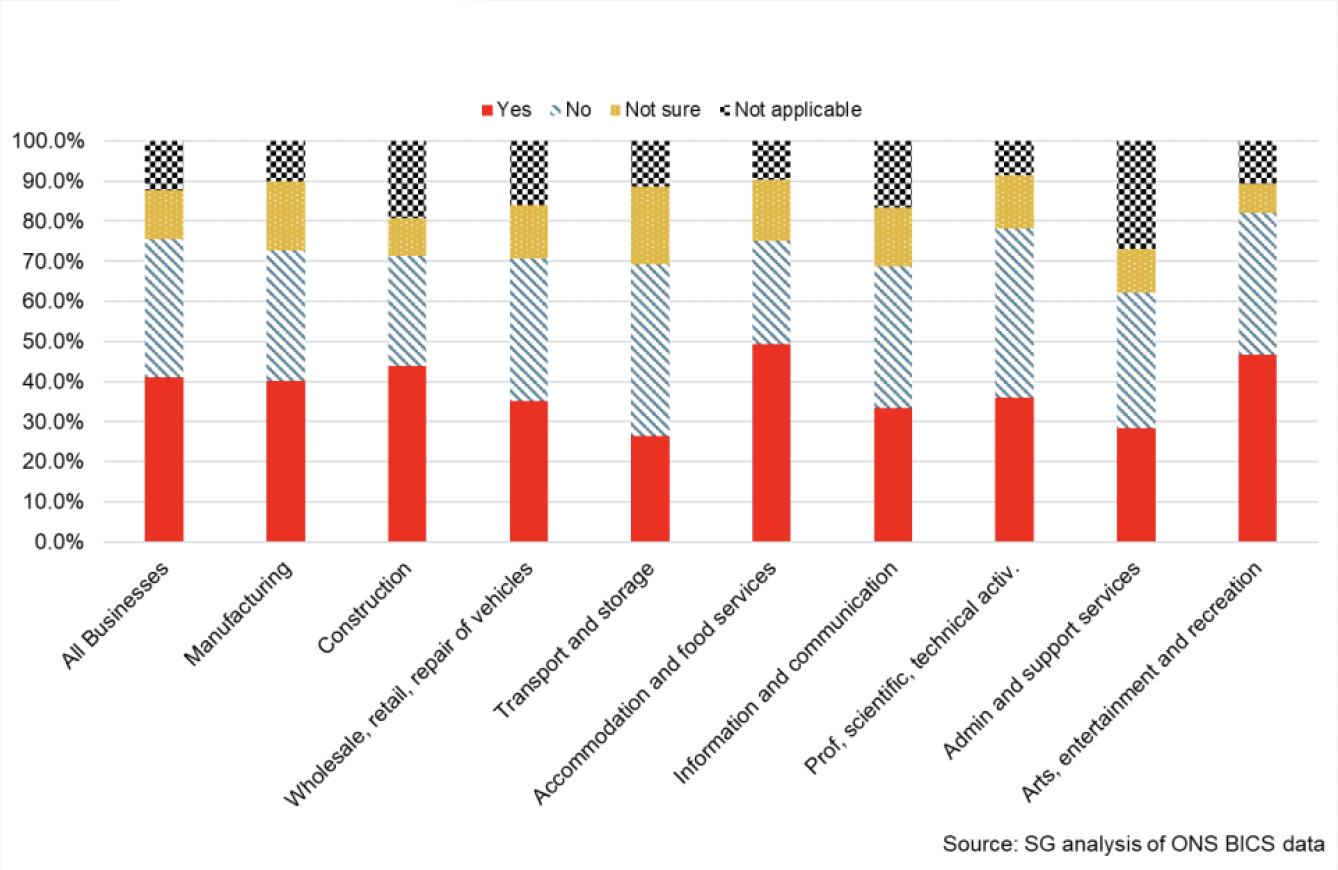
Similarly, 41% of all businesses in March, reported difficulties in their ability to recruit employees. The share has remained broadly stable since the beginning of the year, however, is down from 47% in October, while the share of businesses reporting that they did not have difficulties in recruiting employees was 34%, (up from with 22% in October).[26]
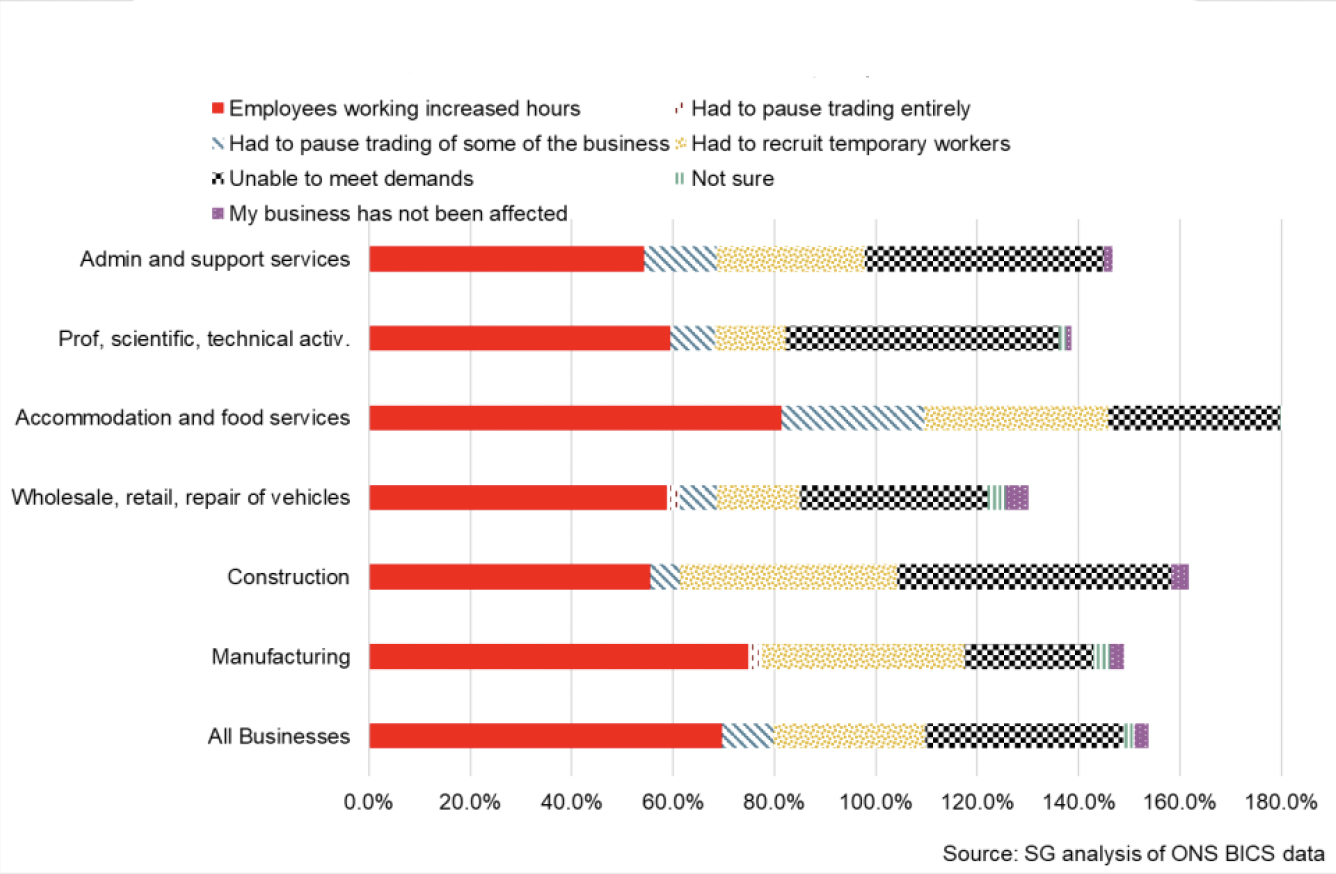
Furthermore, there is some evidence that worker shortages is impacting business trading ability. Of those experiencing staffing shortages, 10% reported having to pause trading some of the business, 39% were unable to meet business demands and 70% reported that existing employees had to work increased hours. Additionally there is sectoral variation with 28% of those in the Accommodation and Food services sector that have a shortage of workers reporting that they have had to pause trading some of the business, compared to 6% in the construction sector.
Earnings
Mean PAYE monthly pay growth has continued to stabilise at the start of 2022 following significant volatility during the pandemic when mean pay initially fell sharply, strengthened over the course of 2020 and rebounded back above its pre-pandemic level in August 2020.[27],[28]
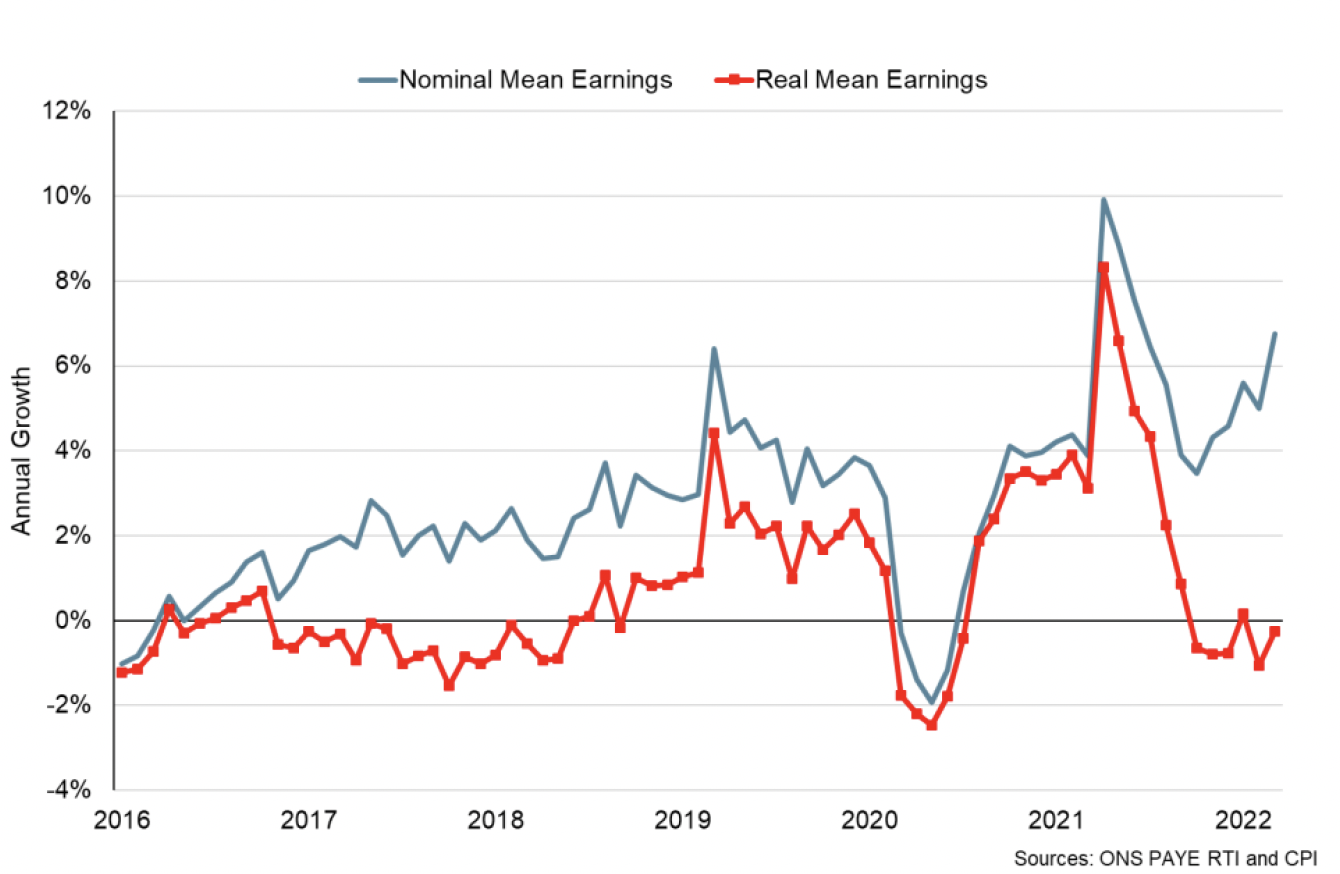
Latest data show mean monthly pay grew 1.0% over the month in March, 6.8% annually to £2,606 (UK: £2,890). Despite, the relatively high rate of pay growth, the CPI annual inflation rate was 7.0% in March and is weighing notably on real earnings growth.
Consumption
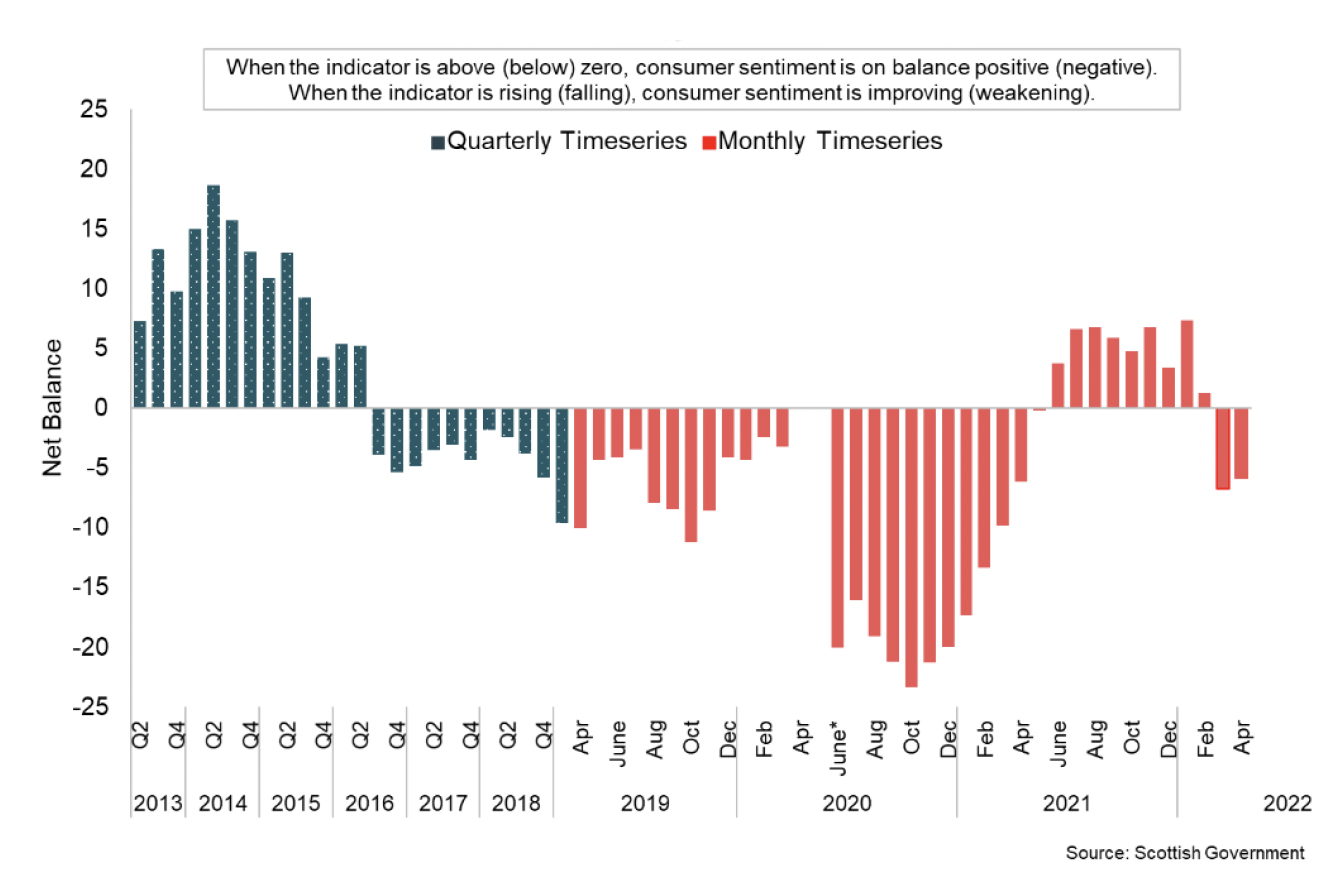
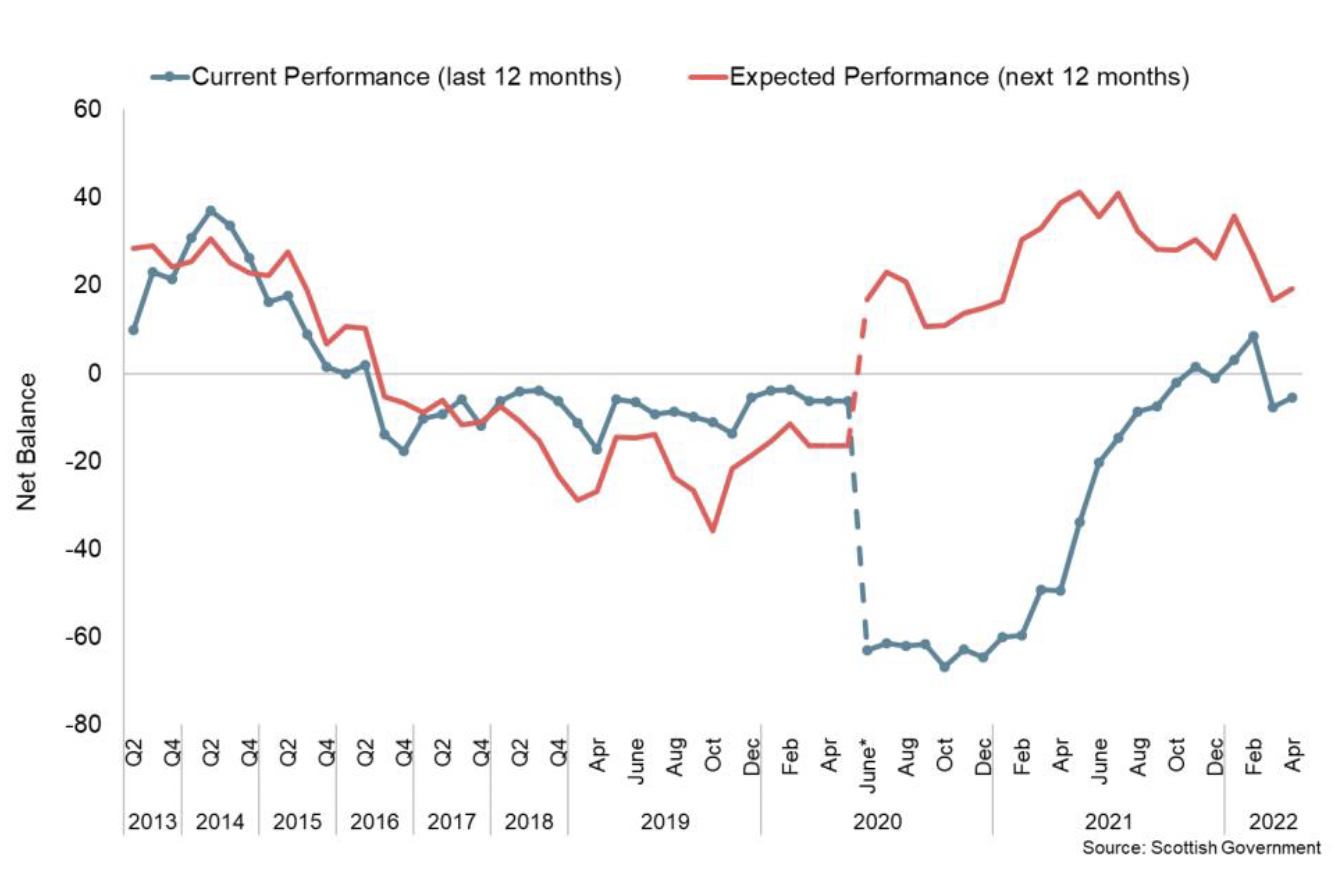
Consumer sentiment declined significantly in March and April driven by weakening across the current and expectations indicators.
Consumer sentiment indicators continue to be highly sensitive to the rapidly changing economic environment during the pandemic and the rise in inflationary pressures.
The ongoing economic and financial challenges that are being faced by households have instensified over the first quarter of 2022 and the composite index has fallen, likely as a result of the rapidly increasing cost of living, which presents as a new consumer shock.
Latest data for April showed consumer sentiment strengthened slightly in April having fallen sharply in March, however remained negative on balance (-5.9, up from -6.8 in March).[29],[30]
On the economy, respondent's on balance consider current economic circumstances to be worse than last year (-5.6), however sentiment was marginally more positive than in March (up from -7.8). Looking ahead, respondents expect the economy to impove over the coming year relative to the current situation (+19.4), although the level of optimism has been on a downward trend since July 2021 as the economy has continued to rebalance.
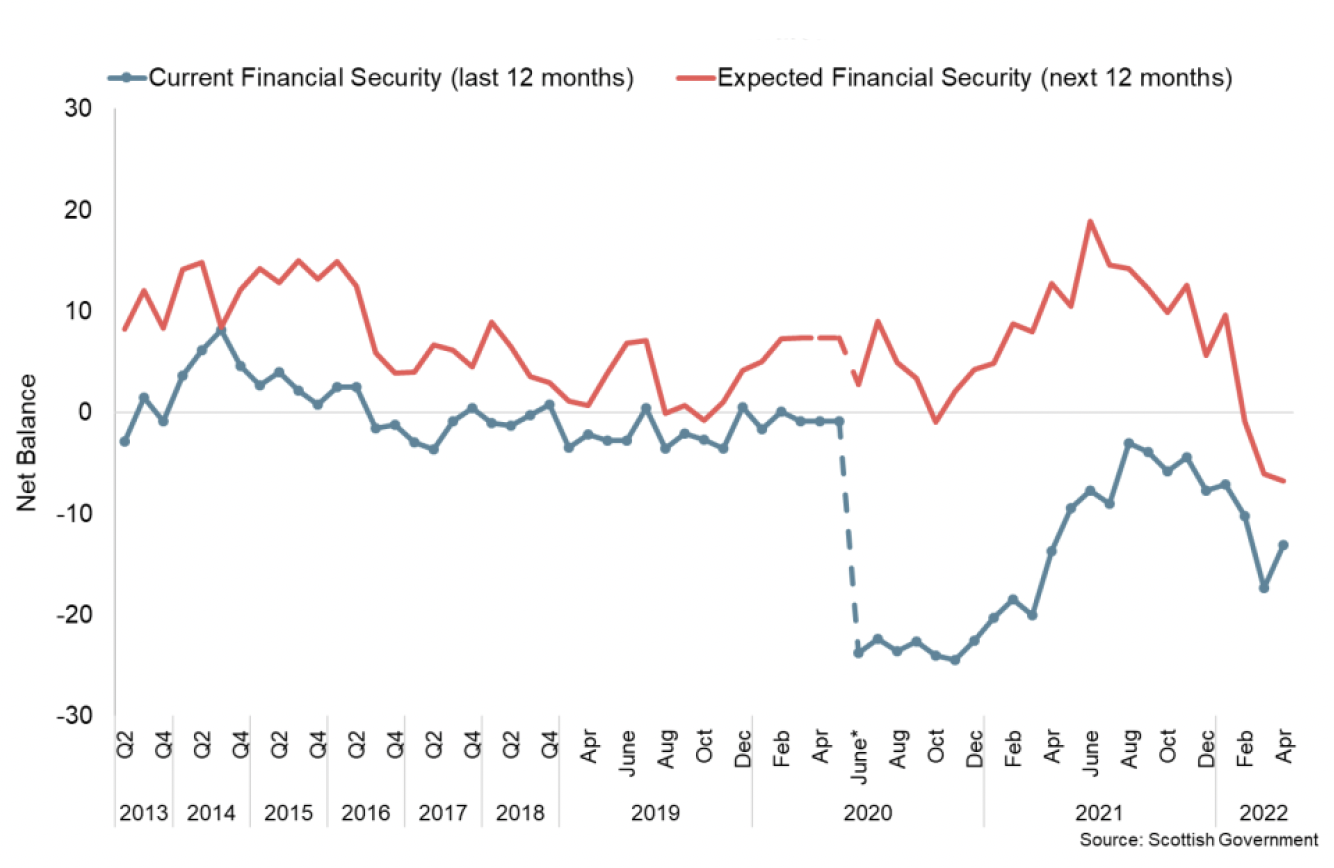
In terms of households personal finances, respondents on balance continued to report that their household finances are less secure than 12 months ago (-13.0). The indicator strengthened over the month, however remained notably weaker than in the second half of 2021. Looking ahead, sentiment towards expected finances have wekeaned significantly (-6.7), down from -6.0 in March and +9.7 in January signalling that the uncertainty asscoiated with the rising cost of living is weighing on sentiment.
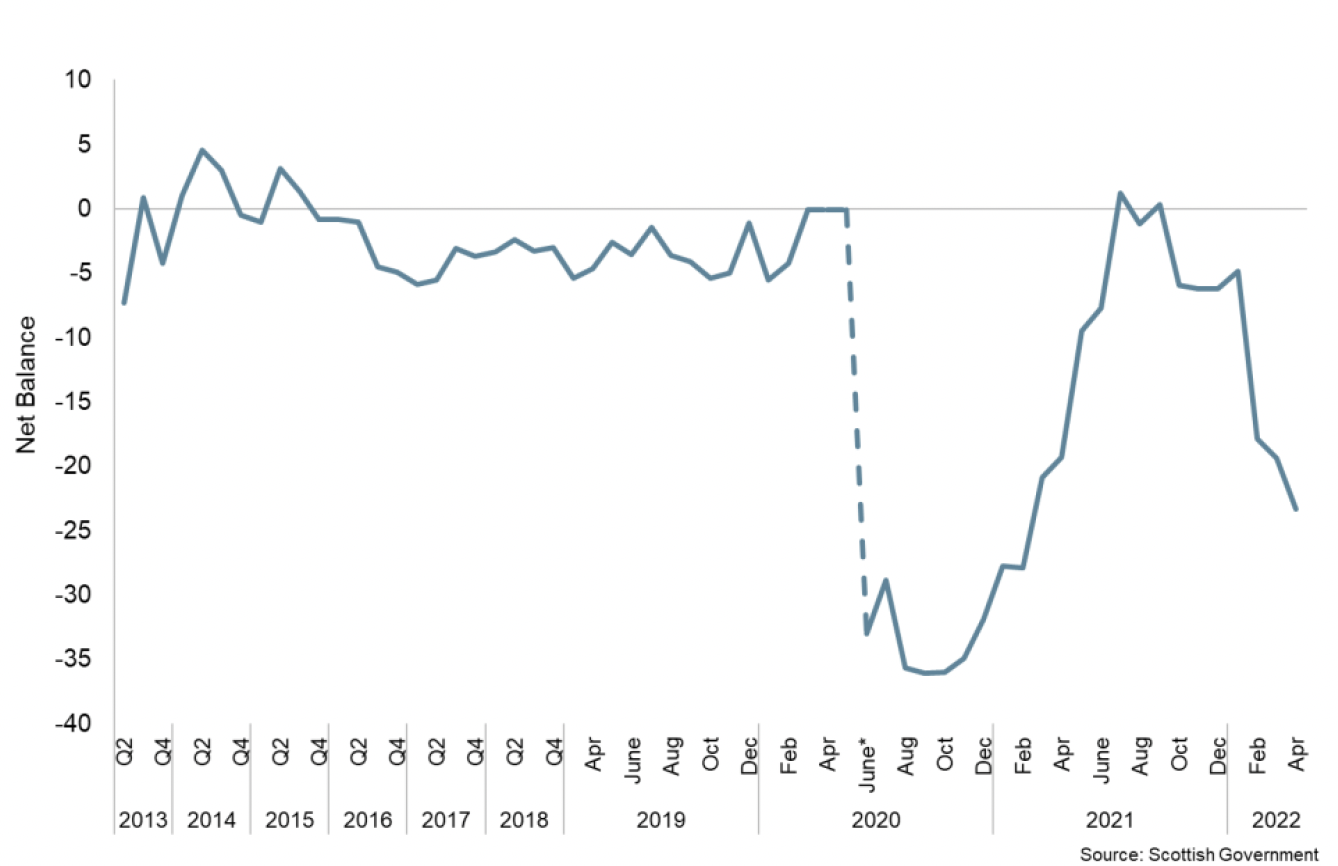
Both the outlook for the economy and household finances influence how relaxed households are about spending money. Since the beginning of the year, households have been increasingly uneasy about spending money as inflationary and cost of living pressures have increased, with the indicator falling to -23.3 in April, down from -19.4 in March.
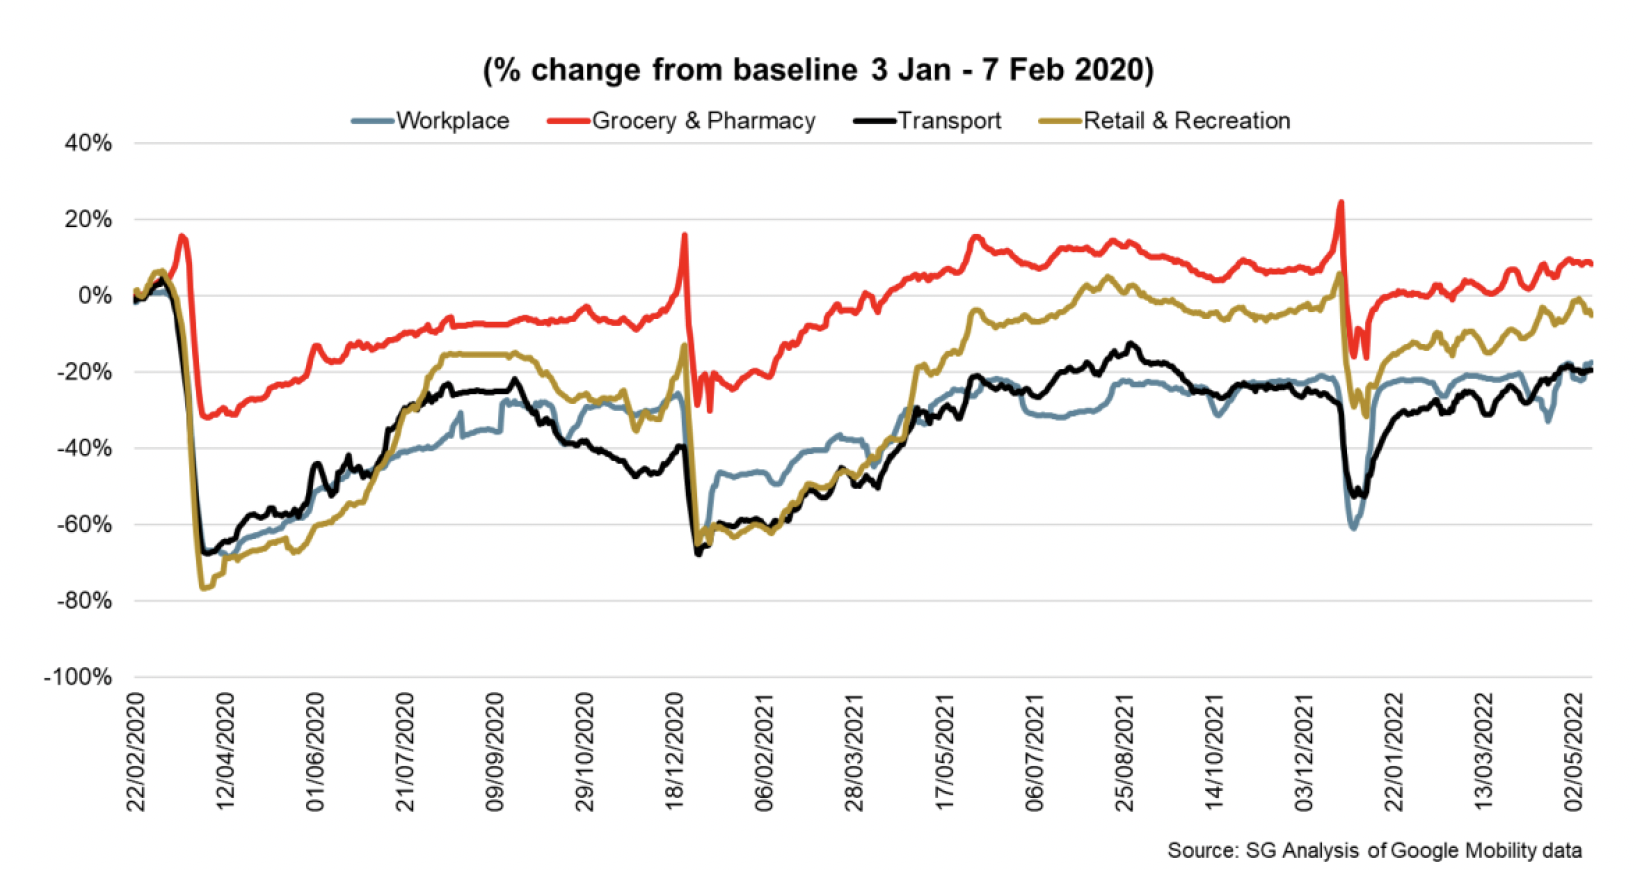
Google Mobility data indicates that movement around retail and recreation hubs is continuing to recover from the sharp fall in January during the Omicron wave and holiday period. Having fallen 30% below pre-pandemic levels in January, movement around retail and recreation hubs has recovered in May to around 2.5% below pre-pandemic levels. Looking across the economy, visits to workplaces remain 20% below, transport 20% below and grocery and pharmacy 9% above pre-pandemic levels. [31]
Retail sales volumes in Great Britain fell 1.4% in March, following a fall of 0.5% in February though sales volumes remain 2.2% above their pre-pandemic level. The largest contribution to the fall came from non-store retailing which fell 7.9% over the month.[32] Food stores sales fell 1.1% in March likely due to the relaxed restrictions on the hospitality sector, as well as the impact of rising food prices on the cost of living. Non-food stores sales rose by 1.3% over the month driven by an increase in other non-food stores (2.9%) and household goods stores (2.6%) such as DIY stores.
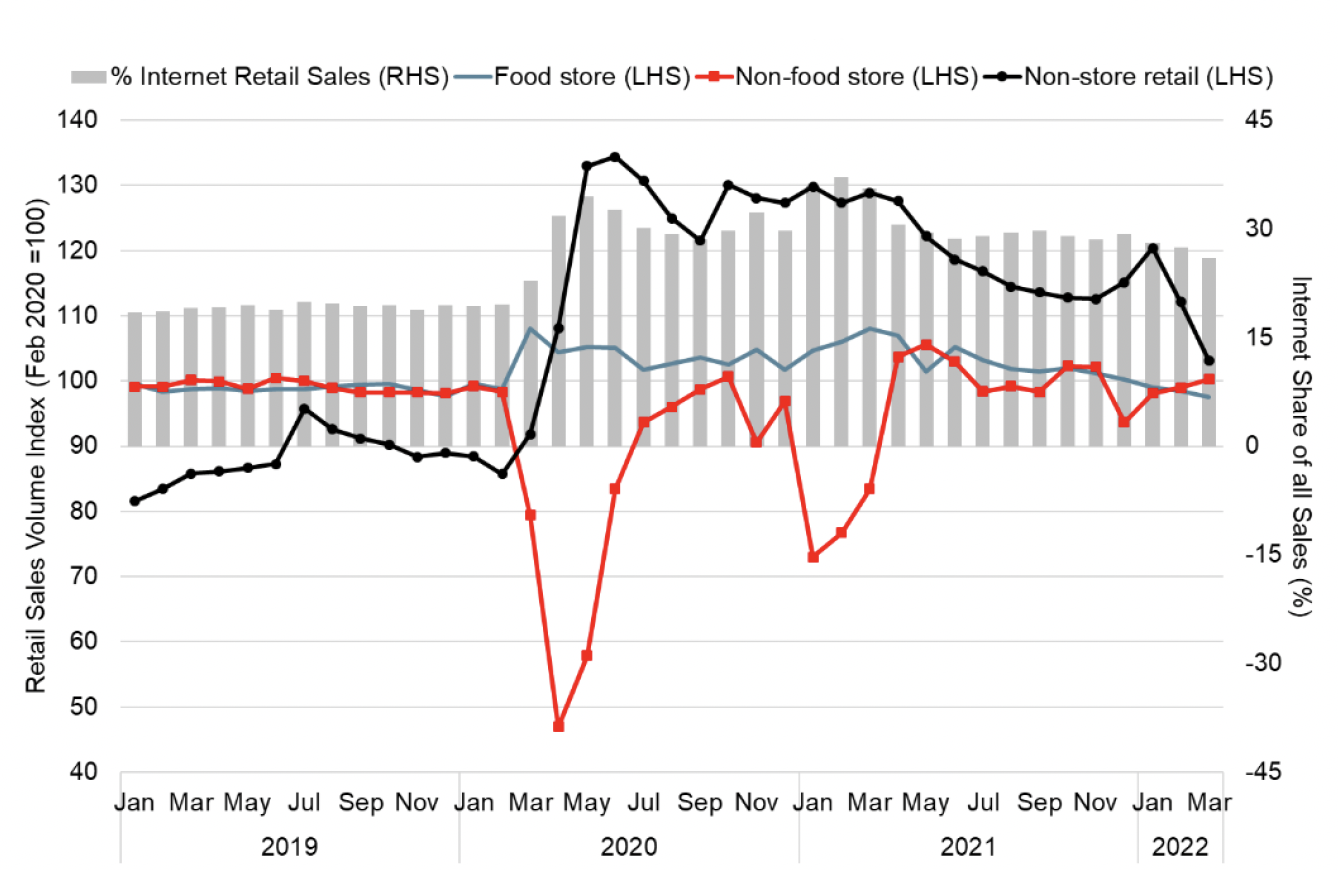
Automotive fuel sales fell by 3.8% in March with some evidence that consumers reduced non-essential travel amidst record high petrol and diesel prices. Online retail as a proportion of all retail sales, fell to 26.0% (down from 27.5% in February). This continues the wider downward trend since its peak in February 2021 (37.1%) though remains higher than in February 2020 prior to the pandemic (20%).
Household Savings and Consumer Credit
At an aggregate level, households increased their levels of savings during the pandemic and reduced net credit levels, due to a reduction in expenditure coupled with a rise in disposable income through the retention of earnings. More recently, saving patterns have returned to levels similar to prior to the pandemic while credit consumption has increased, particularly in the latter half of 2021 and early 2022.
Bank of England data provides insights at an aggregate level of how savings and consumer credit flows have evolved as restrictions have been removed and economic activity has recovered alongside a rise in inflationary pressures.
In recent months, at an aggregate level, net flows from UK households into deposit-like accounts have returned to a broadly similar position as they were prior to the pandemic. In March, net inflows increased slightly to £6.0 billion, up from £5.1 billion in February and is slightly higher than pre-pandemic flows which averaged £5.5 billion in the year to February 2020. [33]
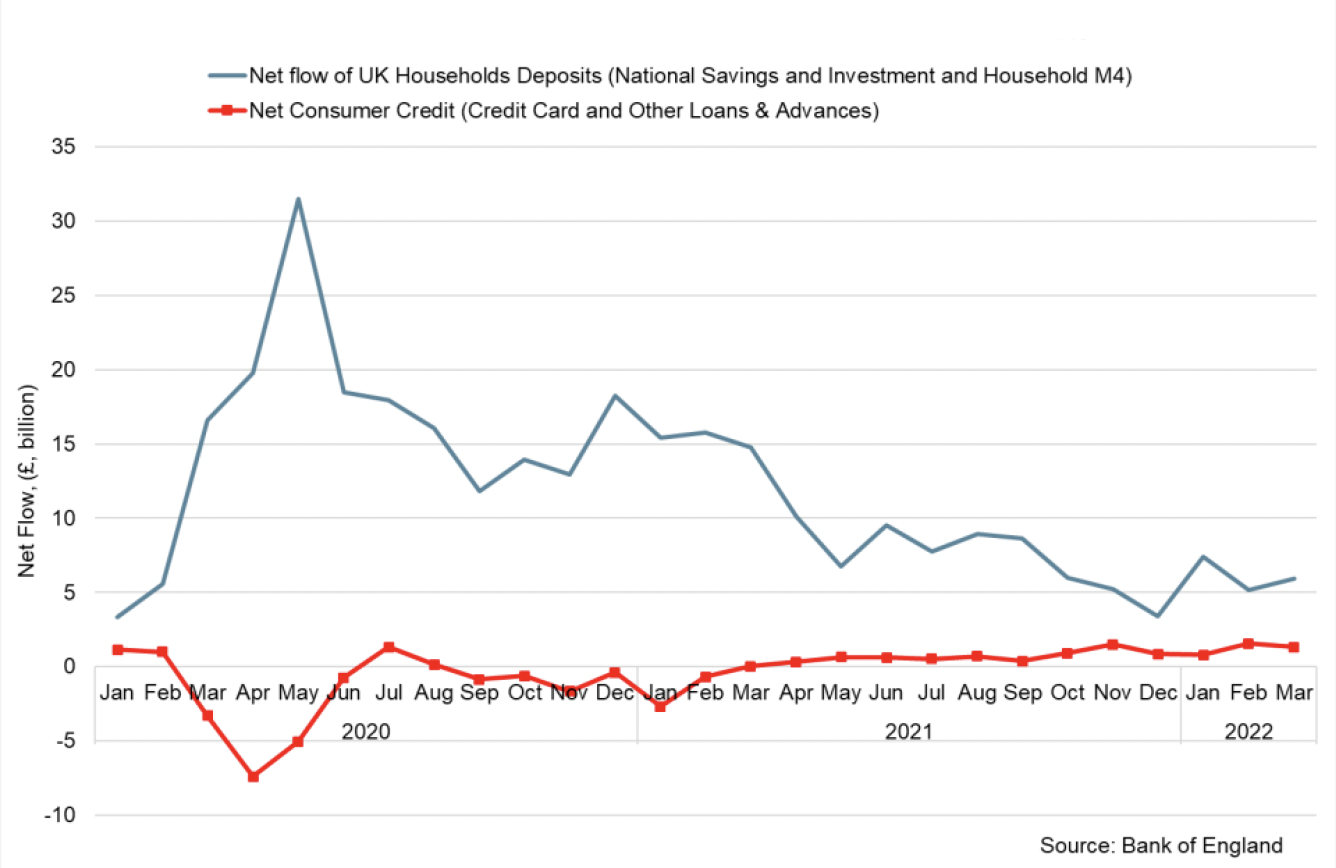
Alongside this, net consumer credit fell significantly during the pandemic, however started to grow again over the course of 2021. In March, consumers' net borrowing picked up to £1.3 billion, down from £1.6 billion in February. The additional borrowing in March was split between £0.8 billion on credit cards, and £0.5 billion through other forms of consumer credit (such as car dealership finance and personal loans).
Inflation
UK CPI inflation rose to 9.0% in April 2022, up from 7.0% in February and has risen to its highest rate in the historical constructed series which began in January 1989, presenting increased cost of living challenges.[34] Inflation rates have also continued to rise in the US (8.3%) and in the Eurozone (7.5%), in part reflecting rising global food and energy prices over the past year.
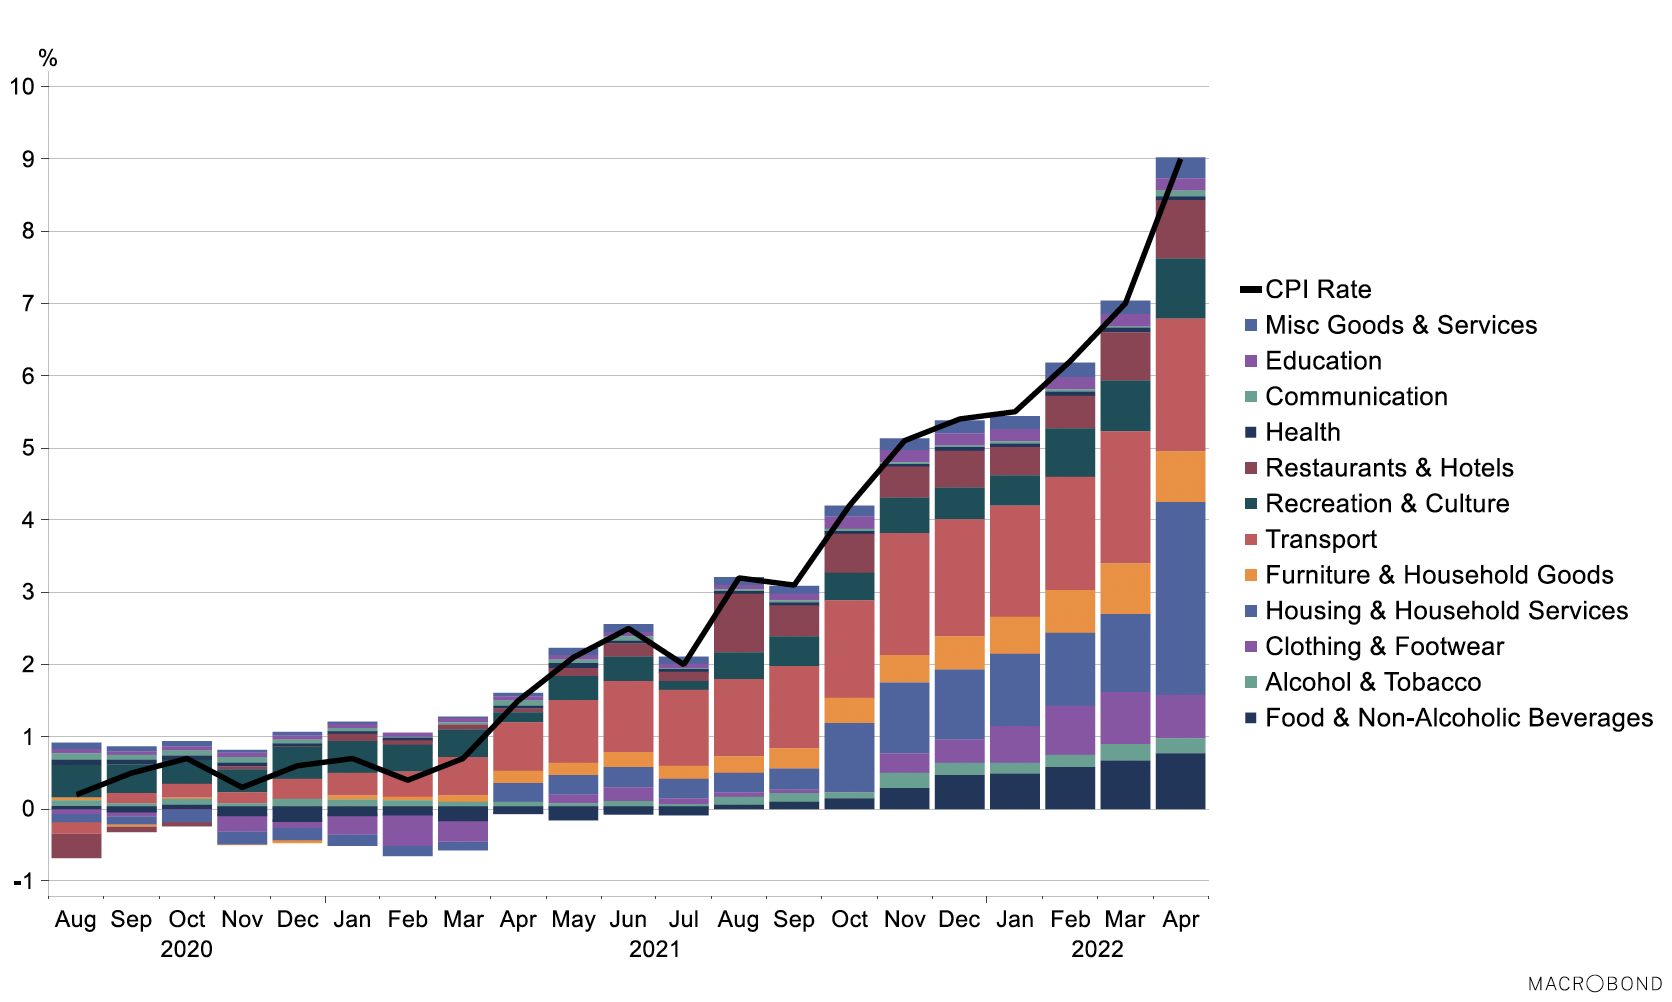
In April, UK consumer prices rose over the year across almost all goods and services monitored. Most notably there was large increases in electricity and fuel prices (+69.6%), in transport (+13.5%, partially driven by second-hand car price increases +27%, but also in motor fuels +31.4%), furniture (10.5%) and in clothing and footwear (+8.3%).
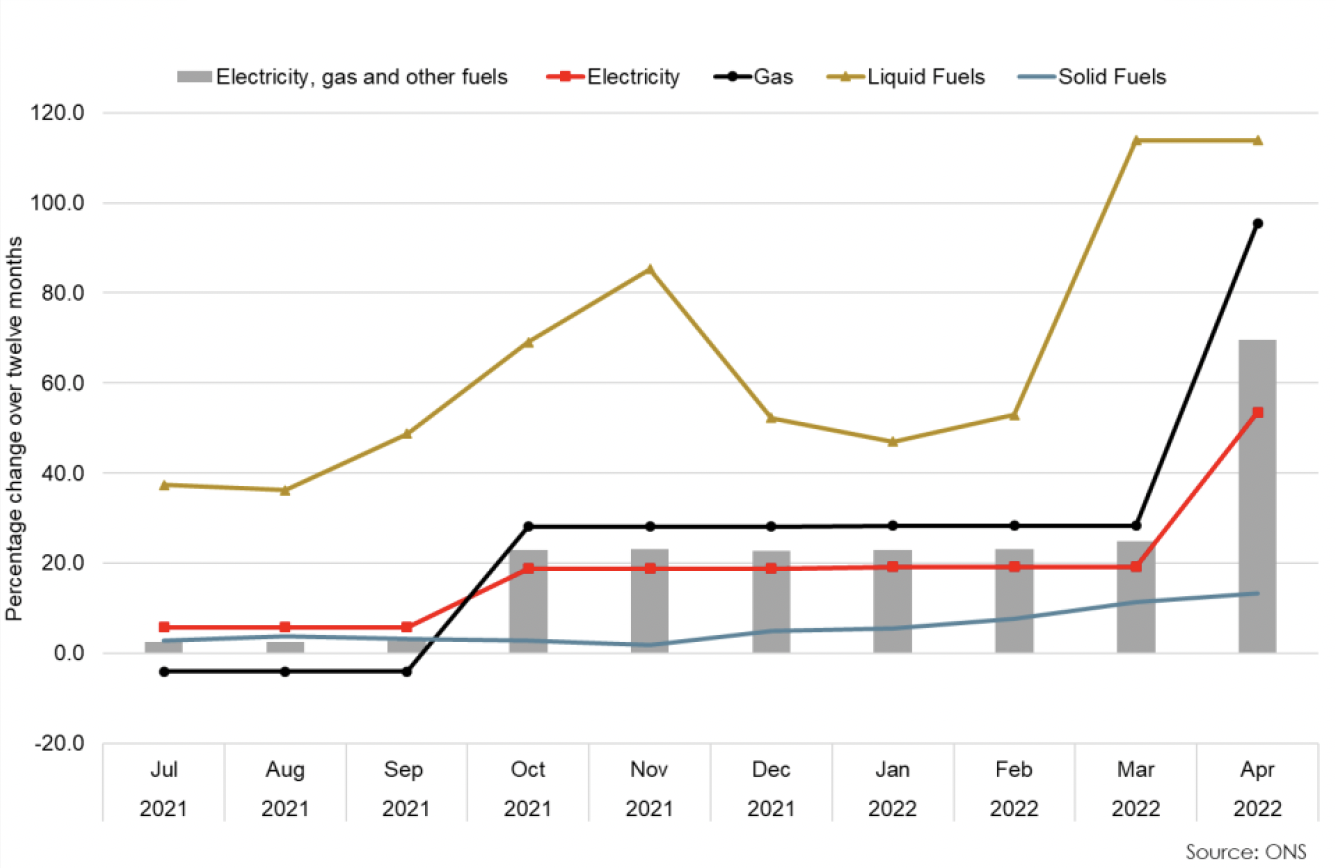
The CPI figure in April accounts for the Ofgem energy price cap uplift which resulted in 12-month inflation rates of 53.5% for electricity and 95.5% for gas, compared with rates of 19.2% and 28.3% respectively in the previous month.
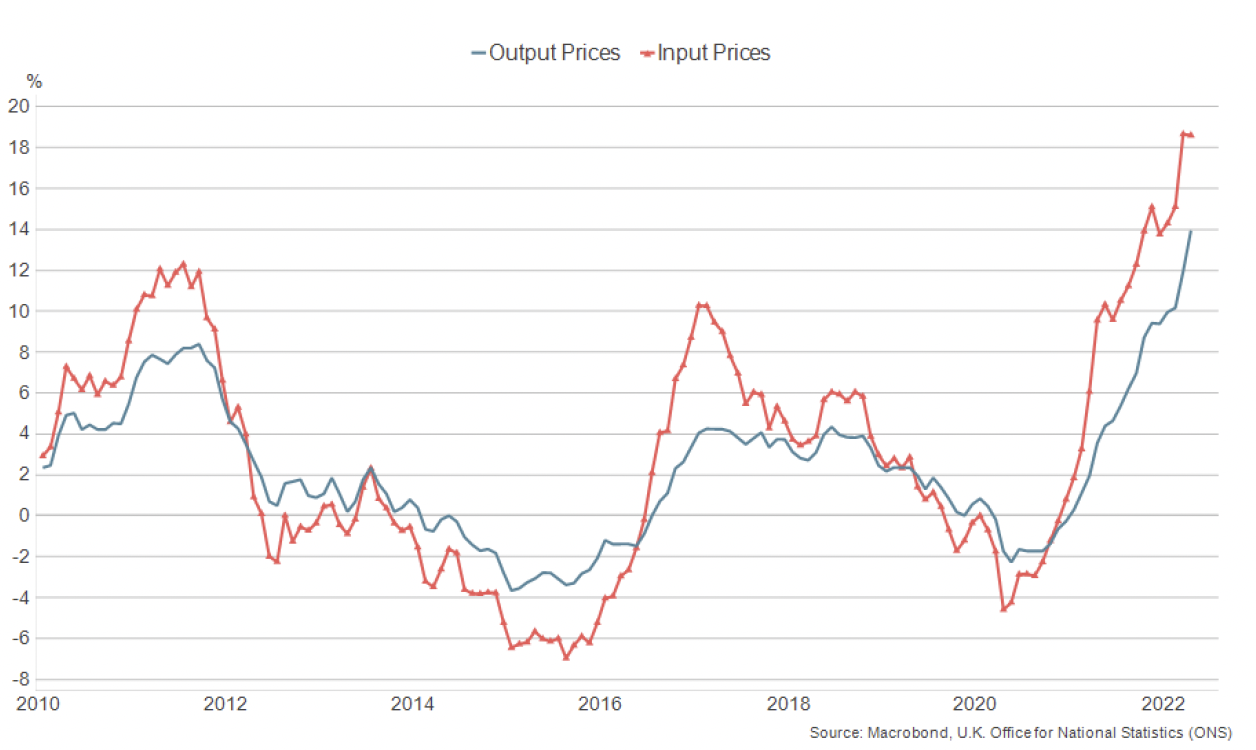
Further inflationary pressures are expected, exacerbated by the situation in Ukraine and the impact on global commodity prices, with the Bank of England forecasting inflation to rise to over 10% in the second half of 2022, intensifying cost of living challenges.[35] This is expected to impact through a rise in energy prices and the pass through of higher producer costs to consumers. Producer price inflation (changes in the prices of goods bought and sold by UK manufacturers, including price indices of materials and fuels purchased and factory gate prices) has risen over the past year and remained elevated in April with input price inflation at 18.6% in (unchanged from March and at the highest rate since records began) while output price inflation was 14.0% (up from 11.9% in March).[36]
In response to the further rise in underlying inflationary pressures for the year ahead, the Bank of England's Monetary Policy Committee (MPC) increased the Bank Rate by 0.25 percentage points to 1.0% in May, the fourth successive rate rise since December, and have signalled that further rate rises may be appropriate over 2022[37]
Cost of living challenges
Whilst the economy has recovered to be above pre-pandemic levels, the outlook has weakened notably since the end of 2021. The sharp rise in inflation, coupled with tightening fiscal and monetary policy, and exacerbated by the situation in Ukraine, is expected to weigh on household incomes and consumption, with official forecasters highlighting the largest fall in living standards on record.
UK inflation rose to 9.0% in April, its highest rate for 40 years, and has risen sharply over the past year from 1.5% in April 2021. Whilst the rise in inflation has been driven by an increase in fuel and energy costs, it has increasingly become broad based across goods and services.
Furthermore, inflation is forecast to rise further over the course of the year with the Bank of England forecasting inflation to rise to around 10% in the final quarter of 2022. This is expected to be largely driven by further rises in energy and fuel costs and to a lesser extent rises in the prices of food and tradeable goods.
The sharp rise in inflation has meant that inflation has generally been outpacing nominal earnings in Scotland since October 2021 (with the exception of January 2022). This means that living standards have already begun to fall, and they will be further squeezed by reductions in disposable income caused by net tax increases starting in April. In their forecasts alongside the Chancellor's Spring Statement in March, the Office for Budget Responsibility forecast real household disposable income per person to fall by 2.2% in 2022‑23, its largest single year fall since records began in 1956-57.
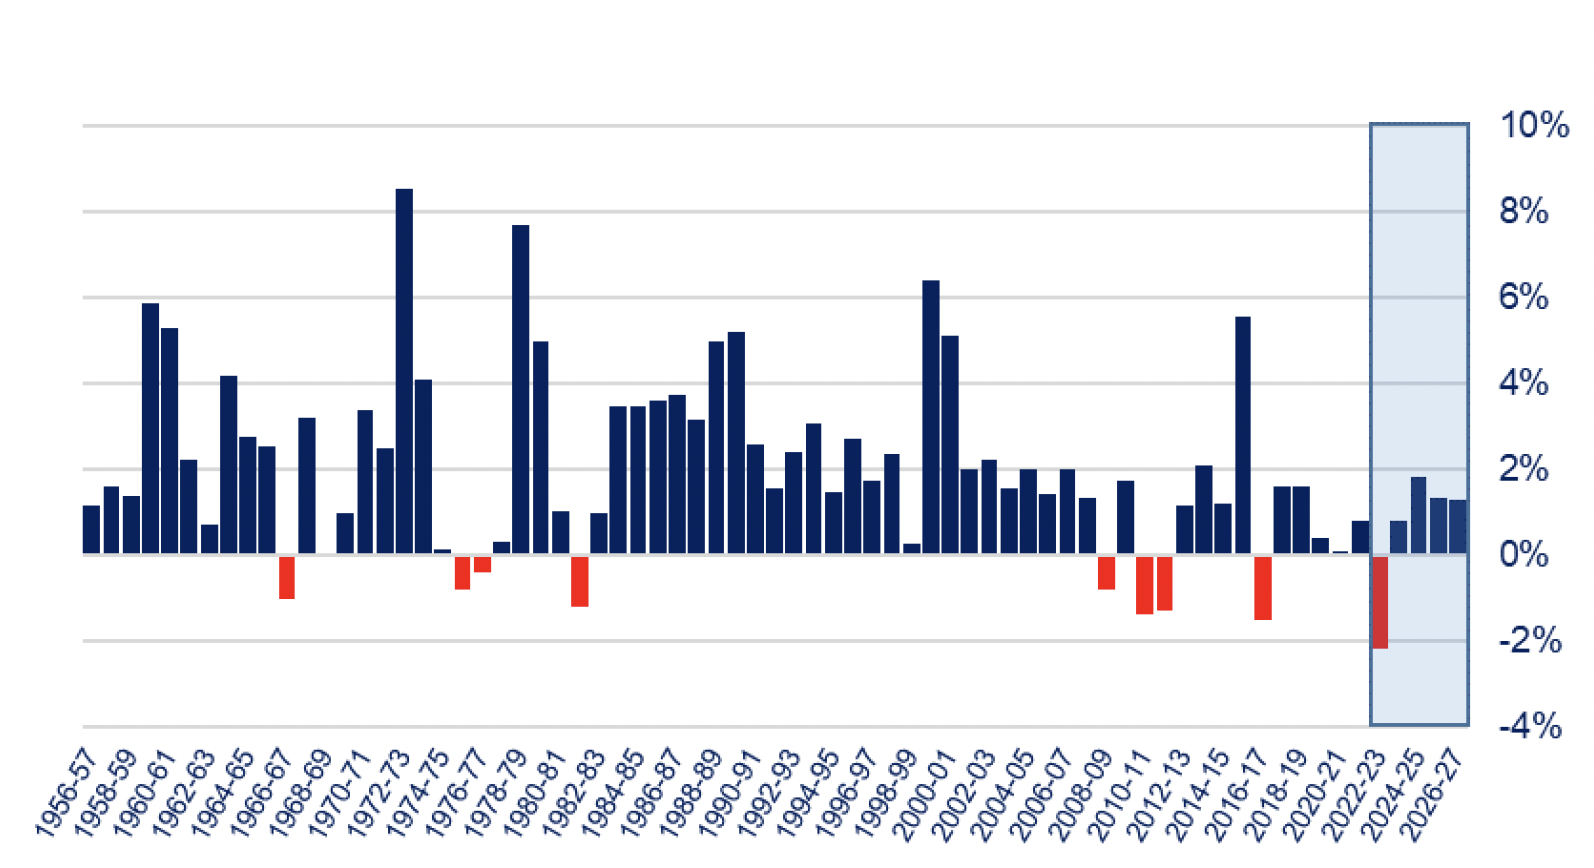
Chart source: OBR
More recently, the National Institute of Economic and Social Research (NIESR) has analysed the impact of rising prices and taxes on household incomes across the UK. Households across the UK are likely to face food and energy bills greater than their disposable income in 2022-23.
Scottish households are particularly at risk, in part due to the colder climate in Scotland which means they are more likely to spend more on heating than other parts of the UK. As gross disposable income in Scotland is below the UK average, NIESR estimate that households in Scotland could be disproportionately impacted by the rise in energy and food prices. They estimate that 150,000 Scottish households (6.1%) could face food and energy bills higher than their disposable incomes in 2022-23, compared to 5.1% for the UK as a whole.
Contact
Email: OCEABusiness@gov.scot