Secondary school-aged pupils in Scotland - mental wellbeing, relationships and social media: report
This report outlines findings from a survey of 1,361 pupils from 50 secondary local authority schools in Scotland. The pupils completed the survey between 8th February and 2nd April 2021, and responded to questions about their mental wellbeing, relationships and social media use.
4. Findings by demographic characteristics
This section presents findings from comparisons of the responses from pupils with different demographic characteristics. The findings are presented in turn for the following demographic characteristics:
- Gender identity: female, male
- School year[10]: S1, S2, S3, S4, S5, S6
- Physical or mental health condition: yes, no
- Urban or rural: urban, rural
- SIMD quintile: SIMD1 (most deprived), SIMD2, SIMD3, SIMD4, SIMD5 (least deprived)
- Caring responsibilities: yes, no
Please note that only statistically significant[11] findings are reported in this section.
Gender identity
Overall, compared with male pupils, female pupils reported lower mental wellbeing and more often feeling lonely, and were less likely to report feeling optimistic. Female pupils were also less likely than male pupils to report having family members with whom they could talk about their problems, and were more likely to meet the threshold for problematic social media use, and to report that social media made them feel closer to their friends.
More detailed findings regarding differences between female and male pupils are presented below:
- Mental wellbeing. Female pupils reported lower mean mental wellbeing than male pupils (WEMWBS scores of 42.7 and 48.0, respectively). For female pupils, their mean score is within a suggested range that indicates possible depression (i.e., 41-44). Similarly, the Lockdown Lowdown survey [6] found that female respondents were less likely to report feeling good about their mental wellbeing than male respondents. Before the pandemic, female pupils were also found to have lower WEMWBS scores than male pupils in HBSC in 2018 [4], and the SALSUS surveys in 2015 and 2018 [3], although these differences were either not statistically significant (HBSC) or the statistical significance was not reported (SALSUS). In further analyses of YPIS, the pattern of female pupils reporting lower mental wellbeing than male pupils was observed in each school year included in this study (S1 to S6).
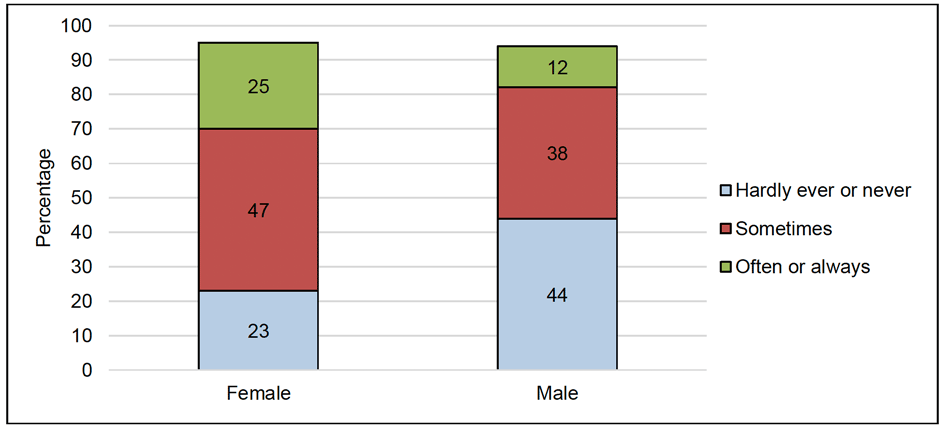
- Loneliness. Female pupils reported feeling lonely more often than male pupils. 72% of female pupils indicated 'Sometimes' or 'Often or always' feeling lonely compared with 50% of male pupils (see Figure 7).
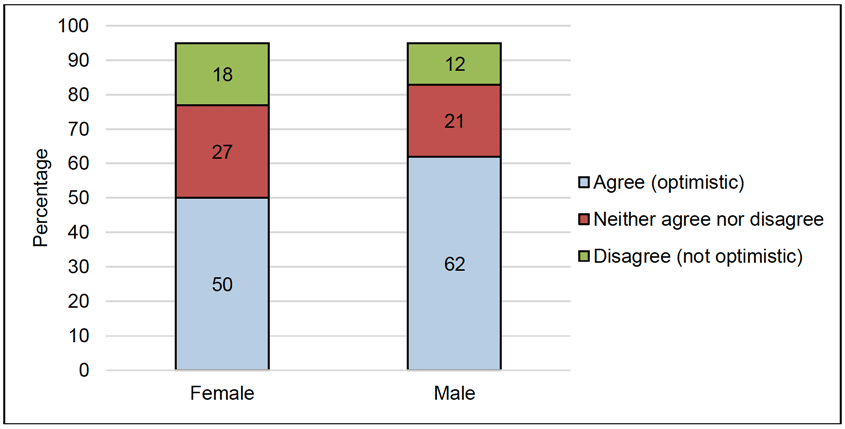
- Optimism. Female pupils were less likely to agree with the statement 'Even if I am having a difficult time, I feel like I will be OK' than male pupils – 50% of females agreed compared with 62% of males (see Figure 8).
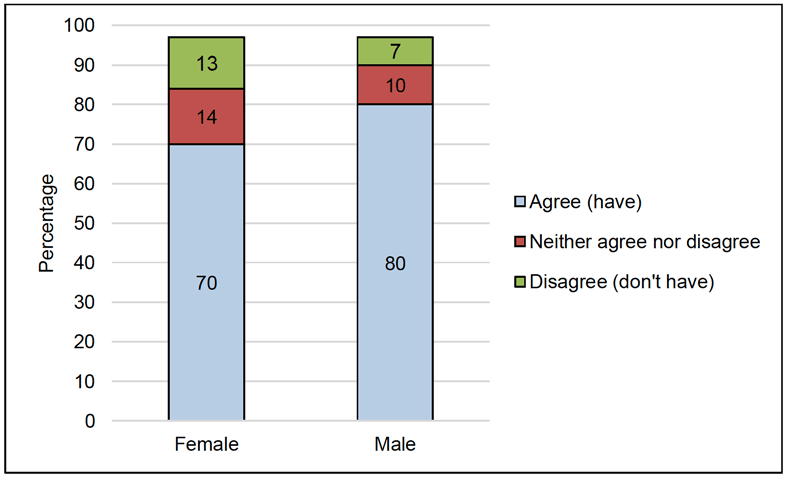
- Family to talk to about problems. Fewer female than male pupils reported having family members with whom they could talk about their problems (70% and 80%, respectively; see Figure 9). Relatedly, female respondents in the Lockdown Lowdown survey [6] were less likely to report having a good relationship with their family than male respondents. Regarding mental wellbeing, pupils who were 'very' or 'fairly' likely to talk to their family were found to report higher mental wellbeing in SALSUS [3]. This finding from SALSUS could therefore partly explain the lower mental wellbeing of female pupils found in YPIS, as they are also less likely to report having family to talk to.
- Problematic social media use. A smaller proportion of male pupils (7%) met the threshold for problematic social media use than female pupils (17%).
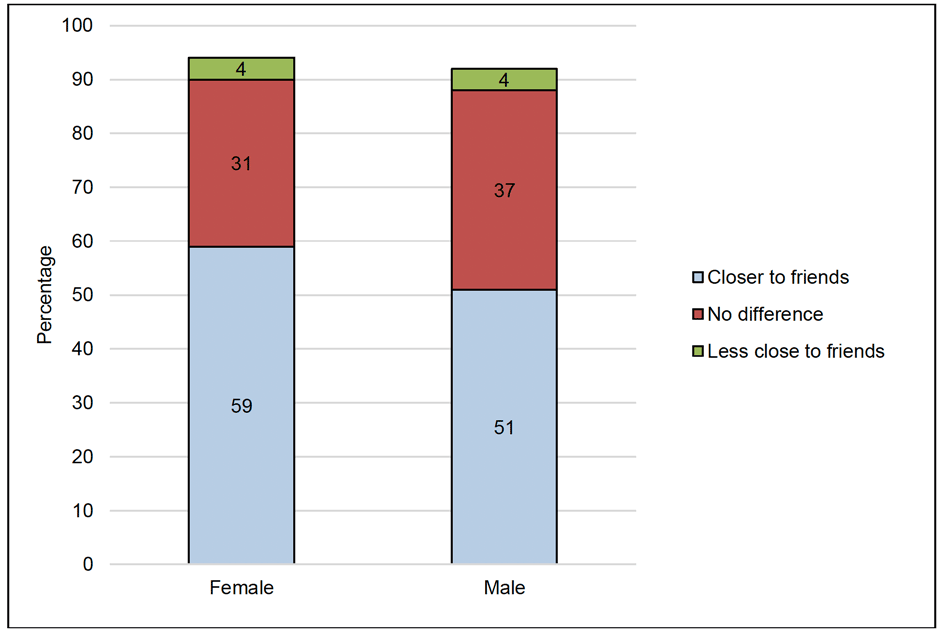
- Social media and closeness to friends. Female pupils were more likely than male pupils to report that social media made them feel closer to their friends (59% and 51%, respectively; see Figure 10).
School year
Overall, compared with younger pupils, older pupils reported experiencing poorer mental wellbeing and more often feeling lonely, and were less likely to report having family to talk to about their problems. The youngest pupils (S1) also reported having more sleep than pupils in the other school years.
More detailed findings are presented below:
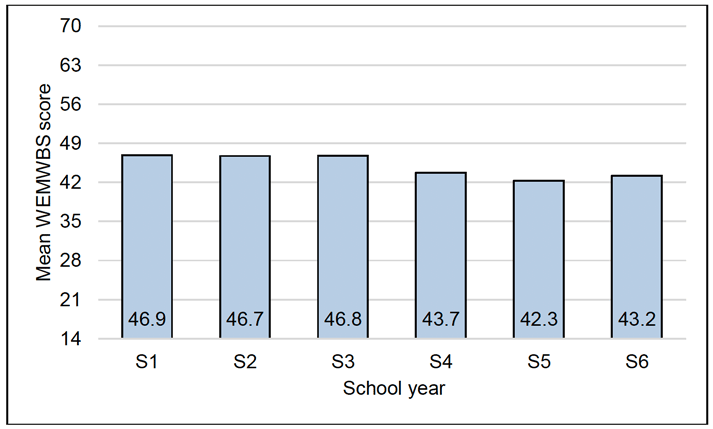
- Mental wellbeing. Older pupils reported lower mean mental wellbeing than younger pupils (WEMWBS scores of 42.3 and 43.2 for S5 and S6 pupils, respectively, and 46.9 and 46.7 respectively for S1 and S2 pupils; see Figure 11). Older pupils' mean scores were within a suggested range that indicates possible depression (i.e., 41-44). A similar pattern of results was reported in the Lockdown Lowdown survey [6], which found that older respondents were less likely to report feeling good about their mental wellbeing than younger respondents. Before the pandemic, older pupils also appeared to have lower WEMWBS scores than younger pupils in HBSC in 2018 [4], and the SALSUS surveys in 2015 and 2018 [3], although these differences were either not statistically significant (HBSC) or the statistical significance was not reported (SALSUS).
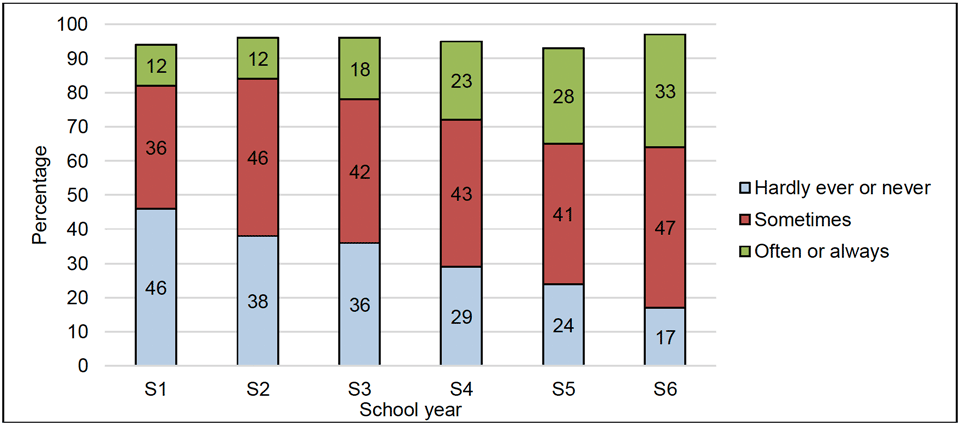
- Loneliness. Older pupils reported feeling lonely more often than younger pupils. 69% of S5 pupils and 79% of S6 pupils indicated 'Sometimes' or 'Often or always' feeling lonely compared with 48% of S1 pupils and 58% of S2 pupils (see Figure 12).
- Sleep (quantity). The amount of sleep pupils across school years S2 to S6 reported did not differ significantly, ranging from a mean of 7.0 to 7.6 hours of sleep the night before completing the survey. However, S1 pupils reported having more sleep, with a mean of 8.1 hours. While the surveys used different methods to estimate duration of sleep, HBSC [4] reported a similar pattern of results – i.e., younger pupils slept longer on weekday nights than older pupils.
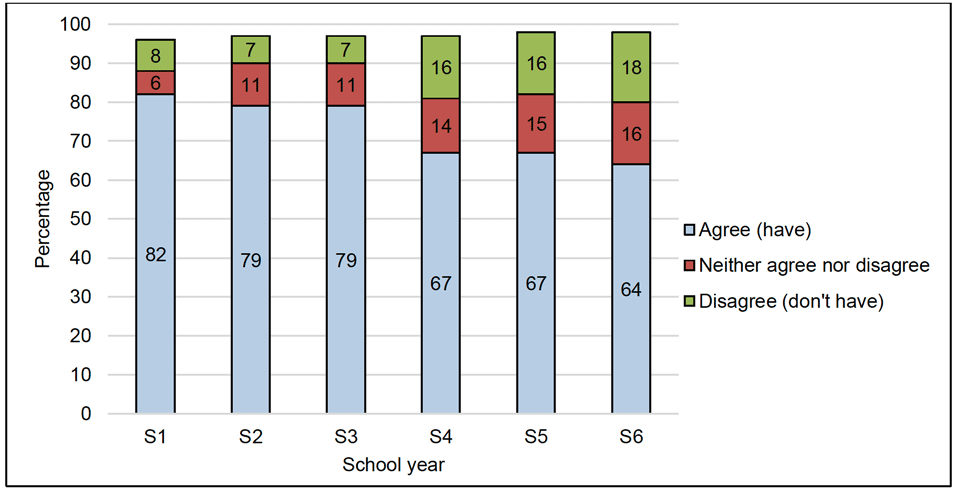
- Family to talk to about problems. Younger pupils were more likely to report having family members with whom they could talk about their problems (82% of S1 and 79% of S2 pupils, and 67% of S5 and 64% of S6 pupils, respectively; see Figure 13). Similarly, older respondents in the Lockdown Lowdown survey [6] were less likely to report having a good relationship with their family than younger respondents. A similar finding was found before the pandemic in the HBSC survey [4], which found that younger pupils found it easier to talk to their parents than older pupils. Additionally, SALSUS [3] found that having family to talk to is associated with higher mental wellbeing, which could partly explain why older pupils reported lower mental wellbeing in YPIS, as they were also less likely to report having family to talk to.
Physical or mental health condition
Overall, pupils with a physical or mental health condition, compared with those without, reported experiencing poorer mental wellbeing and more often feeling lonely, were less likely to report feeling optimistic, and reported getting less sleep. Pupils with a physical or mental health condition were also less likely to report having family with whom they talked about their problems, or enjoyed spending time.
More detailed findings are presented below:
- Mental wellbeing. Pupils with a physical or mental health condition reported lower mean mental wellbeing than pupils without such a condition (WEMWBS scores of 41.4 and 48.4, respectively). For pupils with a condition, their mean score is within a suggested range that indicates possible depression (i.e., 41-44). The Lockdown Lowdown survey [6], conducted during the pandemic in autumn 2020, supported the YPIS finding, as young people with long-term health conditions reported feeling less good about their mental wellbeing. A similar pattern of results was also found before the pandemic in the SALSUS survey in 2018 [3], as pupils with a physical or mental health condition had a lower WEMWBS mean score than those without such conditions.
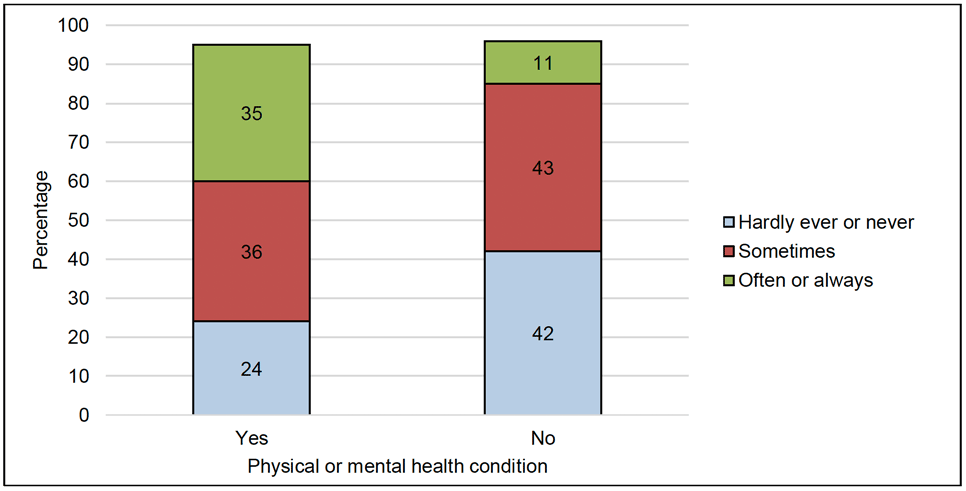
- Loneliness. Pupils with a physical or mental health condition reported feeling lonely more often than pupils without such a condition. 71% of pupils with a condition indicated 'Sometimes' or 'Often or always' feeling lonely compared with 54% of pupils without (see Figure 14). In the Lockdown Lowdown survey [6], young people with a long-term health condition were also more likely to report a negative impact of the pandemic on their feelings of loneliness than those without such a condition.
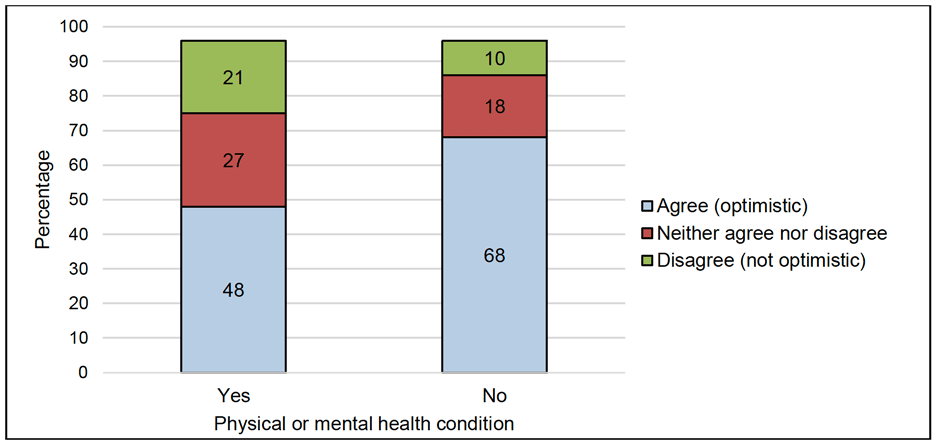
- Optimism. Pupils with a physical or mental health condition were less likely to agree with the statement 'Even if I am having a difficult time, I feel like I will be OK' than pupils without such a condition – 48% of pupils with a condition agreed compared with 68% of pupils without a condition (see Figure 15).
- Sleep (quantity). On average, pupils with a physical or mental health condition reported having significantly less sleep the night before completing the survey compared with pupils without such a condition (7.0 and 7.9 hours, respectively).
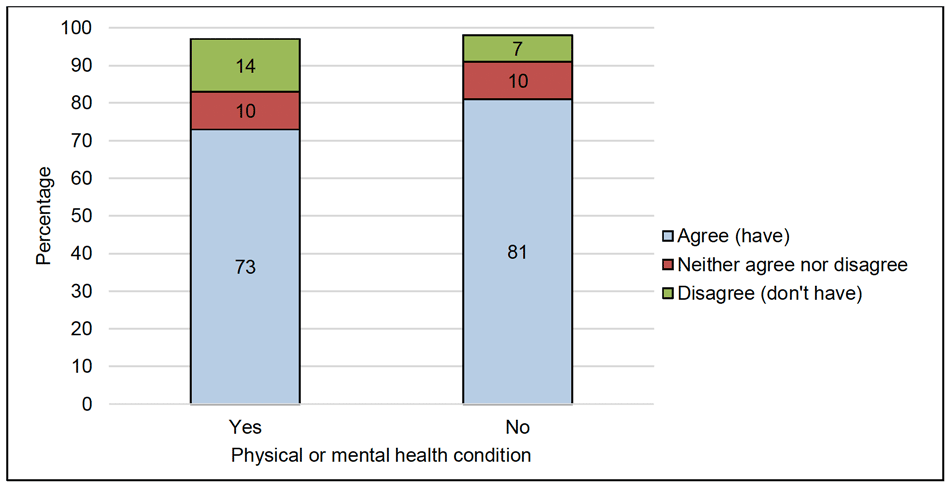
- Family to talk to about problems. Pupils with a physical or mental health condition were less likely to report having family members with whom they could talk about their problems than pupils with no such condition (73% and 81%, respectively; see Figure 16). In line with this finding, in the Lockdown Lowdown survey [6], young people with a long-term health condition were less likely to report having a good relationship with their family than those without such a condition. As discussed in relation to gender and age, the SALSUS [3] finding that having family to talk to is associated with higher mental wellbeing could partly explain why pupils with a health condition tend to report lower mental wellbeing than those without such a condition.
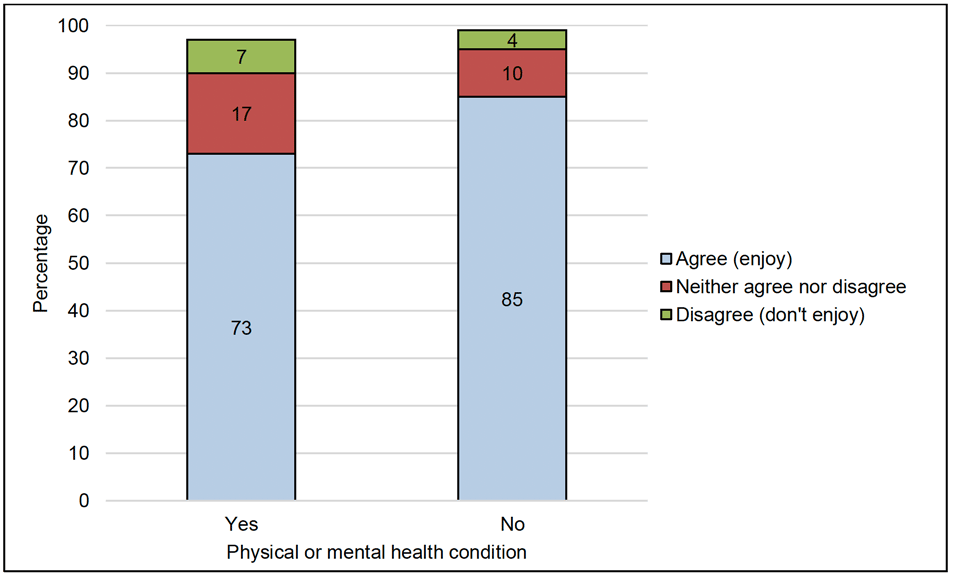
- Enjoyment of spending time with family. Pupils with a physical or mental health condition were less likely to report enjoy spending time with their family than pupils with no such condition (73% and 85%, respectively; see Figure 17).
Urban/Rural
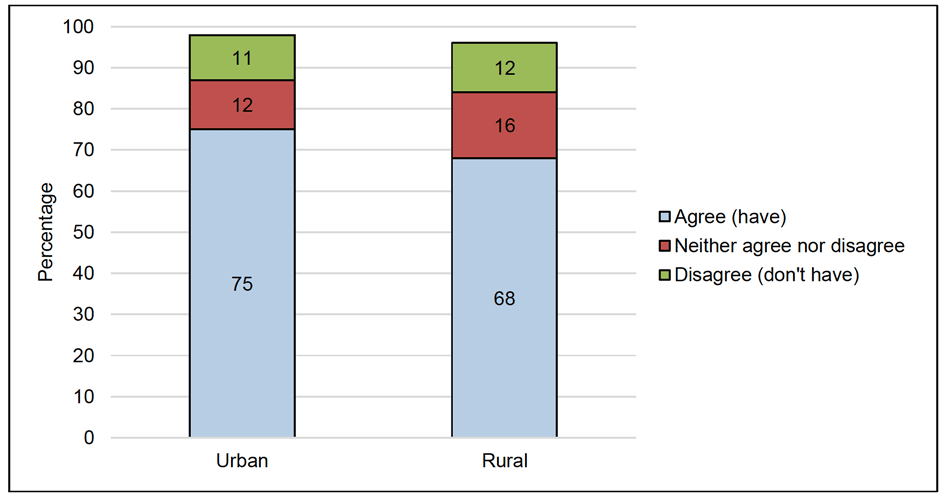
The only statistically significant difference found in the survey between pupils living in urban and rural settings was that pupils living in rural settings were less likely to report having friends with whom they could talk about their problems than pupils living in urban settings (68% and 75%, respectively; see Figure 18).
Scottish Index of Multiple Deprivation
No statistically significant differences were found between pupils across the different SIMD quintiles for any questions in the survey. Similarly, the Lockdown Lowdown survey [6] did not report any differences in the responses to questions about mental wellbeing and relationships for young people from different SIMD quintiles. In contrast, before the pandemic, the SALSUS survey [3] found that pupils from more deprived backgrounds reported lower mental wellbeing than pupils from less deprived backgrounds. In line with the SALSUS finding, the HBSC survey in 2018 [4], using a measure of family affluence rather than SIMD, also found that pupils from less affluent families reported lower mental wellbeing.
Caring responsibilities[12]
The only statistically significant difference found in the survey between pupils with and without caring responsibilities was that a larger proportion of pupils with caring responsibilities (27%) met the threshold used to identify problematic social media use than pupils without caring responsibilities (10%). In contrast, the Lockdown Lowdown survey [6] reported that, during the pandemic, young people with caring responsibilities were less likely to report having a good relationship with family and friends, and were less likely to feel good about their mental wellbeing. Pupils with caring responsibilities were also found to have poorer mental wellbeing before the pandemic in the SALSUS survey [3].
Contact
Email: socialresearch@gov.scot