Secondary school-aged pupils in Scotland - mental wellbeing, relationships and social media: report
This report outlines findings from a survey of 1,361 pupils from 50 secondary local authority schools in Scotland. The pupils completed the survey between 8th February and 2nd April 2021, and responded to questions about their mental wellbeing, relationships and social media use.
3. Overall findings
This section presents the findings for the whole sample.
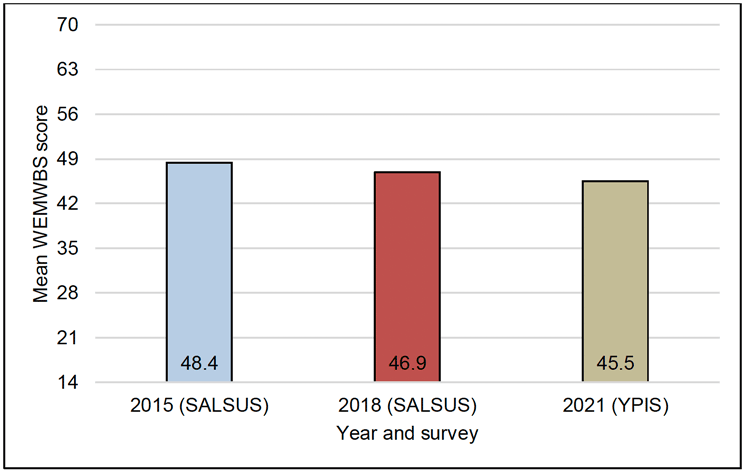
The mean WEMWBS score for the sample was 44.9, which represents average mental wellbeing – i.e., not high, but not indicating possible or probable depression. However, this score is at the lower end of the 45 to 59 'average mental wellbeing' score range described in the previous section.
Bearing in mind the caveat detailed in section 2 about making comparisons across YPIS, SALSUS and HBSC surveys, as shown in Figure 1, the mean mental wellbeing reported by female and male pupils in S2 and S4 was slightly lower in 2021 compared with 2015 and 2018[9]. As such, the comparison across surveys suggests that pupils' mental wellbeing was lower in early 2021 than before COVID-19. However, as these findings are from different surveys it is not possible to determine the statistical significance of this pattern of results, so firm conclusions cannot be drawn.
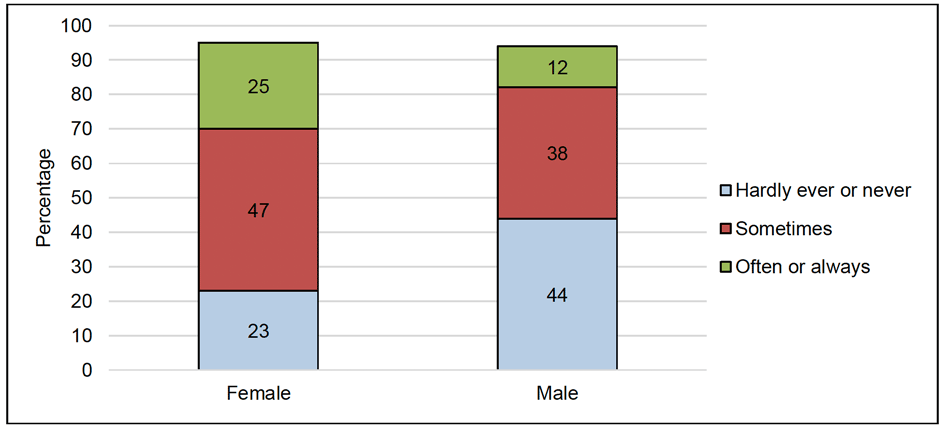
Regarding the participants' loneliness, the participants were most likely to report 'Sometimes' feeling lonely (42%), followed by 'Hardly ever or never' feeling lonely (33%) and 'Often or always' (20%; see Figure 2). This corresponds to the findings of the second TeenCovidLife survey [7], in which 20% of the sample reported feeling lonely 'Most of the time' or 'All of the time'. Pupils completing the TeenCovidLife survey also reported feeling lonelier at two points during the pandemic (July and October 2020) than before it.
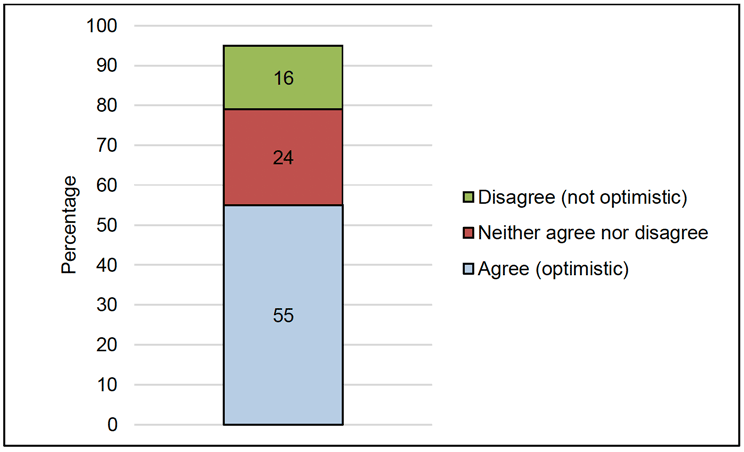
Over half of the participants indicated feeling optimistic, with 55% agreeing with the statement 'Even if I am having a difficult time, I feel like I will be OK' (see Figure 3). Although optimism was captured as an item within WEMWBS in SALSUS [3] and HBSC [4], no findings relating specifically to this factor were reported.
On average, the participants reported having 7.5 hours' sleep on the night before completing the survey. While sleep duration was also reported for HBSC [4], this was estimated in a different way to YPIS (i.e., calculated from pupils' reports of when they typically went to bed and woke up) and so cannot be used for comparison.
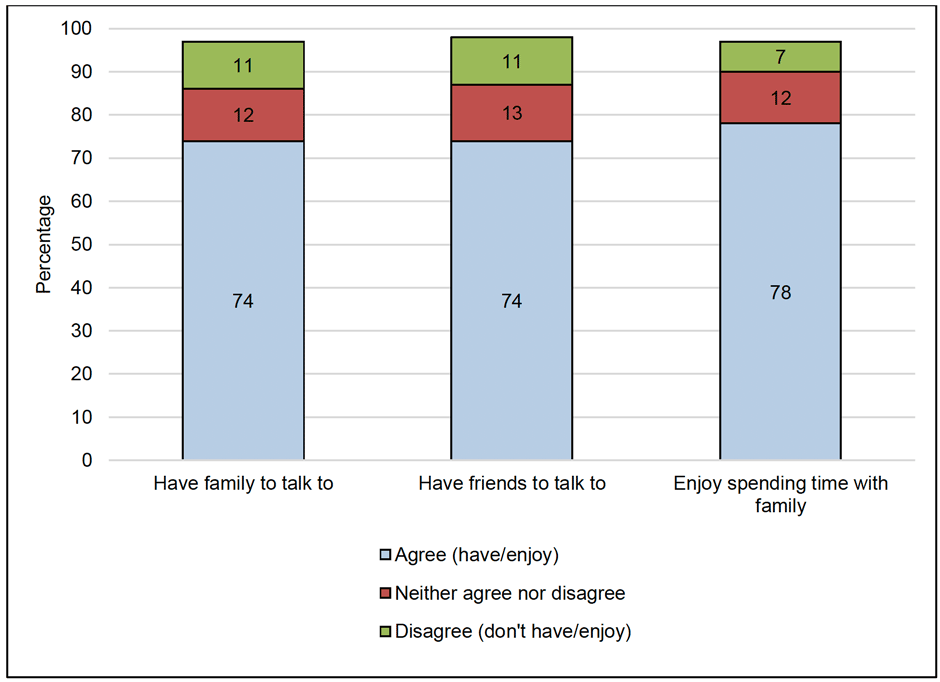
The majority of participants reported having family and friends with whom they could talk about their problems (74% for both family and friends; see Figure 4), and reported enjoying spending time with their family (78%; see Figure 4). While these statistics are not directly comparable to other surveys, these findings are in line with small proportions of respondents in the TeenCovidLife survey [7] reporting low satisfaction with family and friends (9% and 17%, respectively) during the pandemic.
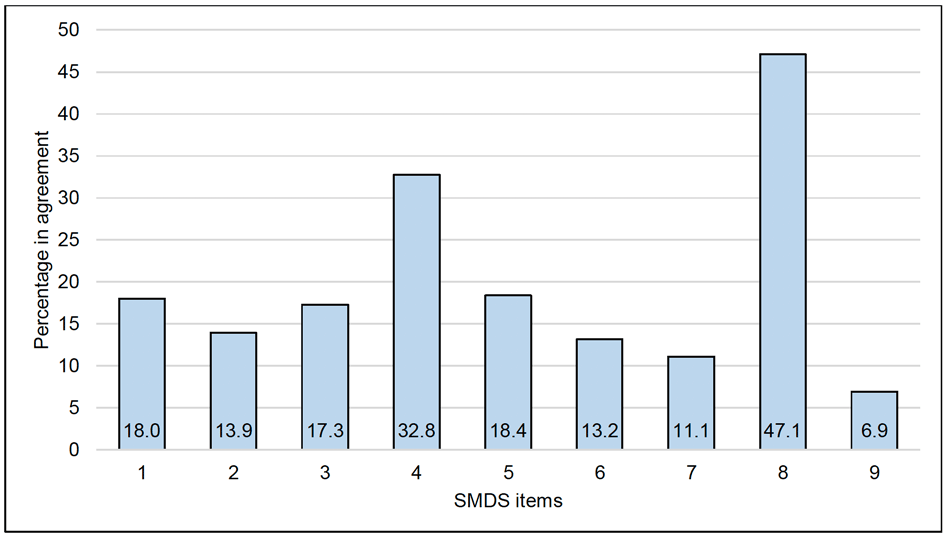
Overall, 13% of the participants agreed with five or more of nine statements about their social media use, which was the threshold used to identify problematic social media use. As shown in Figure 5 and Table 2, almost half (47%) of the whole sample indicated that they use social media to escape negative feelings, with roughly a third (33%) trying but failing to spend less time on social media.
| SMDS item | SMDS item wording |
|---|---|
| 1 | Cannot think of anything else but using social media again |
| 2 | Feel dissatisfied because want to spend more time on social media |
| 3 | Feel bad when cannot use social media |
| 4 | Try but fail to spend less time on social media |
| 5 | Neglect other activities because want to use social media |
| 6 | Had arguments with others because of social media use |
| 7 | Lied to parents/friends about amount of time spent on social media |
| 8 | Use social media to escape negative feelings |
| 9 | Had serious conflict with parent(s)/sibling(s) because of social media use |
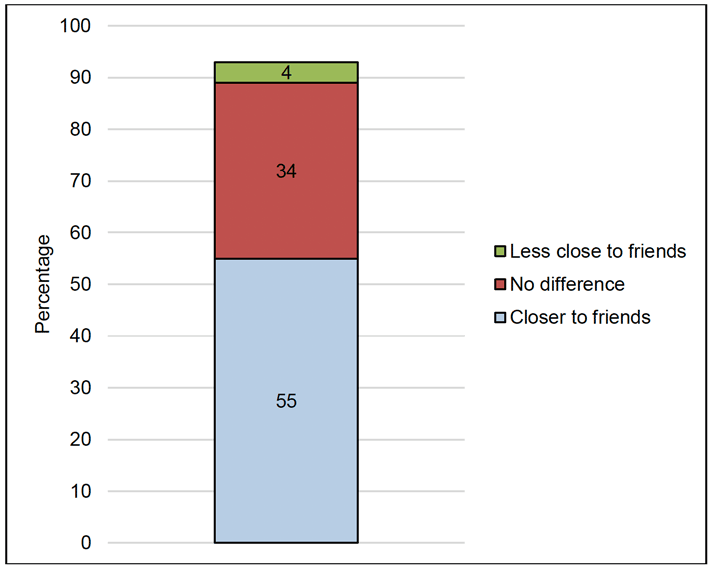
The majority of participants (55%) also reported that social media made them feel closer to their friends (see Figure 6).
Contact
Email: socialresearch@gov.scot