Scottish Study of Early Learning and Childcare: final report
This report brings together data from across the 6 phases of the Scottish Study of Early Learning and Childcare to consider some key questions about the impact of the expansion of funded ELC in Scotland from 600 to 1140 hours
4. The impact of the expansion of funded ELC on children’s health and development
In this chapter we will be examining evidence from the SSELC surveys around the first of the high-level outcomes, concerning whether children’s development has improved and the poverty-related outcomes gap has narrowed following the expansion of funded ELC. We will attempt to answer four of the key evaluation questions set out previously:
- What impact has the expansion of funded ELC from 600 to 1140 hours per year had on children's cognitive and language development?
- What impact has the expansion of funded ELC from 600 to 1140 hours per year had on children's social, behavioural and emotional development?
- What impact has the expansion of funded ELC from 600 to 1140 hours per year had on the poverty-related development gap, in particular cognitive and language skills?
- What impact has the expansion of funded ELC from 600 to 1140 hours per year had on children's physical health and wellbeing and on health inequalities?
The largest part of the analysis in this chapter focuses on outcomes for ELC Leavers, to allow us to assess the impact of nearly two years spent in funded ELC. These data were collected pre-expansion, when they were entitled to 600 hours of funded ELC per year, and post-expansion, when they were entitled to 1140 hours of funded ELC per year, at Phases 2 and 5 of the surveys, in April to June 2019 and April to June 2024.
Analysis has also been conducted for Eligible 2s at both age two and age three, pre-expansion, when they were entitled to 600 hours of funded ELC per year, and post-expansion, when they were entitled to 1140 hours of funded ELC per year. The first set of data on the Eligible 2s was collected towards the start of their funded ELC, at age two, pre-expansion, in October to December 2018 (Phase 1), with equivalent data collected post-expansion, in October to December 2023 (Phase 4). The same children were followed up one year later pre- and post-expansion at age three (Phases 3 and 6). This allows us to assess the impact of a year of funded ELC pre- and post-expansion on these specific groups of children.
Cognitive and language development
Three different measures of cognitive and language development are considered, all using data collected as part of the keyworker observations and relating to three separate domains of the Ages and Stages Questionnaire (ASQ): the communication, problem-solving and fine motor skills domains. Further details of these measures are included in Appendix A.
ASQ communication domain
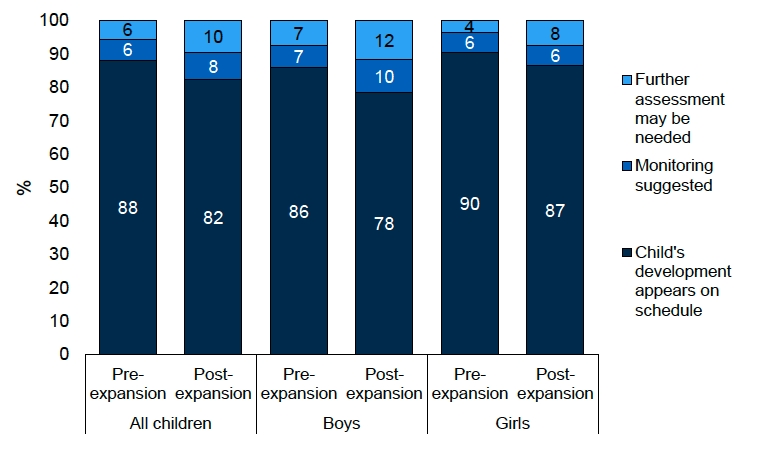
The proportion of ELC Leavers on schedule for the ASQ communication domain post-expansion (82%) was lower than the proportion on schedule pre-expansion (88%).
The proportion of boys on schedule fell from 86% to 78% post-expansion, while the change for girls was smaller and not significant (90% pre-expansion and 87% post-expansion) (see Figure 4.1).
While the proportion of all ELC Leavers on schedule has decreased, there has been a significant closing of the gap between those identified by keyworkers as having a long-term health condition which affects their development and other children. Pre-expansion, this gap was 28 percentage points (62% - 90%), whereas post-expansion it was 13 percentage points (70% - 83%). However, when comparing those identified by parents as having a limiting long-term condition with other children, there is no such closing of the gap: 24 points pre-expansion (66% - 90%) and 29 points post-expansion (57% - 86%).[26]
Use of regression analysis allows us to look in more detail at drivers of cognitive and language development, as well as to assess whether any observed changes in relation to the expansion hold true when controlling other factors. A number of regression models for key outcomes are included in the supplementary tables, and more details on how to interpret them are included in Appendix A. Table 4.1 summarises the results of the model of being on schedule on the ASQ communication domain for ELC Leavers.[27]
Table 4.1: Factors associated with ASQ communication domain on schedule, ELC Leavers
Higher likelihood of being on schedule (protective factors)
- Child attending funded ELC pre-expansion (Phase 2)
- Child being a girl
- Looking at books at home at least three days a week
- Use of informal childcare
Lower likelihood of being on schedule (risk factors)
- Household in bottom three income quintiles
- Family speaking a language other than English at home
- Child having a long-term health condition, whether limiting or not[28]
- Child getting < 11 hours sleep a day
This model confirms the finding that the proportion of children on schedule for the ASQ communication domain has decreased since the expansion of ELC, when controlling other factors. It also identifies a number of other drivers for being on schedule or not.[29] These are all independent of the phase of the study and hence apply both pre- and post-expansion. On the whole, these are well-established predictors of developmental outcomes for young children, many of which have been identified in previous SSELC reports. Girls are more likely than boys to be on schedule. Looking at books with an adult at home is also positively associated with being on schedule, as is the use of informal childcare, which tends to be from grandparents. Being from a lower income household, speaking a language other than English at home, having a long-term health condition, and not getting sufficient sleep all predict a lower likelihood of being on schedule. What the model does not tell us is what it is about each of these factors that drives communication development. While looking at books has an obvious direct effect, the effect of household income is indirect and multi-faceted.
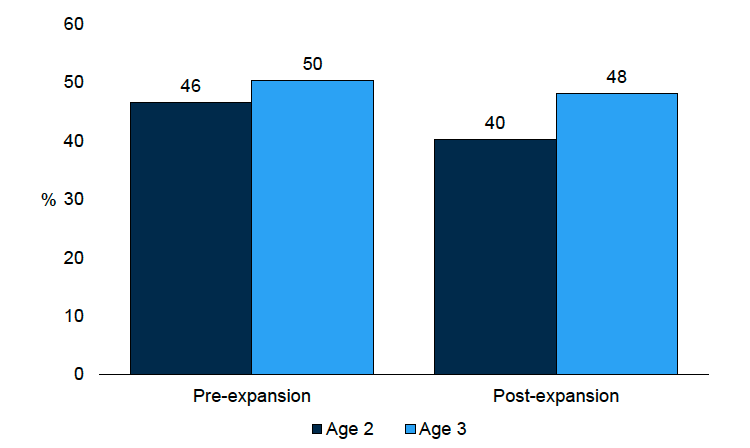
For the Eligible 2s (children who were eligible for funded ELC at age two), scores on the ASQ communication domain were measured at both age two and age three. As shown in Figure 4.2, pre-expansion, 46% were on schedule at age two and 50% at age three. The equivalent figures post-expansion were 40% at age two and 48% at age three.[30] The difference in the size of the change following one year of funded ELC, pre- and post-expansion, was not statistically significant.
Logistic regression modelling was also conducted for the Eligible 2s to establish whether the phase of the ELC expansion was significantly associated with being on schedule for the ASQ communication domain at age three, controlling for being on schedule at age two, as well as other independent factors. This type of model, which includes the same outcome measure at an earlier time point, is known as ‘autoregressive’.[31]
The model is summarised in Table 4.2. It confirms the finding that the change in the proportion of Eligible 2s on schedule for this domain after a year of funded ELC did not differ significantly pre- and post-expansion, even when other factors are controlled.[32]
Table 4.2: Factors associated with having ASQ communication on schedule at age three, controlling for outcome at age two, Eligible 2s
Higher likelihood of being on schedule (protective factors)
- Child being on schedule at age two
- More frequent home learning activities (at age two)
- Paying for additional hours at ELC setting (at age two)
Lower likelihood of being on schedule (risk factors)
- Child having a long-term health condition that limits daily activities a lot (at age three)
- Child attends ELC setting with lower Care Inspectorate rating (sum of four Key Question scores is 17 or less) (at age two)
The model also identifies home learning activities and paying for additional hours at the ELC setting as increasing the likelihood of the child being on schedule at age three. Having a long-term health condition and attending a setting with a lower rating by the Care Inspectorate reduced the likelihood of being on schedule.
Several other UK studies have also noted the importance of home learning activities in addition to ELC attendance. Early parental-time investment was identified as more effective than later time investment, particularly for the child’s verbal skills, and there was an association between the home-learning environment for pre-school children and academic outcomes more than a decade later.[33]
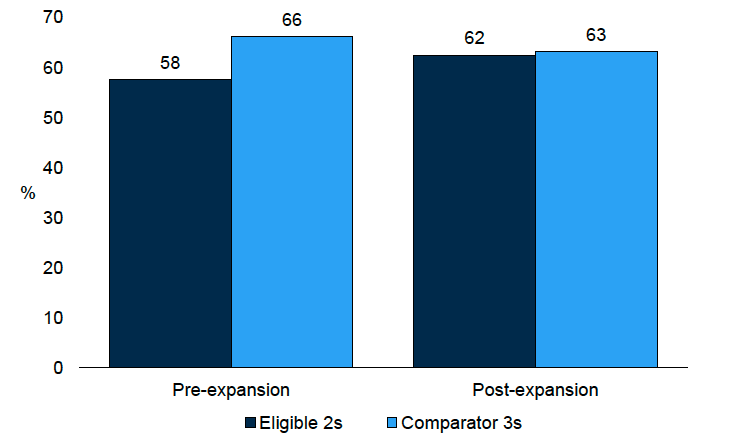
The gap between the Eligible 2s at age three and the Comparator 3s (the nationally representative sample of three-year-olds, most of whom were in their first term of funded ELC) was of a similar size pre- and post-expansion. Before the expansion this was 17 percentage points (50% for the Eligible 2s and 67% for the Comparator 3s), while after the expansion it was 14 percentage points (49% for the Eligible 2s and 63% for the Comparator 3s).[34]
ASQ problem-solving domain
The second measure of cognitive and language development, the proportion on schedule on the ASQ problem-solving domain, did not change between the phases for the ELC Leavers (89% on schedule pre-expansion and 88% post-expansion). Girls were significantly more likely than boys to be on schedule both pre- and post-expansion.
Figures for the Eligible 2s also saw no difference pre- and post-expansion. At age two, 34% were on schedule both pre- and post-expansion. After a year of funded ELC this had increased to 52% on schedule pre-expansion and 50% post-expansion.
There was also no statistically significant closing or widening of the gap between the Eligible 2s after a year of funded ELC and the Comparator 3s. Pre-expansion this was 10 percentage points (53% for the Eligible 2s at age three and 63% for the Comparator 3s), while post-expansion it was 13 percentage points (52% for the Eligible 2s at age three and 65% for the Comparator 3s).
ASQ fine motor domain
Fine motor skills refer to the ability to perform small movements using the muscles in our hands, fingers, lips, tongue and eyes, controlled by the brain and nervous system. These are linked to language development as well as gross motor / physical development.[35]
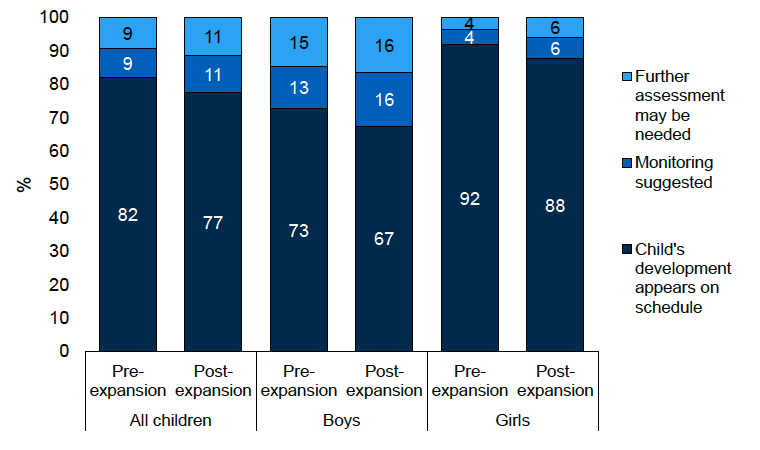
For the ELC Leavers, the proportion on schedule for the ASQ fine motor domain fell from 82% pre-expansion to 77% post-expansion. Figure 4.3 shows that the gap between girls and boys remained large.
The Eligible 2s were more likely to be on schedule for the ASQ fine motor domain at age two pre-expansion than they were post-expansion (42% pre-expansion and 32% post-expansion). At age three, after a year of funded ELC, there was no difference between these two groups (52% pre-expansion and 53% post-expansion).
The gap between the Eligible 2s at age three and the Comparator 3s with respect to the ASQ fine motor domain has remained fairly constant: 10 percentage points pre-expansion (54% of the Eligible 2s and 64% of the Comparator 3s on schedule) and 12 percentage points post-expansion (55% of the Eligible 2s and 67% of the Comparator 3s on schedule).
Summary and discussion
Altogether, these results show no evidence to date of progress in the outcomes relating to children’s cognitive and language development that the expansion of ELC was seeking to improve. Indeed, on two of the measures, outcomes have become worse for ELC Leavers between 2019 and 2024. These findings reflect other data on changes in child development over this period. A Public Health Scotland report on speech and language development using child health review data identified an increase in developmental concerns since the start of 2021 compared with the pre-pandemic period.[36] The report stated that ‘It is likely that the public health restrictions experienced by children in the critical early years have contributed to the increases in [speech, language and communication] developmental concerns that have been observed since early 2021.’ The findings have to be seen in the context of COVID-19 and the associated public health measures, which affected families across the whole country. The ELC Leavers were all born before the first protective measures were introduced, but would not have started funded ELC until after the final restrictions were lifted. However, over that period their parents would have been unable to access support from friends or the community, or to access services. That time also saw an increase in mental health difficulties in the adult population, as well as a great deal of uncertainty with regards to income and employment. This is likely to have affected the development of this cohort of children. Unfortunately, it is not possible to disentangle the expansion of ELC from these effects to determine what would have happened in the absence of the pandemic, or whether ELC has had a mitigating effect on the negative impacts of COVID and the protective public health measures.
While it is easy to put the negative findings down to the pandemic, we should also consider alternative hypotheses. For example, has the speed of the expansion impacted the quality of services provided? Previous SSELC reports have provided findings from observations conducted by Care Inspectorate staff seconded to the study using either the Infant/Toddler Environment Rating Scale (ITERS-3) or the Early Childhood Environment Rating Scale (ECERS-3). These actually showed an improvement in the quality of the experience of ELC for young children following the expansion on several of the measures included. At the same time, however, the survey of setting heads, conducted at Phase 4 and Phase 5 of the SSELC, identified the recruitment and training of staff as a major issue for many settings.
There are multiple reasons why staffing was an issue. One of these is the expansion itself, requiring an increase in workforce. The pandemic may also have played its part, temporarily stopping training and recruitment plans. With changes to the visa system announced in 2023 and coming into effect in 2025, international recruitment for non-teaching roles within the ELC sector would largely have stopped by the time of the post-expansion surveys.
For the Eligible 2s, smaller sample sizes meant that any apparent differences were less likely to be statistically significant. By age three, the proportion of Eligible 2s children on schedule was very similar post-expansion to pre-expansion, even where the starting point was lower at age two. This suggests that the Eligible 2s, who were born after the main COVID protective public health measures, may have been affected by the pandemic to a lesser extent than the ELC Leavers, whose experiences during their early developmental stages were heavily influenced by these measures. This may, in part, be due to the expansion of funded ELC, however, the data do not allow us to make such a claim.
Social, behavioural and emotional development
Social, behavioural and emotional development is measured in the SSELC surveys using the Strengths and Difficulties Questionnaire (SDQ) included within the keyworker observations. The questionnaire is divided into five domains, four of which can be summed together to provide a ‘total difficulties’ score.
SDQ total difficulties score
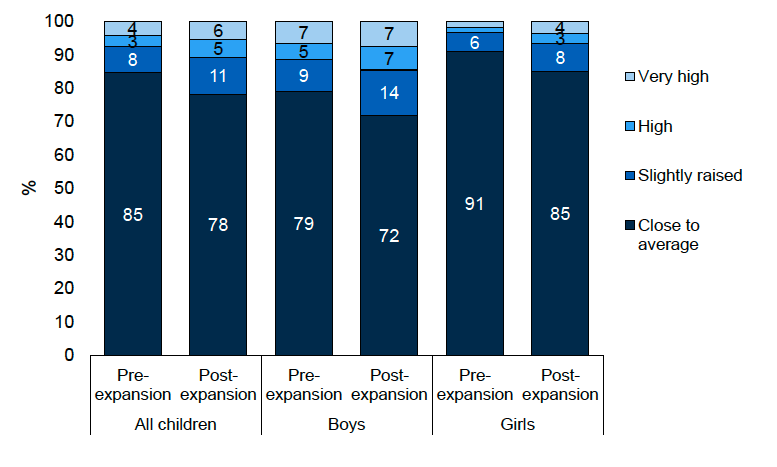
The proportion of ELC Leavers recorded as having a ‘close to average’ total difficulties score – indicating that no concerns were identified – has decreased since the expansion of ELC. Pre-expansion, 85% of ELC Leavers had a close to average score, compared with 78% post-expansion. Mean scores increased over the same period, from 5.6 (out of 40) to 6.6. A higher SDQ total difficulty score indicates more concerns.
As Figure 4.4 shows, the gap between girls and boys did not change, with girls tending to demonstrate fewer difficulties at both phases.
Regression analysis was used to look in more detail at the drivers of SDQ total difficulties scores being close to average. The results are summarised in Table 4.3, with the full model results shown in the supplementary tables.
Table 4.3: Factors associated with ‘close to average’ score on the SDQ total difficulties scale, ELC Leavers
Higher likelihood of total difficulties score being close to average (protective factors)
- Child attending funded ELC pre-expansion (Phase 2)
- Four or more children in the household
- Child being a girl
- Child was breastfed
Lower likelihood of total difficulties score being close to average (risk factors)
- Parent respondent not in work or training
- Household in bottom two income quintiles
- Child having a long-term health condition that limits daily activities
- Child attending a setting with a low CI rating of quality of care, play and learning support
- Child attending a setting with 30 or fewer registered places
This model confirms the finding that post-expansion (Phase 5), children were more likely to have a raised total-difficulties score (indicating more difficulties) than pre-expansion (Phase 2), even when extra control variables are introduced. Two factors related to the setting were significantly associated with the likelihood of a child having a raised SDQ score. Children in settings rated as three or lower by the Care Inspectorate in relation to the key question around care, play and learning support were less likely to have a close to average score (i.e. more likely to have social, behavioural and emotional difficulties). Children in smaller settings (those with 30 or fewer registered places) were also more likely to be identified as having difficulties.
Total difficulties scores were also calculated for the Eligible 2s at both ages two and three. Pre-expansion, the percentage close to average increased from 44% at age two to 58% at age three. Post-expansion it increased from 41% to 62%. The difference between the increases was not statistically significant. Similarly, the mean scores decreased from 11.8 to 10.3 (out of 40) pre-expansion, and from 12.0 to 10.8 post-expansion.
An autoregressive logistic regression model[37] was constructed for the Eligible 2s at age three to examine factors associated with being scored as ‘close to average’ on the SDQ total difficulties scale. This is summarised in Table 4.4. It shows that once the measure at age two is included, very few factors remain significant in the model.[38] Most importantly, it shows that the Eligible 2s at age three were significantly more likely to be scored as ‘close to average’ post-expansion when controlling for other factors, including the total difficulties score at age two. In other words, the improvement for the Eligible 2s between age two and age three on the total difficulties scale was greater post-expansion. This was not picked up by the simpler significance test reported in the previous paragraph as the association was partly being masked by other variables.
Table 4.4: Factors associated with ‘close to average’ SDQ total difficulties score at age three, controlling for outcome at age two, Eligible 2s
Higher likelihood of being close to average (protective factors)
- Child attending funded ELC post-expansion (Phase 6)
- Child being close to average at age two
- More frequent home learning activities (at age two)
Lower likelihood of being on schedule (risk factors)
- Child having a long-term health condition that limits daily activities a lot (at age three)
Post-expansion there was very little difference between the Eligible 2s at age three and the Comparator 3s in terms of the percentage close to average: 62% of the Eligible 2s and 63% of the Comparator 3s were close to average on the SDQ total difficulties scale. While this appears to be a closing of the gap from 58% of the Eligible 2s and 66% of the Comparator 3s close to average pre-expansion, the change in the size of the gap was not statistically significant.
SDQ domains
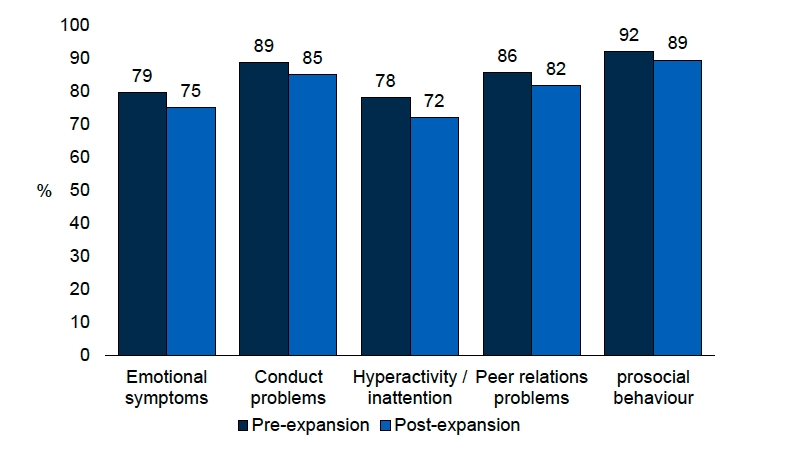
The SDQ comprises five domains, as well as the total difficulties score. On every one of these domains, the percentage of ELC Leavers who were close to average fell between 2019 and 2024. Each of the drops was between three and six percentage points. The largest was for the hyperactivity / inattention domain, from 78% pre-expansion to 72% post-expansion. The smallest (though still statistically significant) was for the prosocial behaviour domain, from 92% pre-expansion to 89% post-expansion. This is demonstrated in Figure 4.6.
Summary and discussion
Changes since the expansion of funded ELC in outcomes measuring social, behavioural and emotional development show similar patterns for ELC Leavers to those noted in the previous section on cognitive and language development. Again, these need to be interpreted in relation to COVID-19 and the associated protective public health measures.
A study of behaviour in Scottish schools found that ‘The pandemic was seen to have resulted in delays to pupils’ social and communication skills, leading to distressed and disruptive behaviour related to sharing, playing together and communicating their feelings’.[39] Such findings can reasonably be assumed to apply to pre-school children as well.
For the post-expansion ELC Leavers, who are likely to have been the most affected by the protective public health measures around COVID, outcomes were worse than before the expansion (and before the pandemic). This was true for all domains of the Strengths and Difficulties Questionnaire.
For the post-expansion Eligible 2s, there was a large improvement in SDQ total difficulties scores following a year of funded ELC, to the point that there was no difference between the Eligible 2s and the Comparator 3s. When regression analysis was conducted, the timing of data collection was significantly associated with the likelihood of being assessed as close to average (and having few / no social, behavioural and emotional difficulties), with better outcomes post-expansion. On this measure at least, for this group of children, there do appear to be improvements in behaviour associated with the expansion of funded ELC.
The poverty-related development gap
As outlined in Chapter 2, for the purposes of this study, the poverty-related development gap was defined in terms of:
1. the difference between those living in the most deprived quintile of the Scottish Index of Multiple Deprivation (SIMD) and those in the remaining four quintiles; and
2. the difference between those in the lowest equivalised household income quintile and those in the remaining four quintiles.
These definitions were chosen primarily to maximise the utility of the data, comparing the most deprived with the rest, rather than only using data from the top and bottom quintiles. The sample for the ELC Leavers was designed to facilitate this, with half the sample drawn from ELC settings in the most deprived SIMD quintile. In reality this did not equate to half the sample living in the most deprived areas, or being in the lowest income quintile, but it did return a sample clearly skewed towards those on low incomes and living in deprived areas.
In this section, as well as looking at differences by income and deprivation for the ELC Leavers, we also look at differences between the Eligible 2s at age three and the Comparator 3s on the single measure of four or more ASQ domains on schedule. The eligibility criteria for funded ELC at age two makes the Eligible 2s a group of children largely from low-income households, whom we can compare with the nationally representative Comparator 3s. Differences between these two groups have already been discussed in relation to cognitive and language development and social, behavioural and emotional development, and will further be discussed in the section on health and wellbeing.
ASQ four or more domains on schedule
The ASQ domains were combined into a single measure: whether at least four of the five domains are on schedule. While this is not a standard way of summarising the ASQ domains, it was selected in order to provide a measure of children who were on schedule in their development in most areas. Prior to the expansion of funded ELC, this was true for 84% of ELC Leavers. At the time of data collection following the expansion, this had fallen to 79% (although see below in relation the regression model for this outcome, Table 4.5).
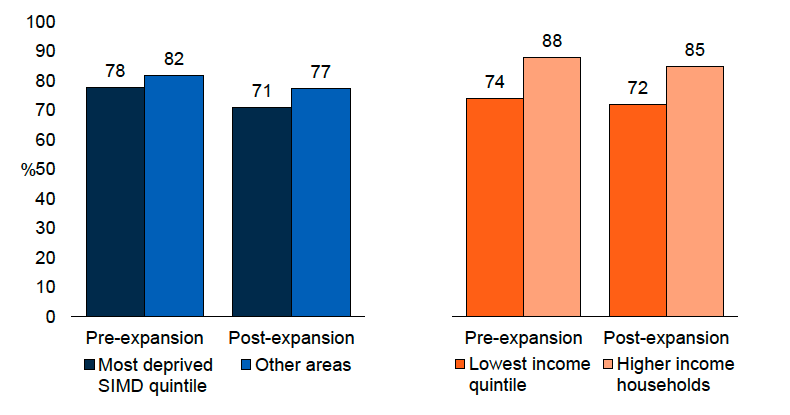
Figure 4.7: Four or more ASQ domains on schedule, by area deprivation and equivalised household income, ELC Leavers, pre- and post-expansion of funded ELC
Regression analysis was used to look in more detail at the drivers for being on schedule on four or more ASQ domains. The model results are summarised in Table 4.5.
Table 4.5: Factors associated with having four or more ASQ domains on schedule, ELC Leavers
Higher likelihood of four or more domains on schedule (protective factors)
- Parent respondent having a degree
- Child being a girl
- Child being older[40]
- Parent respondent in work or training
- Paying for additional hours at ELC setting
Lower likelihood of four or more domains on schedule (risk factors)
- Parent respondent having no formal qualifications
- Household in bottom income quintile
- Parent respondent from a non-white ethnic group
- Child having a long-term health condition, whether limiting or not
- Child attending a setting with a low Care Inspectorate rating of the setting environment
There are a number of things to note about this model. Firstly, the phase of data collection (pre- or post-expansion) is not significantly associated with having four or more ASQ domains on schedule once the control variables are included. This is in contrast to, and should take precedence over, what was said above,[41] suggesting that there is in fact no significant difference between the proportion with four or more domains on schedule pre- and post-expansion once we account for differences in the sample make-up.
Secondly, the rating of the setting environment was significantly associated with the outcome, with children in lower-ranked settings less likely to be on schedule for at least four domains.
Thirdly, being from a low-income household was identified as a risk factor. This is independent of the phase of data collection and so suggests that there has been no closing of the poverty-related development gap. Other factors related to household income are also present, such as parental level of education and being in employment, which further support this finding.
Paying for additional hours at the setting where funded ELC is received could be interpreted in two ways – either as a further indication that children benefit from being in households where this is an option (i.e. higher income households), independent of the timing of data collection, or that increased hours is a protective factor. While this second interpretation may appear to suggest that more hours of ELC lead to better outcomes for the child, this is not necessarily the case. The model does not take into account the fact that the average number of additional hours was greater pre-expansion. Nor does it consider that additional hours on top of the 1140 post-expansion may not be as effective as additional hours on top of the 600 pre-expansion.[42] It is necessary to further develop the model to try to understand better the impact of the expanded hours of funded ELC, while avoiding the confusion around unfunded hours.
A second model was run focusing on those who received only funded ELC. This allows a more direct comparison between child outcomes for those receiving up to 600 hours of funded ELC each year pre-expansion, and up to 1140 hours post-expansion. This model results are summarised in Table 4.6.
Table 4.6: Factors associated with having four or more ASQ domains on schedule, ELC Leavers receiving only funded ELC
Higher likelihood of four or more domains on schedule (protective factors)
- Parent respondent having a degree
- Child being a girl
- Child being older
- Use of informal childcare
Lower likelihood of four or more domains on schedule (risk factors)
- Parent respondent having no formal qualifications
- Parent respondent from a non-white ethnic group
- Child having a long-term health condition, whether limiting or not
In this model, income is no longer associated with child outcomes. This may suggest that when families do not purchase additional hours, the differences in child development for those on lower and higher incomes disappears. Having said that, the smaller sample size for this model makes it less likely that we will find variables significantly associated with the outcome measure, and parental education, which is strongly associated with income, remains one of the key drivers.
The use of additional informal childcare (in most cases this means grandparents) is identified as being a protective factor here. This again hints that more hours of childcare, whether it be through funded ELC or through informal networks, might benefit children. Children from those families who cannot afford to pay for additional childcare and/or who do not have readily accessible support networks are more likely to have worse outcomes.
Two further models looking at factors associated with having four or more ASQ domains on schedule for the ELC Leavers are included in the supplementary tables. In one, the sample is restricted to only those who received between 22 and 30 hours of ELC per week, and in the other it is restricted to those in the lowest income quintile.
A model of four or more domains on schedule was also run for the Eligible 2s. This is summarised in Table 4.7. It demonstrated no significant association between the phase of the study and the child outcomes. As with a number of the previous models, the rating of the ELC setting demonstrates a significant association with the outcome, with children attending settings rated lower by the Care Inspectorate being less likely to be on schedule for four or more domains.
Table 4.7: Factors associated with having four or more ASQ domains on schedule at age three, controlling for outcome at age two, Eligible 2s
Higher likelihood of four or more domains on schedule (protective factors)
- Child having four or more domains on schedule at age two
- Child was breastfed
Lower likelihood of four or more domains on schedule (risk factors)
- Child having a long-term health condition, whether limiting or not (at age three)
- Child attends ELC setting with lower Care Inspectorate rating (sum of four Key Question scores is 17 or less) (at age two)
ASQ domains
The ASQ communication domain has already been looked at in the section on cognitive and language development. It was further considered in terms of whether there was a closing of the gap between those in deprived areas and those in other areas, and those in low-income households, and other households, in the proportion of ELC Leavers on schedule.
Before the expansion, there was no significant difference between the proportion of ELC Leavers on schedule in the most deprived areas (86%) and in other areas (89%). Post-expansion there was a statistically significant gap, with 77% on schedule in deprived areas and 84% in other areas. However, the change in the magnitude of the gap, from three to seven percentage points was not significant.
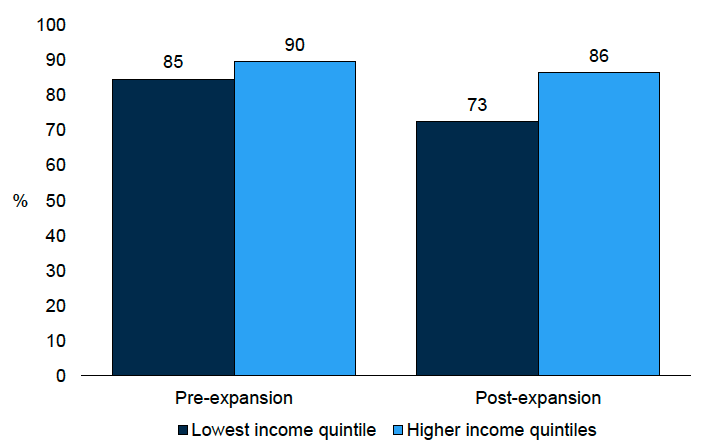
The pattern was the same for income, as shown in Figure 4.8. Pre-expansion there was no significant difference between the 85% on schedule in the lowest income households and the 90% in other households. Post-expansion there was a significant gap between the 73% on schedule in the lowest income households and the 86% in the other households. Again, the change in the size of the gap from five to thirteen percentage points was not significant.
Figures for the other ASQ domains are shown in the supplementary tables. In all cases there was an apparent, though non-significant widening of the gap.
Strengths and difficulties questionnaire
As with the ASQ, the SDQ provided no evidence so far for any closing of the gap between children living in deprived and other areas, or between low-income and other households.
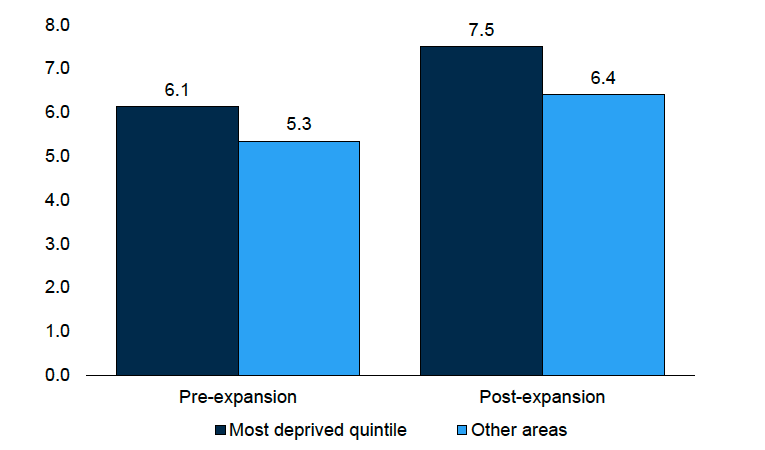
Pre-expansion, 82% of ELC Leavers living in the most deprived areas had an SDQ total difficulties score in the close to average range, compared with 86% in other areas. Post-expansion these figures had both fallen, to 74% in deprived areas and 80% in other areas, and the size of the gap had not changed significantly. Mean scores had risen (indicating more difficulties for the children) over the same period, from 6.1 to 7.5 (out of 40) in deprived areas and 5.3 to 6.4 in other areas, with no significant change in the size of the gap.
The same pattern could be seen for income. In the lowest-income households, the percentage of ELC Leavers with an SDQ total difficulties score in the close to average range was 79% pre-expansion and 69% post-expansion. In other households the percentage was 87% pre-expansion and 82% post-expansion, with no significant change in the size of the gap. Mean scores in low-income households were 6.5 pre-expansion and 8.0 post-expansion. In other households they were 5.3 pre-expansion and 6.1 post-expansion, with no change in the size of the gap.
Figures for the individual domains are provided in the supplementary tables. Only for the hyperactivity / inattention domain was there a significant change. The gap in the proportion of children with a close to average score rose from two percentage points pre-expansion (77% in the lowest-income households and 79% in other households) to 17 percentage points (60% in the lowest-income households and 77% in other households).
Summary and discussion
The SSELC surveys provide no evidence for a closing of the poverty-related gap in child development outcomes since the expansion of funded ELC. In fact, on one of the measures, score on the hyperactivity / inattention domain of the SDQ, there has been a widening of the gap between ELC Leavers from low-income households and other households. On several other measures, while the gap appeared to widen, the change in magnitude was not statistically significant.
As we have already noted, outcomes for all ELC Leavers have worsened between the pre-expansion phases and the post-expansion phases of the surveys. Multiple reports identify a widening of the poverty-related gap in school attainment in Scotland and the rest of the UK, and interpret this as due to the pandemic.[43] Many of the same issues relating to poverty are equally applicable to pre-school children. These findings again need to be interpreted in the context of COVID and the associated protective public health measures. The impact of the pandemic, compounded by the cost-of-living crisis, was felt to a greater extent by low-income families. Unfortunately, the SSELC data do not allow us to disentangle the effects of the pandemic from the effects of the expansion on a widening or closing of the poverty-related gap in outcomes.
At the same time, we also have to question whether the expansion of funded ELC has affected all children equally. Even with the expansion, children from wealthier families continue to access more hours of childcare (including unfunded ELC and informal childcare from grandparents) than those from low-income households.
Some improvements were observed for the Eligible 2s. This may be partly because the post-expansion cohort were all born after the final protective public health measures around the COVID pandemic were removed. However, small sample sizes for this group mean that we do not have any evidence for a closing of the gap between the Eligible 2s and the Comparator 3s.
Health and wellbeing / health inequalities
Two measures of more general health are examined in this section: whether the child is on schedule for the ASQ gross motor domain; and whether the parent reports them as in good or very good health.
ASQ gross motor domain
The ASQ gross motor domain is a measure of physical development. There was no significant difference in the proportion of ELC Leavers assessed as on schedule pre-expansion (81%) and post-expansion (79%). Girls remained significantly more likely than boys to be on schedule at both phases (87% of girls and 76% of boys pre-expansion, and 86% of girls and 72% of boys post-expansion), with no closing or widening of the gap.
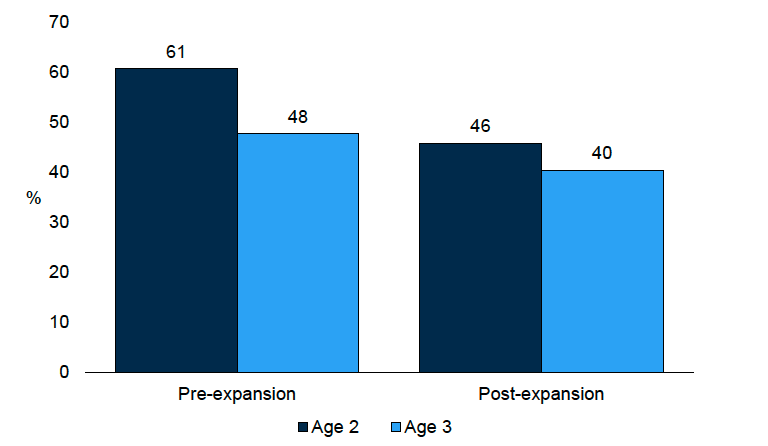
Figure 4.10 shows that among the Eligible 2s, there was a fall in the proportion on schedule at age two, from 61% pre-expansion to 46% post-expansion. At age three, these figures were 48% pre-expansion and 40% post-expansion. The change in scores between ages two and three, a fall of 15 percentage points pre-expansion and 8 percentage points post-expansion were not significantly different from each other.[44]
The difference in the proportion on schedule between the Eligible 2s at age three and the comparator 3s did not change significantly following the expansion. Before the expansion of funded ELC, there was no difference between the two groups (47% of Eligible 2s on schedule and 46% of Comparator 3s). Following the expansion, the gap appeared larger, but was not significant (42% of Eligible 2s and 50% of Comparator 3s).
Child’s general health
General health is the only child outcome considered in this report taken from the parent questionnaire. The vast majority of parents reported their child to be in good or very good health at all phases of the survey.
For the ELC Leavers there was a small but significant fall in the proportion reported as being in good or very good health, from 97% pre-expansion to 95% post-expansion.
For the Eligible 2s, this pattern was reversed, with a significant rise in the proportion in good or very good health at age two from 91% pre-expansion to 95% post-expansion. At age three, the difference was not significant: 93% pre-expansion and 96% post-expansion. There was no change in the gap between the Eligible 2s at age three and the Comparator 3s over the period covered by the ELC expansion.
Summary and discussion
Children’s gross motor development and general health may reflect a range of related factors in their lives such as whether they have a long-term health conditions or their level physical activity. Where children are physically active throughout the day (outside of ELC), ELC may have less of an impact on physical and general health than it might on social and behavioural development or cognitive and language development. However, for some, the time spent at ELC may increase their levels of physical activity. Hence any changes identified in this section are likely to reflect not just on the expansion of funded ELC, but on changes in home life over the period covered by the study. Since the COVID restrictions, sedentary activities, including the use of electronic devices, have become more common for children of all ages,[45] so it is not surprising that the SSELC provides no evidence for an improvement in children’s general health and physical development since the expansion.
For the ELC Leavers, while there was no change in the proportion on schedule for the ASQ gross motor domain, there was a small fall in the proportion in good or very good health since the expansion of funded ELC.
For the Eligible 2s at age two, there was a significant decline in the proportion on schedule for the ASQ gross motor domain pre- and post-expansion. Given that this group were all born after the final restrictions following the COVID pandemic were lifted, there is no clear explanation for this. It is also contradicted by the parent reports of the child’s general health, which show an increase in the proportion in good or very good health since the expansion. Given the small sample sizes for the Eligible 2s, these findings may well be a quirk of the data. At age three, differences pre- and post-expansion were not significant.
Contact
Email: socialresearch@gov.scot