Scottish Study of Early Learning and Childcare: final report
This report brings together data from across the 6 phases of the Scottish Study of Early Learning and Childcare to consider some key questions about the impact of the expansion of funded ELC in Scotland from 600 to 1140 hours
2. Methods
Study design
The SSELC was designed to allow comparison of outcomes between groups of children and their parents accessing up to 600 hours of funded ELC before the expansion, and those accessing up to 1140 hours after the expansion had been fully rolled out.
The design of the SSELC as a largely before-and-after study means that any changes observed in the outcomes that the expansion of funded ELC is seeking to improve cannot be directly attributed to this policy. The SSELC methodology can establish association but not causality. The study is not able to tell us what any changes in these outcomes would have been in the absence of the ELC expansion, nor is it able to compare outcomes for children who received the 1140 hours with a control group who did not.
The six phases of the SSELC
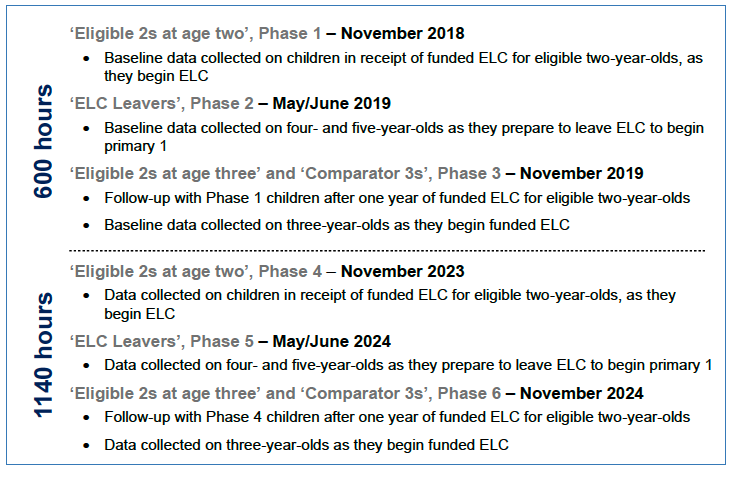
600 hours - baseline
‘Eligible 2s at age two’, Phase 1 – November 2018
- Baseline data collected on eligible two-year-olds as they began ELC
‘ELC Leavers’, Phase 2 – May/June 2019
- Baseline data collected on four- and five-year-olds as they leave ELC to begin primary 1
Three-year-olds, Phase 3 – November 2019
- Follow-up with Eligible 2s at age three after one year in ELC (Phase 1)
- Baseline data collected on three-year-olds as they begin ELC
1140 hours – post-expansion
‘Eligible 2s at age two’, Phase 4 – November 2023
- Data collected on eligible two-year-olds as they begin ELC
‘ELC Leavers’, Phase 5 – May/June 2024
- Data collected on four- and five-year-olds as they leave ELC to begin primary 1
Three-year-olds, Phase 6 – November 2024
- Follow-up with Eligible 2s at age three after one year in ELC (Phase 4)
- Data collected on three-year-olds as they begin ELC
Data were collected across six phases, as shown in the box below. During 2018-19, Phases 1 to 3 collected baseline (‘pre-expansion’) data on outcomes for children and their parents accessing up to 600 hours of funded ELC. During 2023-24, Phases 4 to 6 of the SSELC collected ‘post-expansion’ data on children and their parents accessing up to 1140 hours of funded ELC.
Describing the SSELC cohorts
Short-hand terminology is used consistently throughout the report to describe the different cohorts of children included in SSELC. Full definitions and the short-hand used throughout the report are described below.
Table 2.1: The SSELC cohorts
Description of cohort
Children beginning their eligible funded ELC for two-year-olds
Short-hand terminology used in report to describe cohort
Eligible 2s at age two
Length of time in funded ELC
Maximum six months
Participating phases
Phases 1 and 4
Description of cohort
Children after a year of funded ELC for two-year olds
Short-hand terminology used in report to describe cohort
Eligible 2s at age three
Length of time in funded ELC
12 to 18 months
Participating phases
Phases 3 and 6
Description of cohort
Children aged four and five as they prepare to leave ELC to begin primary 1
Short-hand terminology used in report to describe cohort
ELC Leavers
Length of time in funded ELC
Typically, around 21 months, although older children and those who were eligible at age two may have received more
Participating phases
Phases 2 and 5
Description of cohort
Three-year-old children mostly at the start of their funded ELC[20]
Short-hand terminology used in report to describe cohort
Comparator 3s
Length of time in funded ELC
Maximum six months unless eligible at age two
Participating phases
Phases 3 and 6
Comparisons of outcomes between phases
The SSELC was designed to be both a longitudinal and cross-sectional study. The cross-sectional element of the study allowed for comparison of outcomes of groups of children and their parents accessing 600 hours of funded ELC in 2018/2019, with those accessing 1140 hours in 2023/2024. This included comparing outcomes of four- and five-year-olds (ELC Leavers) at Phase 2 (2019) with outcomes for children of the same age at Phase 5 (2024). Similar comparisons could also be made for the other cohorts described above.
In the longitudinal element of the study, data were collected pre-expansion (at Phase 1) and post-expansion (at Phase 4) on two cohorts of two-year-olds (one at each phase) who were eligible for funded ELC, when they began accessing their funded entitlement. The same children were followed up at age three pre- and post-expansion (at Phase 3 and Phase 6 respectively) after they had received one year of funded ELC. This longitudinal element provides evidence on the impact of one year of ELC on those children who may benefit from it most.
Components of the study
The SSELC gathered data on child and parent outcomes via the linked components listed below:
1. questionnaire-based assessment of sampled children’s development by their ELC keyworker (all phases)
2. questionnaire completed by one parent of the sampled children (all phases)
3. setting observations (Phases 1, 2 ,4 and 5)
4. survey of the heads or managers of settings attended by sampled children (Phases 4 and 5)
Recruitment of participants
With the exception of Phase 1 (see below), participants were recruited via ELC settings across most local authority areas providing funded ELC – including local authority, private and third sector settings. A two-stage, ‘cluster’ sampling approach was taken. The first stage involved the random selection of settings, and the second stage involved the random selection of children within settings.[21] Up to 10 children were selected within each sampled setting.
Further information on SSELC study design, including data collection, sampling and weighting, is included in Appendix A and is also included in individual reports for each phase.
Design and methodological considerations
Non-random approach used in Phase 1
At Phase 1, because more local authorities than expected had already moved on to 1140 hours for their eligible two-year-olds and because some settings did not feel able to take part, the study had to include all settings that met the eligibility criteria in the relevant local authority areas. Therefore, the selection of settings was not random. Within the 17 local authorities that agreed to participate, all settings still offering 600 hours in August 2018 were invited to participate in the study. Response rates were high, leading to an effective census of eligible two-year-olds receiving 600 hours of funded ELC in those 17 local authorities. Nevertheless, no claims are made that the data are representative of eligible two-year-olds across the whole of Scotland at that time.
At Phase 4, recruitment of the eligible two-year-olds was conducted in a similar manner to the ELC Leavers at Phase 2, to generate a nationally representative sample with random selection of settings and random selection of children within settings.
Given the difference in the sampling approaches between Phases 1 and 4, some consideration was given to the most appropriate means for making comparisons between the Phase 1 and 4 cohorts: either to restrict analysis to those 17 local authorities participating at Phase 1 or to use all the available survey data.
Exploratory analysis concluded that the differences between participating and non-participating local authorities at Phase 1 were not large on most measures[22]. Given the homogeneity of the Eligible 2s at age two population pre- and post-expansion, being a deprived subgroup of the population, these differences were not considered sufficiently large to notably impact the overall comparability, between phases, of the Eligible 2s at age two. As such, for post-expansion, analysis is based on the full sample and has been designed to control for differences in participating areas.
Whilst the data are not representative of eligible two-year-olds across the whole of Scotland at either age two or age three, robust conclusions may still be drawn from the data to assess whether, all other things held the same, the expansion of funded ELC has made a difference to child and parent outcomes of interest.
Response at Phase 4 and Phase 6
Response rates at Phase 4 of the study were lower than predicted from earlier phases. When designing the study, it was estimated that a sample size of 600 Eligible 2s would be sufficient to pick up significant changes on key variables. At Phase 4, 500 children took part, 486 with a keyworker questionnaire and 341 with a parent questionnaire. When following up these children at Phase 6, there was a further fall off in achieved sample. Hence analysis of the Eligible 2s at age three, post-expansion, is limited to data from 289 children, with 285 keyworker questionnaires and 164 parent questionnaires.
What this means in practice is that the bar for being able to identify changes in outcomes for the Eligible 2s, either positive or negative, is very high. Confidence intervals around estimates for the Eligible 2s at age three using keyworker data are around 50% larger than they would have been for a sample of 600 children, and nearly 100% larger for parent data. Hence observed changes from pre-expansion to post-expansion would also need to be larger in order to be identified as statistically significant.
Because of the small sample sizes, subgroup analysis for the Eligible 2s has not been conducted for this report.
Differences in make-up of sample pre- and post-expansion
Each of the Phase reports provide a profile of the sample, including details on sex of the study child and of the respondent, household income, area deprivation, highest level of educational qualification of the respondent, number of parents and number of children in the household, and ethnicity. For each of the cohorts there was no real difference in any of these characteristics pre- and post-expansion. There were, however, very obvious differences between the cohorts, with the Eligible 2s much more likely to be from low-income households than other cohorts. This was to be expected, given the eligibility criteria for funded ELC at age two, and does not affect the analysis.
At all phases, just over 90% of the respondents were women. This does not affect comparisons pre- and post-expansion, but it does affect the interpretation of parent outcomes. Analysis of employment outcomes has been restricted to mothers, as comparisons including fathers could have been skewed by the typically longer hours worked by men.
Many of the child outcomes examined are age dependent. This is particularly true of those included in the keyworker questionnaire relating to child development. While different questionnaires were used depending on the age of the child (see Appendix A), children towards the top end of the age range for a particular questionnaire would be expected to be more likely to have achieved specific developmental milestones than children at the younger end of the range. Average ages for children in each cohort on the date keyworker questionnaires were completed are shown in Appendix A.
Differences in average ages pre- and post-expansion are all within what may be expected given sampling variation. Where differences are less than half a month on average, this is unlikely to affect findings in any major way. However, the Eligible 2s at age three were around one month older on average post-expansion than they were pre-expansion. This is likely to have exacerbated the issues already highlighted around the small sample sizes achieved for this group at Phases 4 and 6 and the non-random sample at Phase 1.
Considerations related to the coronavirus pandemic
It is important to note the potential impact of the coronavirus (COVID-19) pandemic on the specific cohorts of children sampled for the SSELC Phases 4-6:
- Eligible two-year-olds at age three and comparator three-year-olds were born between May and November 2021. The pandemic may be expected to have had a limited impact on these cohorts given they were born after the main protective public health measures were lifted. However, their parents may have experienced some restrictions in their child’s first year in terms of maternity/post-partum care and in accessing parent support groups.
- ELC Leavers that took part at Phase 5 – starting Primary 1 in August 2024 – were born between November 2018 and February 2020. This cohort were aged between one month to slightly over one year old at the start of the pandemic in March 2020 so their first to second year of life was impacted severely by the protective public health measures. However, the pandemic will have had a limited impact on their funded ELC attendance.
- Early child development statistics from Public Health Scotland show an increase in the proportion of children with a developmental concern from before the pandemic to the latest available data (2023/2024) at all ages (13-15 months, 27-30 months and 4-5 years), including those born after the lifting of public health measures.
Fully disentangling the effects of the expansion of funded ELC from those of the pandemic and associated protective public health measures or other societal changes over the same period is not simple. Where appropriate this report cites evidence from other sources to set the findings in context. However, it has not been possible to quantify the effects of the pandemic, hence we cannot attribute changes over time to either the expansion of funded ELC or the pandemic. The findings reported in subsequent chapters should be seen as changes between 2018/2019, before the expansion, and 2023/2024, after the expansion, rather than necessarily as a result of the expansion of funded ELC.
Analysis
Analytical plan
The data used in this report are taken from all six phases of the SSELC. An analytical plan was drafted by the research team at the Scottish Centre for Social Research in collaboration with, and with peer review from, analysts in Scottish Government, Public Health Scotland and the ELC Expansion Monitoring and Evaluation Working Group.
Key comparisons included in the report
If the high-level aims of the expansion have been achieved, it is expected that there would be an increase in the proportion of ELC Leavers whose cognitive and language development and whose social, behavioural and emotional development were on track for children of their age. In addition, the proportion of Eligible 2s whose development was on track would be expected to have increased following one year of ELC, as would the average wellbeing of parents of Eligible 2s.
It is also expected that there would be an increase in the proportion of mothers/ female carers (hereafter referred to as ‘mothers’) of ELC Leavers in work, study or training.
Pre-expansion and post-expansion analysis datasets were created by combining data from across phases. This allowed for the following comparisons for children receiving 600 hours of funded ELC (baseline data) and those receiving 1140 hours (post-expansion data) as shown in Table 2.3.
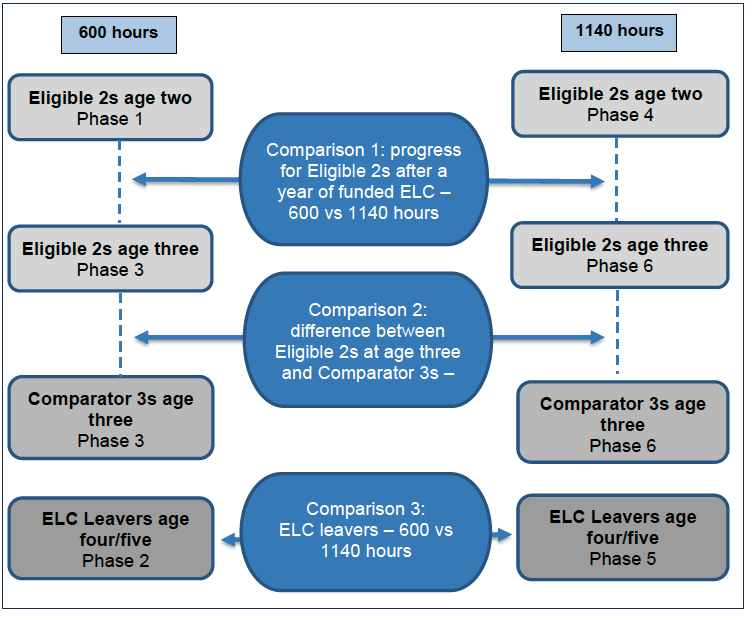
This report primarily focuses on:
- the progress in outcomes for Eligible 2s (and their parents) after one year of funded ELC, pre- and post-expansion
- the difference in outcomes between Eligible 2s at age three and the Comparator 3s (and their parents), pre- and post-expansion, and,
- outcomes for ELC Leavers (and their parents), pre- and post-expansion.
See Figure 2.1 below for a visual representation of the key comparisons that are described in the preceding paragraph and Table 2.3 below.
Table 2.3: Datasets used for comparisons of pre-expansion and post-expansion data
Cohort data to be compared
Eligible 2s at age two
Baseline data
Phase 1
Post-expansion data
Phase 4
Cohort data to be compared
Eligible 2s at age three
Baseline data
Phase 3
Post-expansion data
Phase 6
Cohort data to be compared
Change for Eligible 2s following one year of funded ELC
Baseline data
Difference between Phase 1 and Phase 3
Post-expansion data
Difference between Phase 4 and Phase 6
Cohort data to be compared
Comparator 3s
Baseline data
Phase 3
Post-expansion data
Phase 6
Cohort data to be compared
Difference between Eligible 2s at age three and Comparator 3s
Baseline data
Phase 3
Post-expansion data
Phase 6
Cohort data to be compared
ELC Leavers
Baseline data
Phase 2
Post-expansion data
Phase 5
Child outcomes
Child outcomes are measured primarily via the Ages and Stages Questionnaire (ASQ)[23] and the Strengths and Difficulties Questionnaire (SDQ).[24] The ASQ is a structured assessment of a range of developmental domains to identify children at increased risk of developmental difficulties. The instrument includes 30 items split into five different domains: communication, gross motor, fine motor, problem solving and personal-social. Each domain produces a summary score which can be used to indicate whether the child's development is on schedule, needs monitoring or requires further assessment.
The SDQ is a commonly used behavioural screening questionnaire designed for use with children aged between two and 16. The questionnaire includes 25 questions about a child's behaviour. Responses can be combined to form five different measures of the child's development, namely emotional symptoms, conduct problems, hyperactivity / inattention, peer relationship problems, and prosocial behaviour. In addition, the first four measures can be combined into a ‘total difficulties’ scale.
Specific key comparisons of child outcomes were:
- The proportion of ELC Leavers with 4+ ASQ domains on schedule
- The proportion of ELC Leavers with the ASQ communication domain on schedule
- The proportion of ELC Leavers with an SDQ total difficulties score close to average
- The change in the proportion of Eligible 2s with 4+ ASQ domains on schedule following one year of funded ELC
- The change in the proportion of Eligible 2s with the ASQ communication domain on schedule following one year of funded ELC
- The change in the proportion of Eligible 2s with an SDQ total difficulties score close to average following one year of funded ELC
The ASQ and SDQ scales are described in more detail in Appendix A, along with the other data collection instruments used in SSELC.
Parent outcomes
Key parent outcomes included the percentage of female responding parents in work, study or training, and parental wellbeing measured via the Short Warwick-Edinburgh Mental Wellbeing Scale (SWEMWBS). While the expansion of funded ELC does not specifically target women in the aim to enable parents to work, study or train, the SSELC questionnaires pre-expansion only collected information about the respondent’s employment, and in over 90% of cases the respondent was female. For the SWEMWBS measure, respondents were presented with seven statements about positive feelings and thoughts, responses to which were used to form a scale. A description of SWEMWBS scoring is included in Appendix A.
Specific key comparisons of parent outcomes were:
- The proportion of female parental respondents (‘mothers of ELC Leavers’) in work, study or training
- The change in the wellbeing of parents of Eligible 2s following one year of funded ELC.
Defining the poverty-related gap
One of the main research questions set out in the Evaluation Strategy relates to the impact of the expansion on the ‘poverty-related development gap’. The most common way of defining a poverty-related gap is in comparing outcomes for those in the lowest income quintile (families with household incomes in the lowest 20%) with those in the highest income quintile (families with the highest 20% of household incomes). However, there are several alternative ways the gap can also be defined: for example, comparing outcomes for children residing in households in the lowest equivalised income quintile compared with those in all other households; in households with below median income compared with those in households above median income; or comparing those living in the 20% most deprived areas in Scotland compared with those living in the 20% least deprived areas.
The poverty-related development gap can also, to some extent, be explored by comparing outcomes for Eligible 2s at age three with the outcomes for the Comparator 3s. This is because the majority of the Eligible 2s reside in households claiming out of work or other benefits and hence are on low incomes; however, it should be kept in mind that due to other eligibility criteria not all Eligible 2s will be living in low income households.
In this report, both income and area deprivation have been used when specifically discussing the poverty-related development gap. The difference between the Eligible 2s at age three and comparator 3s will also be discussed more widely throughout the report.
Data analysis and statistical significance
The most common types of analysis presented within this report are frequencies, cross-tabulations and comparison of means, with the aim of inferring changes in outcomes for children receiving funded ELC pre- and post-expansion. For the key outcomes of interest, multivariable regression analysis has been used, to allow more complex consideration of the factors which are independently associated with them. Regression analysis was also used to test for statistically significant differences.
With the exception of where Phase 1 data are included, all analysis was conducted using weighted data and the complex samples package in SPSS. This means that the clustering of children within settings was taken into account when determining statistical significance. The use of weighted data is required to make sure the sample is representative of settings across Scotland.
Percentages are reported to the nearest whole number. However, as the findings are based on a sample survey, these figures are an estimate of the true figures within the population and so should not be interpreted as being totally precise for the population as a whole. A test for statistical significance allows us to estimate how confident we can be that two percentages or mean values we wish to compare are actually different in the population, given the amount of uncertainty we are prepared to accept in our sample. All comparisons reported in the text have been tested for statistical significance through the use of logistic or linear regression, although levels of statistical significance are not reported. Where a difference between subgroups is noted in the text, this difference is statistically significant at the 95% level.[25] Differences which are not statistically significant are generally not reported in the text unless it is considered noteworthy that no such difference can be identified in the data between the groups of concern. Confidence intervals and significance values are provided in the supplementary tables that can be found in the Supporting documents. To avoid confusion, the word ‘significance’ in this report is only ever used in relation to statistical significance.
Further details on the specific analytical approaches used for each set of comparisons are included in Appendix A.
Table conventions
In the tables, a dash (-) signifies that no cases fall into the particular category, whereas a zero (0) signifies at least one case falls into that category, but less than 0.5% of all cases. Base descriptions refer to the group who were eligible for inclusion in the table. Missing data are excluded from all figures, including the base.
All figures mentioned in the text of this report can be found in the supplementary tables that can be found in the Supporting documents. Occasionally figures are reported that are the sum of two or more categories. Unrounded figures have been used to calculate these, so may differ from calculations using rounded figures. The supplementary tables also contain some additional data from the comparative analysis which are not discussed in this report. Comments regarding the ‘Design and Methodological Considerations’ above are applicable to these tables. More information on the table conventions is included on the cover sheet of each set of supplementary tables.
Contact
Email: socialresearch@gov.scot