Scottish Study of Early Learning and Childcare: final report
This report brings together data from across the 6 phases of the Scottish Study of Early Learning and Childcare to consider some key questions about the impact of the expansion of funded ELC in Scotland from 600 to 1140 hours
3. Use of ELC and childcare
This chapter is intended to provide context around how the use of ELC and childcare has changed with the expansion of funded ELC. It does not provide responses to any of the evaluation questions set out previously. It provides an understanding of changes in the total amount and make up of childcare used by families, and the extent to which funded ELC is displacing paid for ELC or informal childcare, to help interpret findings on outcomes for children and parents.
Data are presented in the supplementary tables that can be found in the Supporting documents for the ELC Leavers, the Eligible 2s at age three and the Comparator 3s. Questions on use of funded ELC at the main setting were asked in the keyworker questionnaires both pre- and post-expansion, and the parent questionnaires post-expansion only. Data reported here are from the keyworker questionnaire, but previous SSELC reports show that findings are similar from both sources. All other data in this chapter are taken from the parent questionnaires.
Formal early learning and childcare
Funded ELC
As expected, for all three groups, there was a significant increase in the mean hours of funded ELC used post-expansion. ELC Leavers received a mean of 15.6 hours a week pre-expansion at the main setting, which equates to slightly more than 600 hours a year if spread across school terms, and 26.3 hours a week post-expansion. This figure lies between the 22 hours a week available for those receiving funding all year round and 30 hours a week for those receiving funding during school terms only. For the Eligible 2s at age three, the increase was from 19.0 hours a week pre-expansion to 27.3 hours post-expansion, while for the Comparator 3s it was from 16.7 to 25.6 a week. The higher figures both pre- and post-expansion for the Eligible 2s may be due to increased discretionary funding provided by the local authority or greater use of term-time provision.
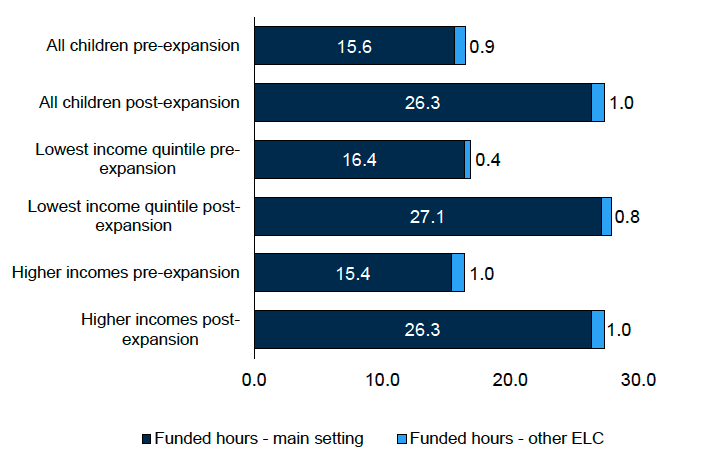
A small proportion of children received funded ELC from more than one setting (6% of ELC Leavers, 8% of Eligible 2s at age three, and 9% of Comparator 3s pre-expansion; and 7% of ELC Leavers, 3% of Eligible 2s at age three and 6% of Comparator 3s post-expansion). Figure 3.1 shows that this increases the average total hours of funded ELC per week for ELC Leavers by around one hour, both pre- and post-expansion. Differences between those in lower and higher income groups for either the main setting or additional settings are not statistically significant.
Unfunded ELC
With the expansion, there was a decrease in the proportion of families of ELC Leavers paying for additional hours at the same setting, from 28% to 20%, as well as a decrease in the proportion paying for ELC at other settings, from 15% to 10%. There was also a decrease in the number of additional hours paid for at the main setting, from a mean of 13.8 hours a week, among those paying for additional hours, to 10.1 hours a week post-expansion. Differences for the Eligible 2s at age three and the Comparator 3s were not significant.
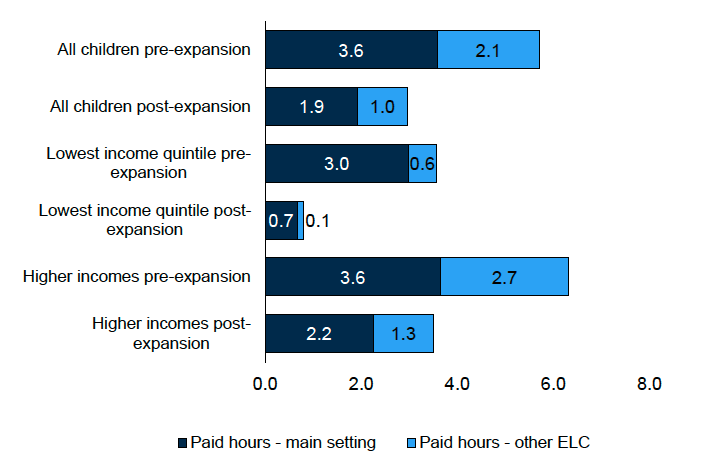
Figure 3.2 shows the average number of hours of ELC that were paid for, pre- and post-expansion, for all ELC Leavers (including those whose ELC was not paid for), as well as for those in the lowest household income quintile and for those from other households. This shows that all income groups made savings post-expansion, but it was the lowest income group who proportionally made the largest savings, as they paid for less than a quarter of the hours they had done pre-expansion, compared with just over half the hours for other income groups.
All formal ELC
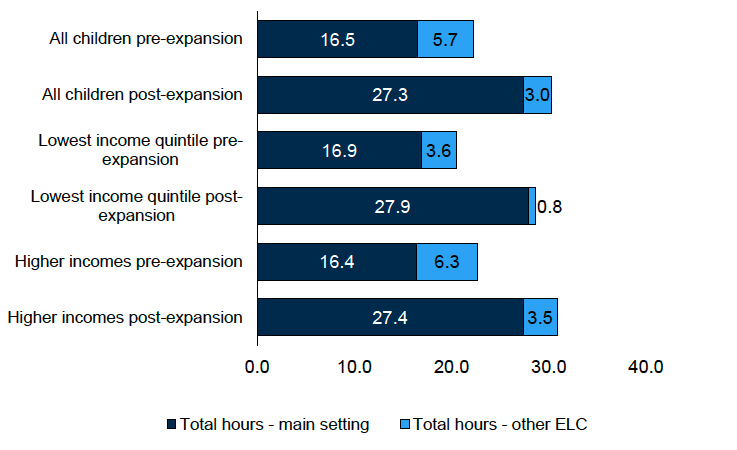
Figure 3.3 combines hours of ELC at both the main and any additional settings to clarify the change in total hours of ELC used. It shows that the total amount of ELC used has increased by 8 hours a week on average, from 22.2 hours pre-expansion to 30.3 post-expansion, with a fall in the proportion that was unfunded from 26% to 10%.
For both the low- and the higher-income groups, the increase in total hours was the same (8 hours a week). The proportion that was unfunded fell from 17% to 3% for those in the lowest-income quintile, compared with a fall from 28% to 11% for other children.
Informal childcare
Pre-expansion, 39% of families used some form of informal childcare for their four- or five-year-old (ELC Leaver), predominantly the child’s grandparents. Post-expansion this decreased to 30%. The proportion using informal childcare fell both for those in the lowest income group (from 24% to 9%) and for those in other income groups (from 44% to 33%). Patterns for other groups were similar, with a fall from 42% to 31% for the Comparator 3s, and a fall from 24% to 15% for the Eligible 2s.
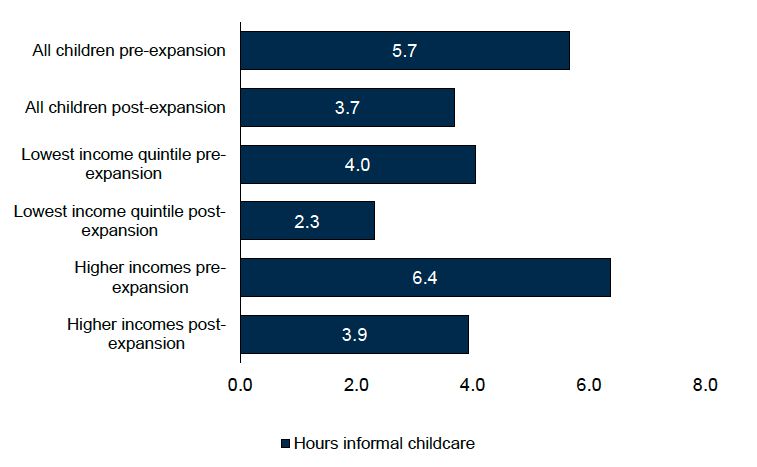
The mean hours of additional informal childcare did not change much post-expansion among those who used informal childcare (14.5 hours a week pre-expansion and 12.5 post-expansion for the ELC Leavers, and similar figures for the Eligible 2s and Comparator 3s). Figure 3.4 shows the mean hours of informal childcare for all ELC Leavers, including those who did not use informal childcare. The falls shown here for all groups largely reflect the falls in the proportion using any type of informal childcare.
Summary and discussion
Data on mean hours of funded ELC show that most children appear to be receiving their increased allocation of hours post-expansion, although mean hours have not increased by quite as much as the expansion from 600 to 1140 hours might suggest. This may be due to more families spreading the hours across the whole year rather than being used in term-time only, although data from SSELC cannot tell us whether this is the case.
With the expansion, fewer families of ELC Leavers were paying for additional hours either at their main ELC setting or at other settings, and the mean number of additional hours paid for decreased. Savings by not spending on ELC were proportionally largest for the lowest income group, although all groups were paying for fewer hours following the expansion. Falls were also seen in the use of informal childcare following the expansion, for the ELC Leavers, Eligible 2s and the Comparator 3s.
In total, ELC Leavers were spending an average of 34 hours a week in some form of ELC or childcare post-expansion, 27.3 hours of funded ELC, 3.0 hours of unfunded and 3.7 hours of informal childcare. This is six hours more than pre-expansion, when the averages were 16.5 hours of funded ELC, 5.7 of unfunded and 5.7 of informal. It should be noted, however, that these figures mask the wide variation in hours, with the majority using only funded hours, both pre- and post-expansion. For the minority of families, the additional hours of ELC or informal childcare potentially open up more time for work, study or training and contribute to family wellbeing, but reduce the time children spend with their parents. Some families who would have paid for additional ELC in the absence of the expansion have instead used only the additional hours of funded ELC. For these children, we may not expect to see any change in child outcomes due to the expansion of funded ELC discussed in the next chapter. Where children are accessing additional ELC or informal childcare, there may be both positive and negative effects of this on child outcomes. Most of the analysis in the next two chapters is based on all children receiving funded ELC, and does not differentiate between those receiving only funded hours and those receiving more than this. However, the groups using only funded hours, pre- and post-expansion provide the clearest data regarding the effects of the expansion. We will specifically consider these groups in some of the regression analyses discussed.
Contact
Email: socialresearch@gov.scot