Scottish Sea Fisheries Statistics 2022
A National Statistics publication that provides detailed information on the tonnage and value of landings, fishing vessel characteristics and employment. Detailed supplementary excel tables and a pdf version of the publication are available in supporting documents.
Part of
5 Employment
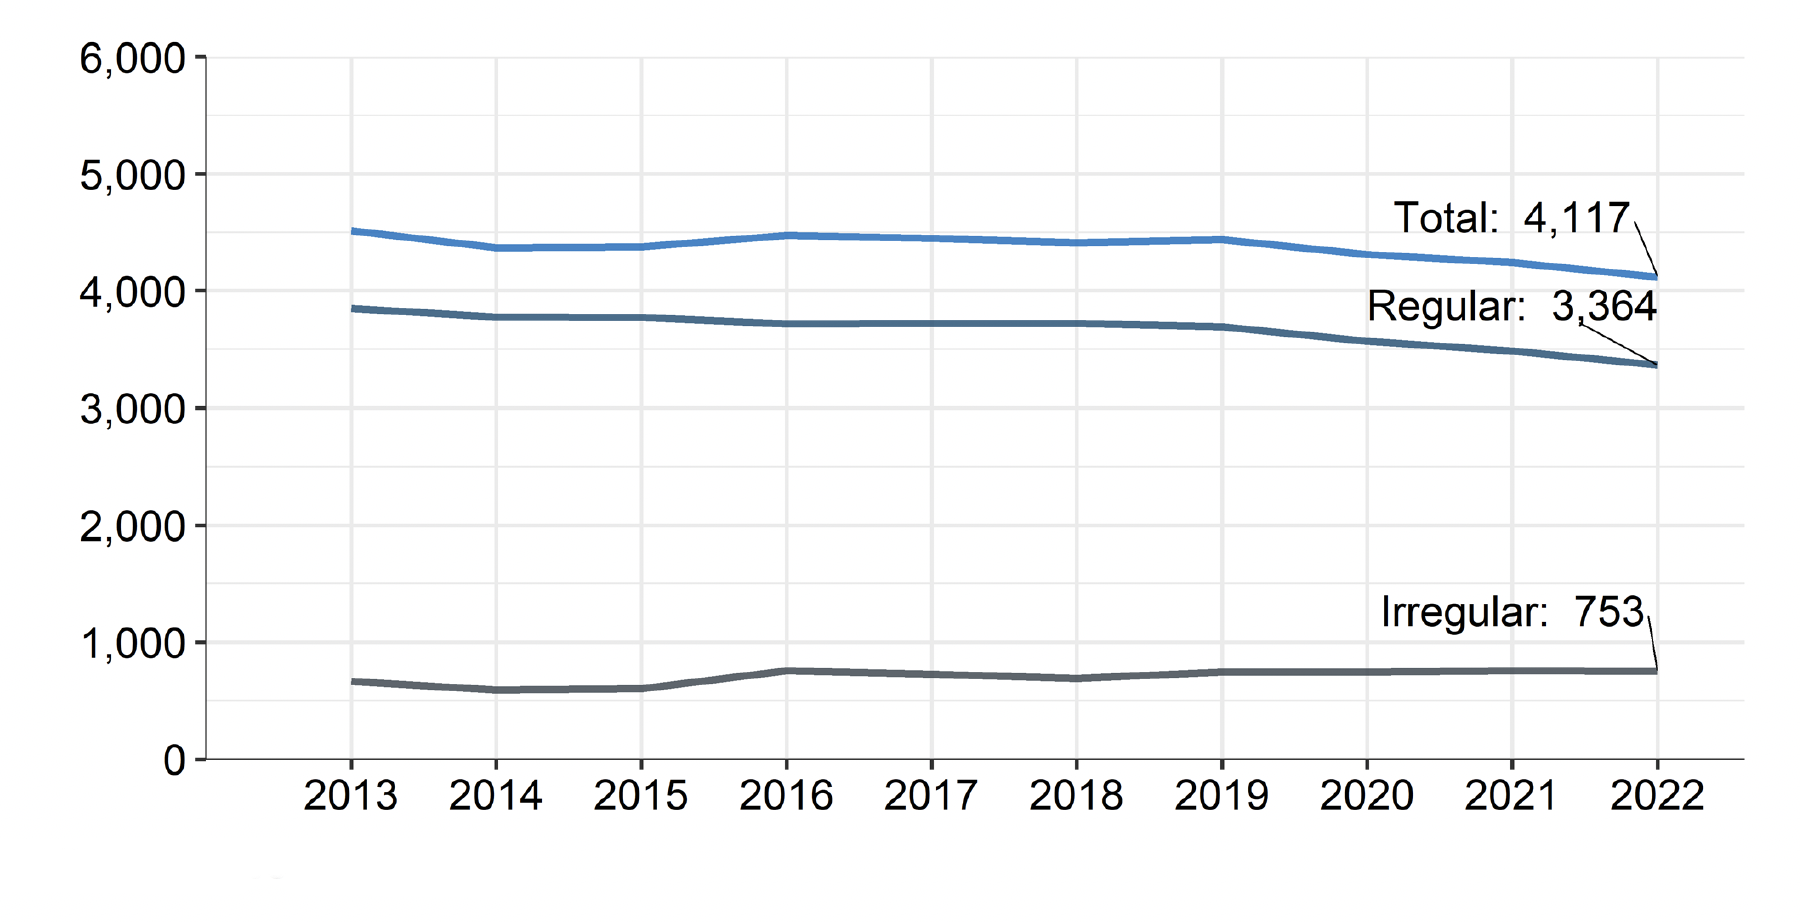
In 2022, 4,117 fishers were working on Scottish vessels, representing 0.2 per cent of the total Scottish labour force[10]. The number of fishers working on Scottish vessels fell by three per cent (down 124 fishers) between 2021 and 2022 (Table 44 and Chart 11).
Although employment in the fishing fleet is a small percentage of total employment in Scotland, employment in fishing accounts for a higher percentage of employment in island communities (Shetland five per cent, Orkney two per cent, Na h-Eileanan Siar two per cent) and in Argyll and Bute (one per cent) (Table 46).
Fraserburgh is the district with the largest number of fishers (760) accounting for 18 per cent of the total in 2022. It is also the district with the largest number of fishers who work regularly, with 664 regularly employed fishers. Shetland had the most irregular fishers (188), accounting for 25 per cent of the total fishers in this category.
Chart 11. Since 2013, employment on Scottish fishing vessels has fallen by nine per cent. There was a 13 per cent decrease in regular employment whilst irregular employment increased by 13 per cent since 2013.
Number of fishers working on Scottish vessels, 2013 to 2022.
Data source: Table 44.