Scottish prison population projections
Presents the first projections to be published since the COVID-19 pandemic began. These projections have been produced using ‘microsimulation’ scenario modelling which simulates prison arrivals and departures and estimates the number of individuals in prison on a particular date in the future.
5 Introduction to Prison Population Projections
Pre-pandemic ARIMA Prison Population Projections
Prior to March 2020, Scottish Government prison population projections were produced by applying time-series based forecasting methods (ARIMA) to population trends, a technique used commonly in other European jurisdictions. ARIMA projections are based on historical trends in the average monthly prison population and indicate the likely trajectory of the population size should trends in crime and justice remain stable. As ARIMA forecasting extrapolates from past trends, it cannot model changes to the prison population that are not already reflected in past trends. Hence, following the rapid, large-scale changes occurring in the criminal justice system from March 2020 as: i) a direct result and ii) response to the COVID pandemic, ARIMA modelling was shown to be no longer suitable for providing meaningful or accurate prison population projections.
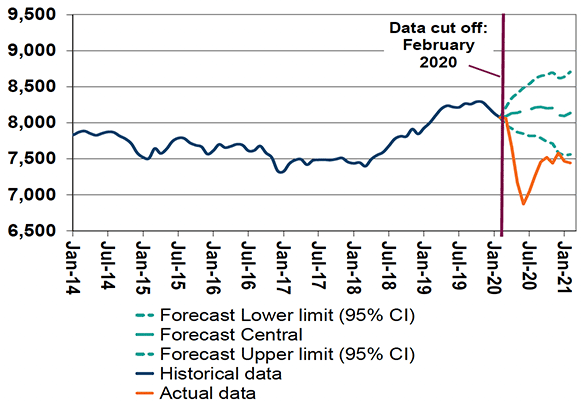
Figure 8 shows results of ARIMA based prison population projections for the period March 2020 to February 2021, alongside actual prison population figures for the same period. It is clear from the figure below that the actual prison population was substantially below the lowest point of the range of the ARIMA based projections. As such, when there are large scale shocks to the system, as occurred during the pandemic, the ARIMA method has been shown to provide unreliable projections, as it assumes historical trends largely continue to hold true.
Post-pandemic Microsimulation Modelling for Prison Projections
There was a need to develop an alternative to the ARIMA model, which would account for how system activity and flows might change during recovery, to estimate potential short-term changes in the prison population. Therefore "microsimulation scenario" modelling was developed which simulates the expected number of arrivals and departures to help estimate the number of individuals in prison (remand, sentenced and overall populations) on a particular date in the future.
In the short/medium term, whilst the scheduled trials backlog[22] remains high, the factor expected to have the greatest influence on changes to the size of the prison population is national court capacity. Therefore, to estimate flows in the coming months, such as case conclusions, the "microsimulation scenario" model uses the planned levels of court capacity at different stages (pre-trial / trial) in both summary and solemn courts. This approach can be adapted to sudden changes in the system, such as uplifts in court capacity, because it is not reliant on forecasting based solely on past trends.
Overview of the microsimulation model's structure
The microsimulation prison projection model uses mathematical simulations to approximate the processes whereby individuals move into and out of prison. Information on the current prison population and the number of individuals attending court hearings who may receive custodial sentences is used to support the modelling. The individuals accused of crimes who go on to receive custodial sentences are subject to court diets beforehand, hence data on recent court activity helps inform estimates of the future prison population. Modelling is used to make short/medium term forecasts of what may happen to the prison population, whilst accounting for some uncertainty.
It should be noted that the model does not currently simulate flows for different Sheriffdoms or crime-types, so sub-national and crime-based trends are not explicitly modelled.
In the microsimulation model, prison population data is used to set the initial size of the different prison sub-populations, such as sentenced and remand. Data from prisons also informs the arrival dates and sentence lengths for individuals used in the model. The microsimulation model then draws on estimates/forecasts of each change of status (e.g., remand, sentenced) often derived from court capacity assumptions; these assumptions tend to be the most important determinants of the flows between different prison subpopulations in the short/medium term. Simulation assumptions regarding the proportion of individuals in the model who receive prison sentences and the duration of their sentences are informed by historical disposals and hearings data. The model conducts a large number of simulations to enable calculation of population mean and range limits for each scenario.
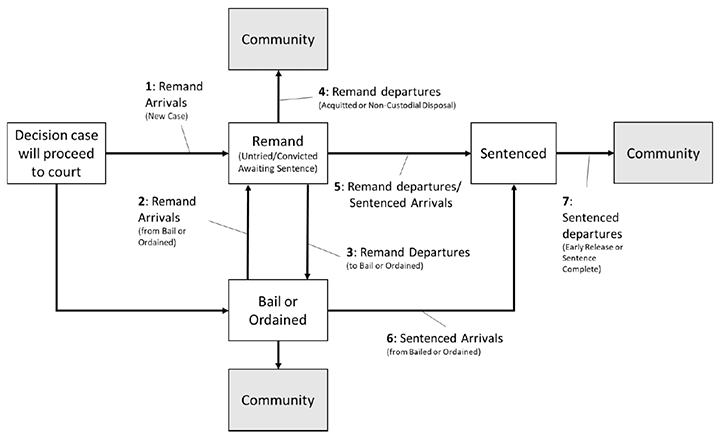
Figure 9 summarises the transitions between legal status amongst the remand/bail/ordained/sentenced sub populations, as well as the various points in court proceedings and prison sentences at which those subject to court hearings may transfer outside the court and prison system into the community. In the microsimulation model some of the sub groups shown in Figure 9 are aggregated; for example, all remand arrivals are considered as a single group, regardless of whether they were previously bailed or ordained.
Microsimulation Model Limitations
The model relies on the availability of a large amount of frequently refreshed high-quality data about court activity and prison populations, some of which can be resource intensive to obtain and process.
The model does not currently simulate flows for different crime-types, so crime-based trends are not explicitly modelled. However, there are plans to develop the model further and include case-mix in future modelling.
Model Assumptions and Scenarios
The scenarios on which the projections are based can feature different suppositions about how trends in the court system might change, including: assuming continuation of current court capacity, increased court capacity, normal remand/bail mix and prioritisation of remand case progression through courts.
The most recent scenarios for prison population estimation include the planned changes to court capacity from April 2023. Furthermore, to understand how sensitive the prison population may be to variations in court throughput compared to historical rates, three variations have been included in the modelling process, central, high, and low. The central court throughput scenario variant assumes that the conclusions per courtroom will be similar over the next few months to the average level between April 2022 and March 2023. The "high" scenario assumes the average case throughput per court will be slightly greater than it has been over the same period, and the "low" scenario assumes that the average case throughput per court will be slightly smaller.
Since the rate of progress of the justice system's recovery (e.g., rate of reduction of scheduled trials) impacts the model's assumptions and longer-term predictive power, the projections cover a limited period, only up to September 2023.
Model Quality Assurance
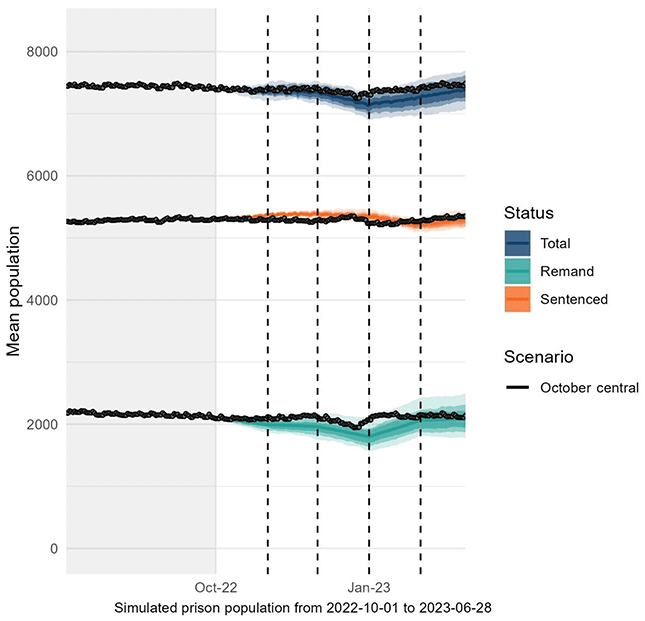
The modelling scenarios from previous months can be validated against the actual population data to check the accuracy of the projections and confirm the model continues to be suited to forecasting over the medium term. Figure 10 shows the October 2022 central projection from the microsimulation, based on prison population and courts data up to the end of September 2022. Even after accounting for a wide variety of uncertain dynamics in the system, it may be seen in Figure 10 that the projected levels of remand, sentenced and total populations reasonably accurately aligned with the actual numbers, in light of the December 2022/January 2023 seasonal reduction in court days.
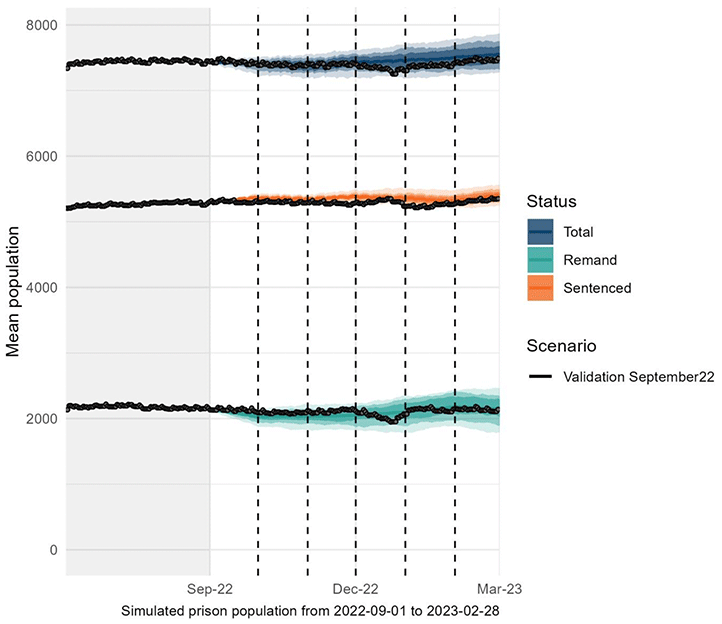
To check the model further, back-casting is used to retrospectively compare the actual prison population for the past few months against a projection generated by the model based on actual monthly court throughput. The back-cast eliminates uncertainty about the majority of the assumptions, so if there was a difference between the back-cast and the actuals it may indicate technical deficiencies in the model. The recent back-cast projections presented in Figure 11, show that the back-cast from October 2022 to February 2023 has remained largely accurate over the time period covered.
Contact
Email: justice_analysts@gov.scot