Scottish Natural Capital Accounts 2022
This report estimates quantity and value of services supplied by Scotland's natural capital.
6. Asset valuation
Here we present the asset values of Scottish natural capital by service. These values are estimated by capitalising the total annual flow of services from the natural resource that are expected to take place over a projected period, known as the asset life. The annual environmental service flows provide the basis for these projected flows. This is a method known as Net Present Valuation (NPV), which is explained in more detail in the methodology section.
Some of the environmental services presented in this article are produced from renewable resources whose stock is not exhausted over time, such as Scottish woodland delivering carbon sequestration. For these renewable resources, a 100-year asset life has been assumed. The non-renewable abiotic resources presented in this article are minerals and fossil fuels, which have an assumed asset life of 25 years.
In 2018, outdoor recreation was equivalent to 30% of the value of Scottish natural capital assets, which in total equalled £62 billion. The second and third largest services were fossil fuels, making up 25% of Scottish natural capital assets, and carbon sequestration, making up 18%, respectively. This is the first year since 2015 that fossil fuels did not constitute the single largest service in terms of asset value.
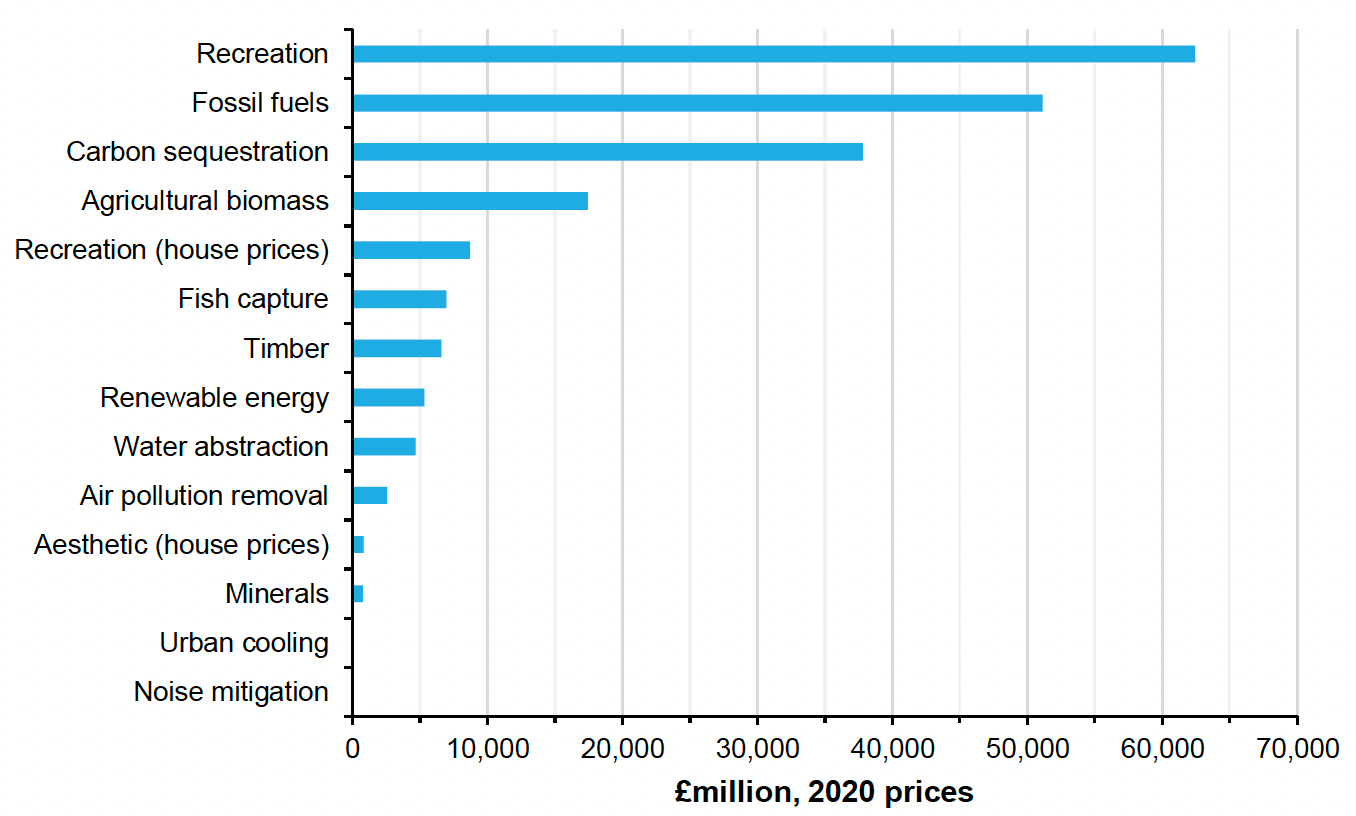
Source : Office for National statistics
Notes:
1. Values for noise mitigation are from 2018.
2. Values for recreation and aesthetic (house prices) are from 2016.
The asset value of regulating and cultural services amounted to £113 billion in 2018, or 55% of Scotland's total quantified natural asset value.
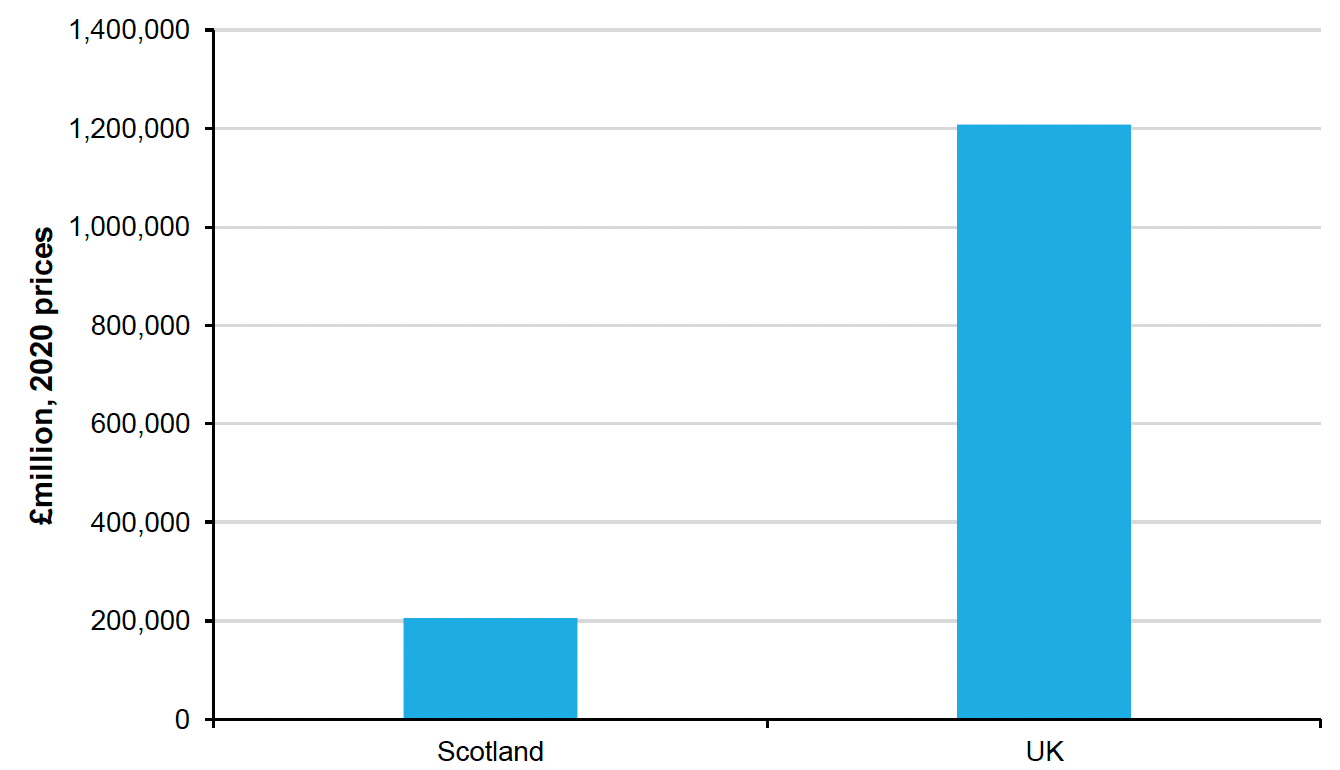
Source : Office for National Statistics
Scotland's contribution to the total UK asset value of each ecosystem service ranges from 0.5% (urban cooling) to 88% (fish capture). Scottish contributions to UK total asset values are particularly large across some provisioning services, with Scotland contributing 88% in fish capture, 86% in fossil fuels, 61% in timber and 58% in renewable energy.
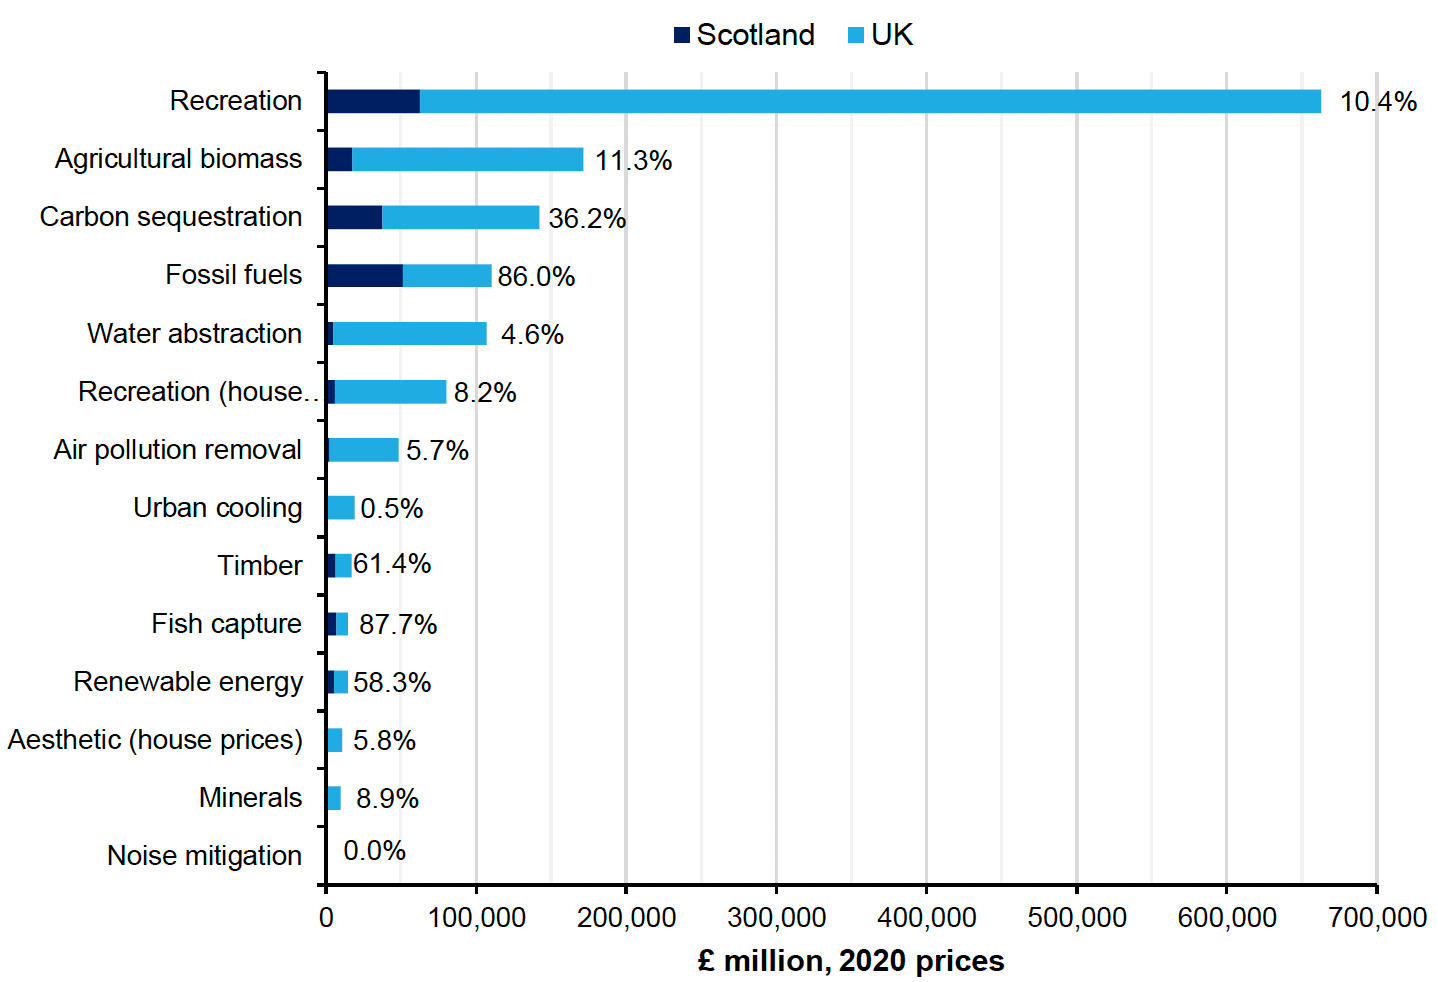
Source : Office for National Statistics