Scottish Natural Capital Accounts 2022
This report estimates quantity and value of services supplied by Scotland's natural capital.
3. Provisioning services
Provisioning ecosystem services create products that include food, water and materials. These are produced by nature, extracted and then used by society to support human life. The values of provisioning services are largely based on existing market prices. This means that the asset values of these services are subject to changes in market conditions, such as price changes. These price changes can often distort how natural assets are valued and therefore a wider view of our interrelated economy must be taken to understand asset value behaviour, including application of a four capitals approach. Using the provisioning services of a natural asset may affect its ability to provide regulating or cultural ecosystem services.
Provisioning services currently included in the Scottish ecosystem accounts are:
- Agricultural biomass
- Fish capture
- Timber
- Water abstraction
- Minerals
- Fossil fuels
- Renewable energy
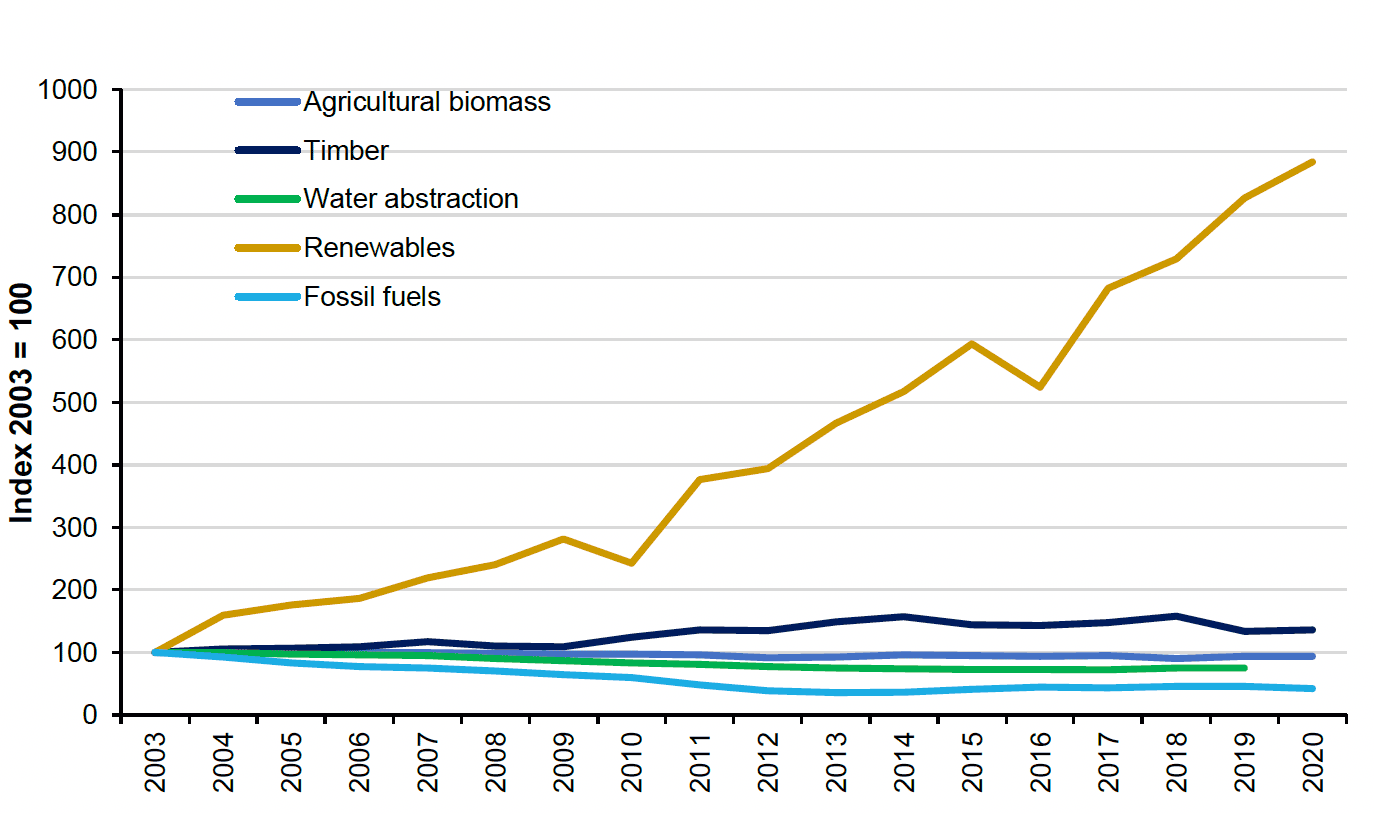
Source: Office for National Statistics, Scottish Government, European Commission: Scientific, Technical and Economic Committee for Fisheries, Forest Research and Scottish Water
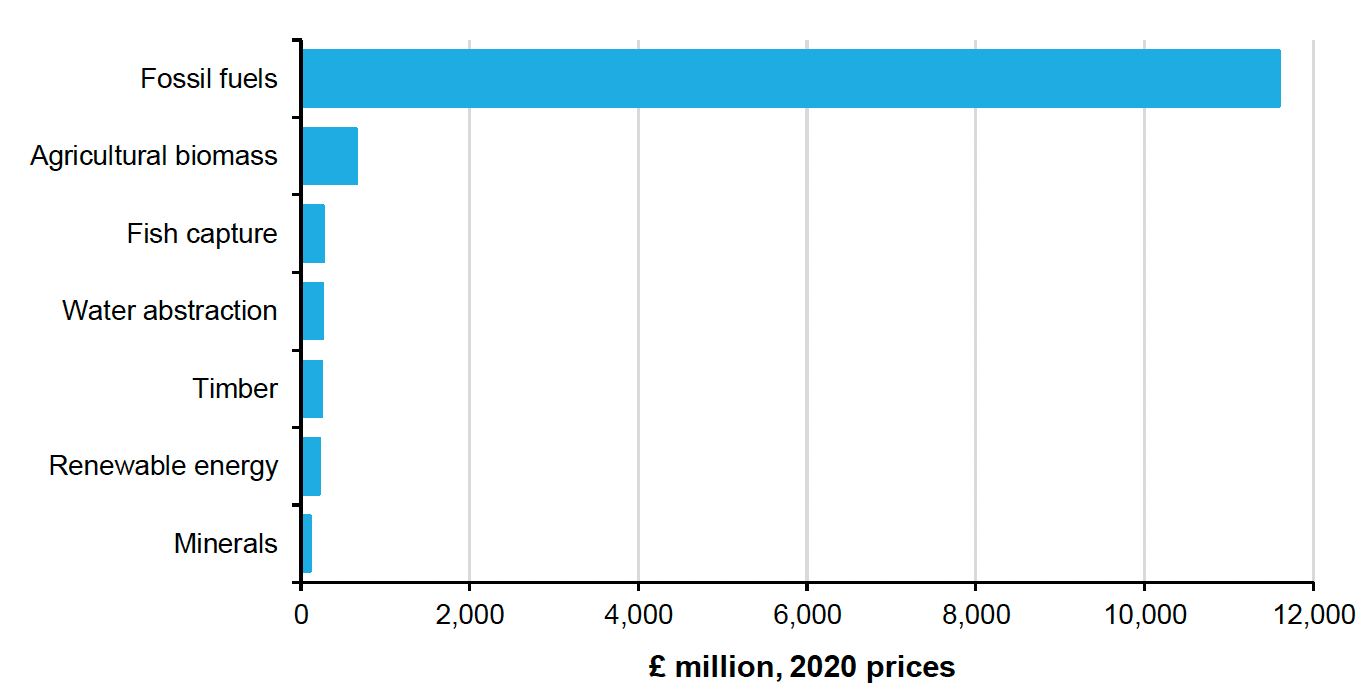
Source: Office for National Statistics
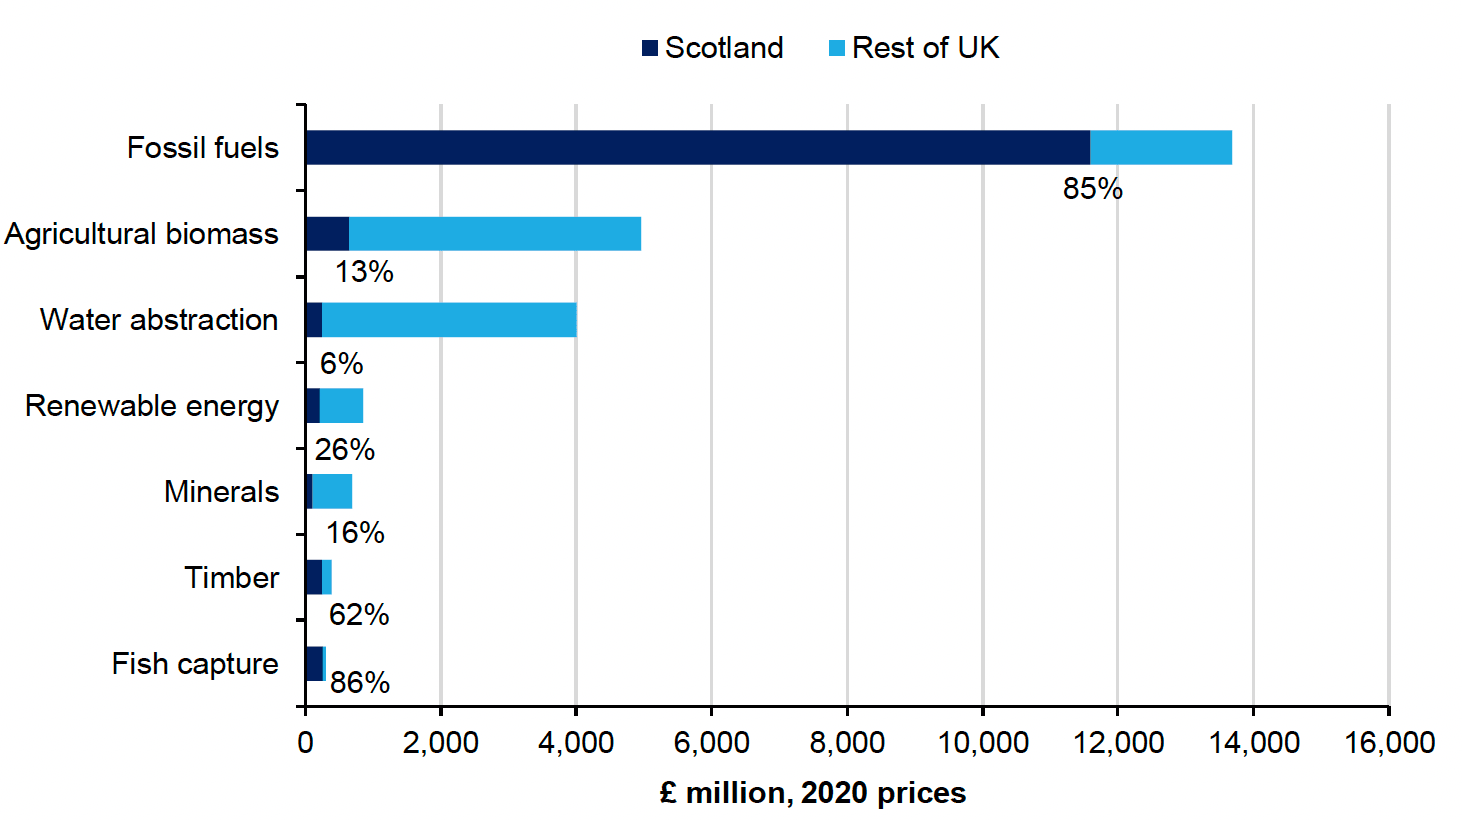
Source: Office for National Statistics and Scottish Government
Agricultural biomass
Agricultural biomass refers to the value of crops, fodder and grazing which support Scottish agricultural production. The food eaten by farmed animals is included in this analysis; however, the farmed animals themselves are not. It is assumed that farmed animals are produced assets rather than natural assets.
In 2020, Scottish agricultural biomass rose by 0.2% from 2019, totalling 16.1 million tonnes. Since its lowest value in 2018, the total volume of agricultural biomass in Scotland has increased slightly over the past two years. The 16.1 million tonnes of agricultural biomass produced in Scotland constituted 17% of the UK's total in 2020: its highest proportion since 2007.
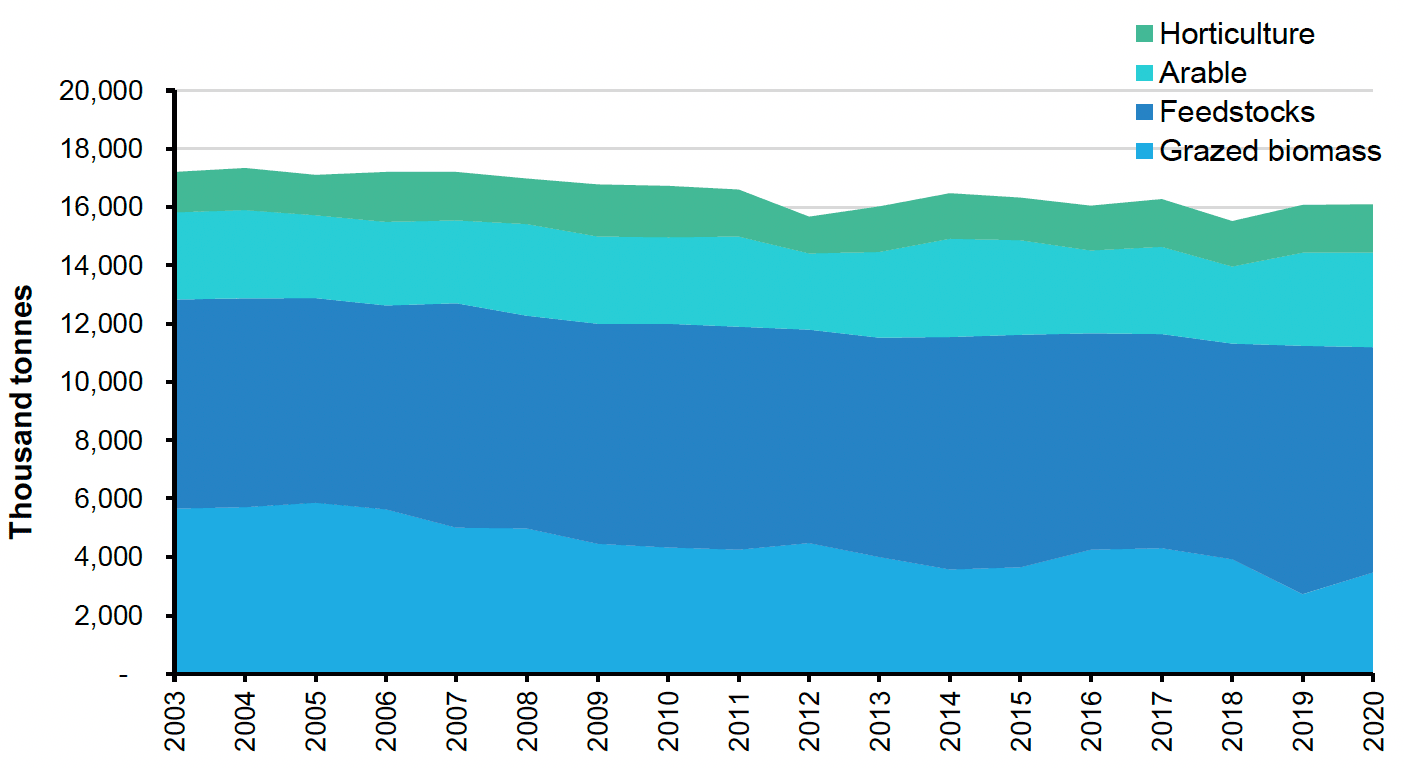
Source: Office for National Statistics and Scottish Government
Grazed biomass and feedstocks continue to account for the majority of Scottish agricultural biomass production. Grazed biomass made up 22% of the total Scottish agricultural biomass output while feedstocks comprised of 48% of total tonnage. Although grazed biomass output is up by 27% from its 2019 total at 3.5 million tonnes, feedstocks decreased by 9% from 2019, down from 8.5 million to 7.7 million tonnes.
Arable biomass, which includes the production of wheat and barley, has increased by 1% from 2019 to equal just over 3.2 million tonnes in 2020. The Scottish Agricultural Census 2020 reports that the area used to grow winter crops fell by 13% from 2019, most likely as the result of wet weather conditions at the start of 2020 making planting and growing difficult. Correspondingly, winter barley and wheat suffered 21% and 14% falls in output, down to 314,000 and 802,000 tonnes, respectively. However, a dry spring resulted in increased spring planting, which saw a resulting 15% increase in spring barley and 19% increase in oats production, up to 1.8 million tonnes and 224,000 tonnes, respectively.
Previous Scottish natural capital accounts have provided resource rent annual valuations using the residual value approach. This is the surplus value to the agricultural industry after all costs have been considered. Estimated at an aggregate scale, it may include non-agricultural aspects of farm businesses. As part of our development, we will look at alternative measures of capturing food production value.
Using the industry residual value, the annual value increased by 15% to £651 million in 2018. The industry residual value for 2018 is the highest since its 2004 peak, at £651 million. Farm rent remains consistent across the time series, with its 2018 value at £246 million.
Fish capture
Fish capture includes the value of marine fish taken from Scottish waters. Scottish boundaries do not perfectly align with the geographical areas of fish capture statistics. For more detail on how fish capture across UK waters is estimated, see the Marine Management Organisation Exclusive Economic Zone Analysis and associated publications.
We have been working to improve our fisheries statistics and yet work is needed. We rely on a range of external sources, which all involve known uncertainties. For instance, Norway and Faroese landings are excluded from this analysis. The economic data are based on UK fleet data, which we also apply to foreign vessels that may face different costs and prices.
Aquaculture or farmed fish, like farmed livestock, have been removed from estimates as farmed fish are viewed as a produced asset and not a natural asset. For more information on the method please see the methodology section.
Source: Office for National Statistics, Scientific, Technical and Economic Committee for Fisheries, Seafish, Marine and Management Organisation
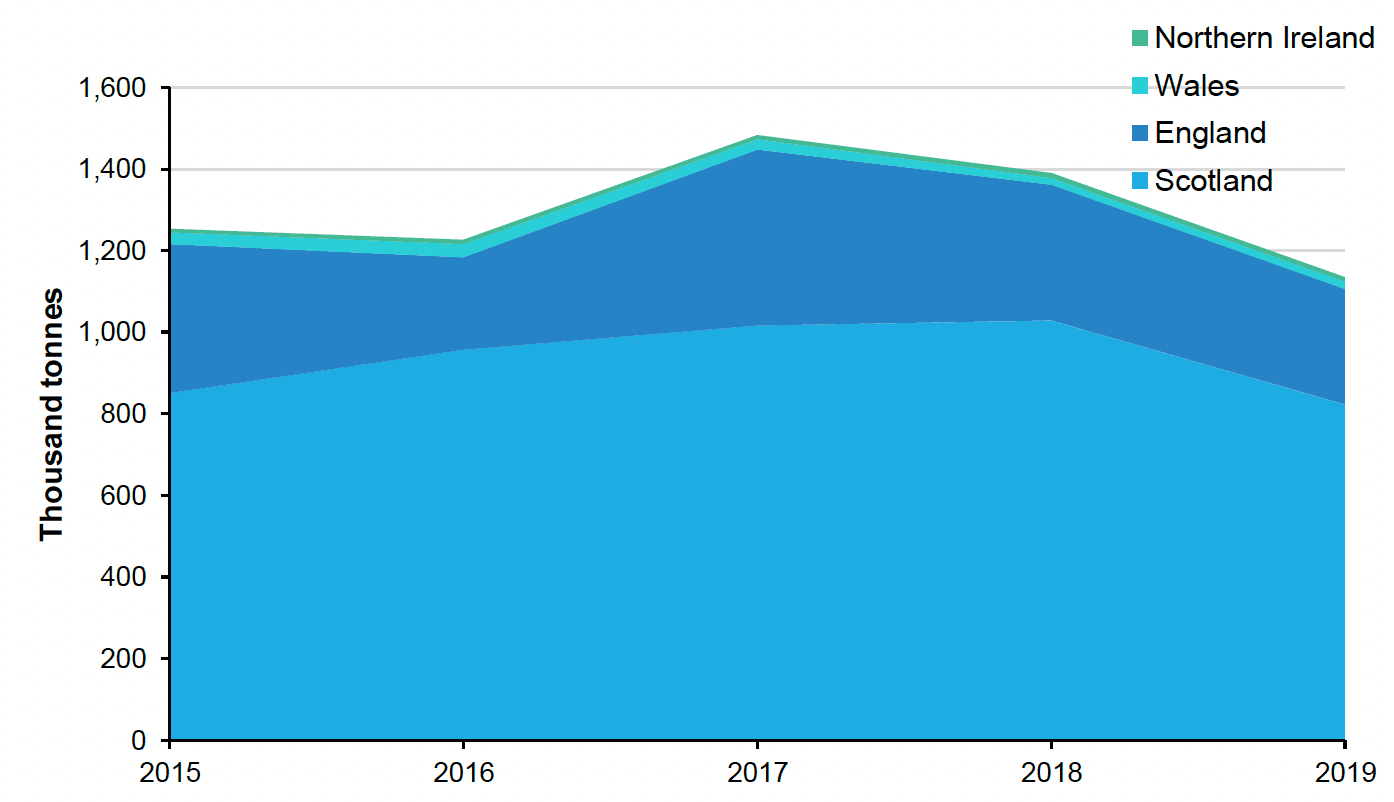
Scottish waters represent most of the fish capture from UK waters. The number of fish caught in Scottish waters declined by around 20% from 2018 to 2019. Prior to 2019, Scottish fish capture had not declined as much as other UK waters. However, the decline between 2018 and 2019 in fish captured in Scottish water was greater than the decline in English waters (-15%), Northern Irish waters (-6%) or Welsh waters (6%), which actually saw an increase.
A number of quota species saw a decline in their total allowable catch (TAC) between 2018 and 2019, such as the number of herring that could be caught in the North Sea falling 41%. This along with other market factors could be the reason behind the decline in the overall fish capture between 2018 and 2019.
Source: Office for National Statistics, Scientific, Technical and Economic Committee for Fisheries, Seafish, Marine and Management Organisation
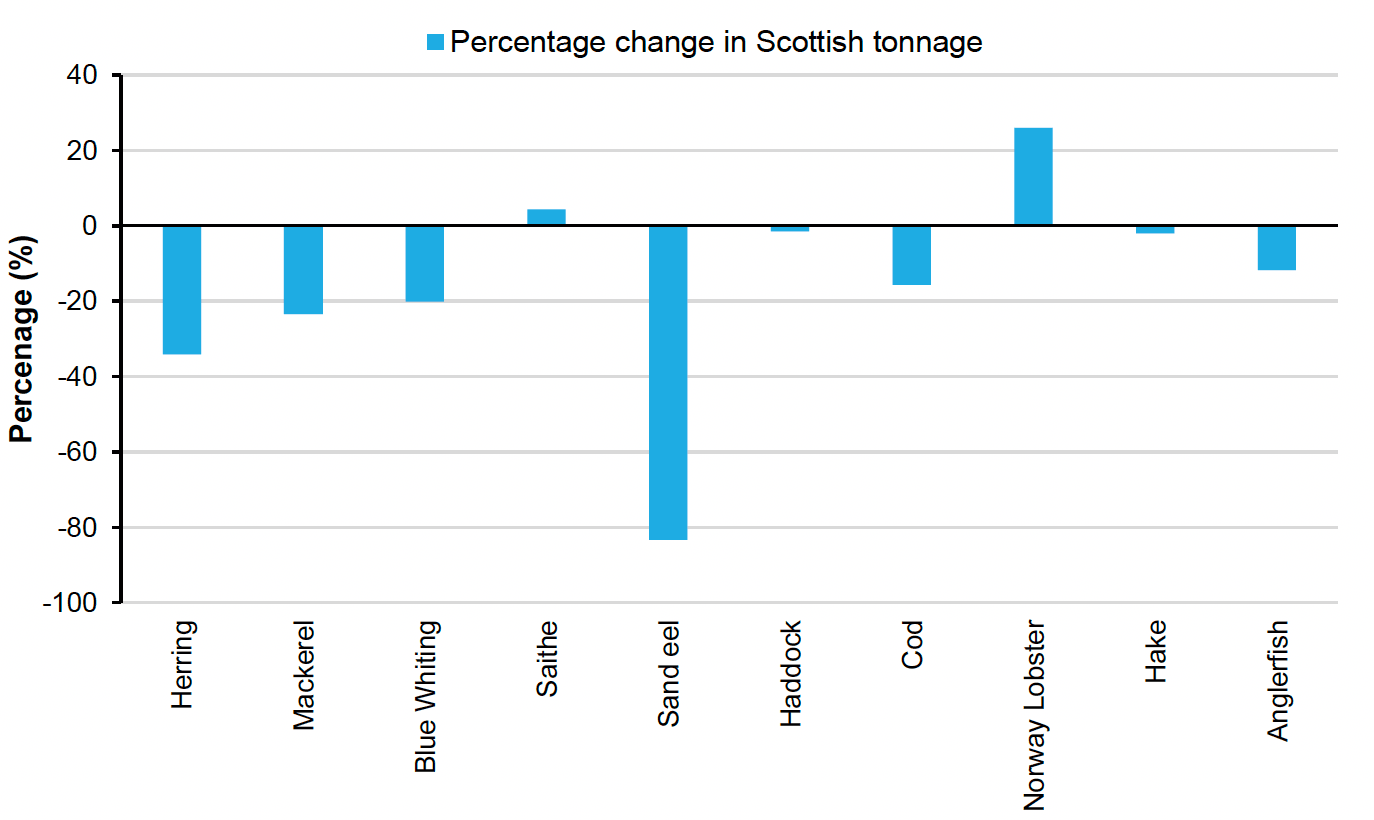
Making up 56% of overall catch tonnage in 2019, the two most caught species in Scottish waters (by tonnage) were herring and mackerel. Both mackerel (23%) and herring (34%) have seen a significant decrease in the overall catch between 2018 and 2019 in Scottish and UK waters. Sand eel catches in Scottish waters have declined by over 80% and are no longer one of the 10 highest volume species caught in Scottish waters.
For all fish species across different areas in UK waters, we estimate whether fishing is sustainable using The International Council for the Exploration of the Sea stock assessments. This does not include wider externalities from fishing. For each stock we check that fishing pressure is at or below levels capable of producing maximum sustainable yield. We also check if each stock's spawning biomass is at or above the level capable of producing the maximum sustainable yield. In Scotland, we can determine stock sustainability for 86% of the fish capture tonnage, leaving 14% as unknown.
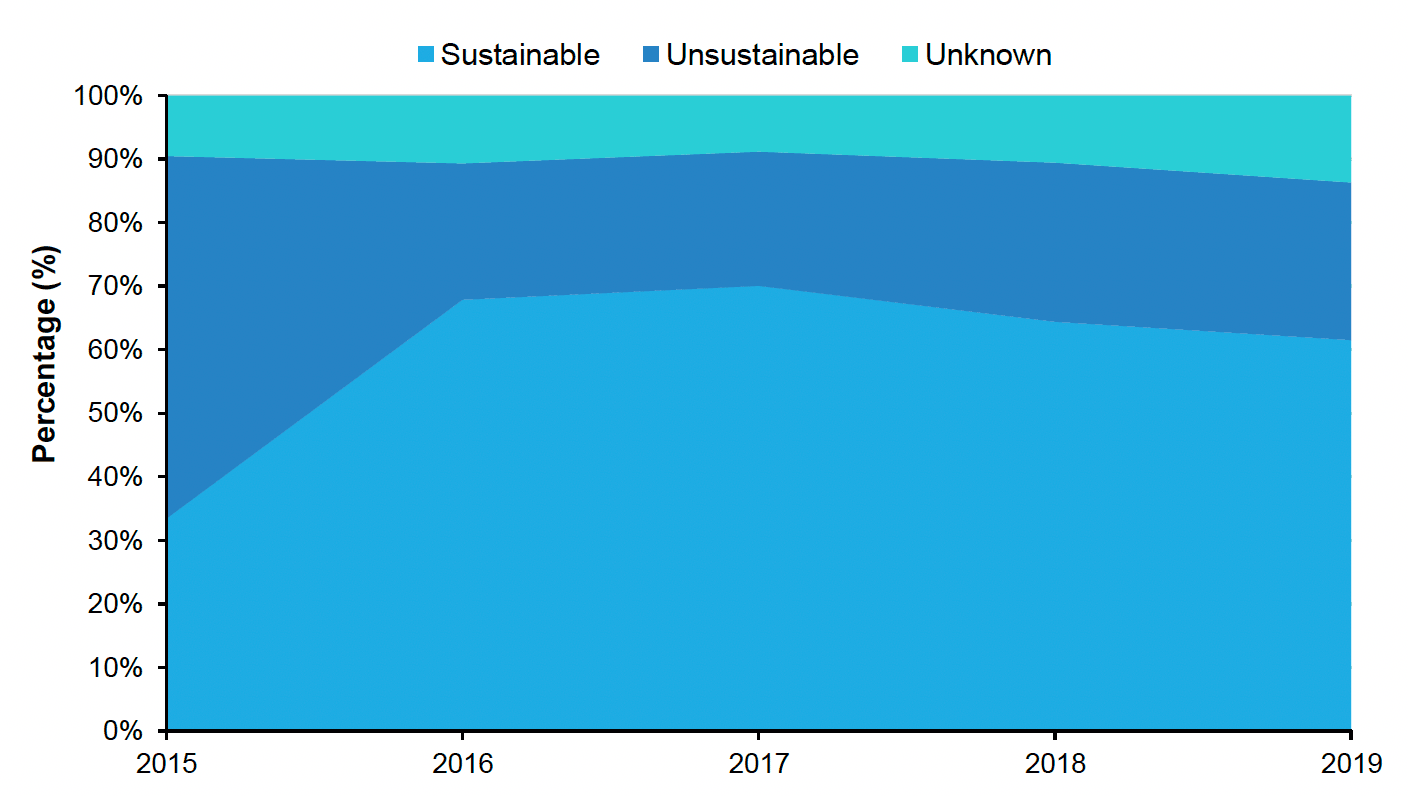
From 2015 to 2019, the percentage of sustainable fish capture increased from 33% to 62%. The percentage of fish caught, where sustainability is unknown, increased from 10% in 2015 to 14% in 2019. Within this time series, the largest year-on-year improvement in sustainable fishing occurred from 2015 to 2016, as a result of mackerel fishing becoming sustainable.
However, there was a fall in the proportion of fish that are sustainably caught in Scottish waters between 2018 and 2019 from 64% to 62%. This is partly due to a fall in the proportion of Norway lobsters that are caught sustainably from almost 100% in 2018 to only 40% in 2019. All mackerel landed and 99% of herrings landed in 2019 were caught sustainably in 2019. However, less than 1% of cod, blue whiting, edible crabs, anglerfish, lobster or saithe were caught sustainably in 2019.
Source: Office for National Statistics, Marine Management Organisation, Seafish, Scientific, Technical and Economic Committee for Fisheries and The International Council for the Exploration of the Sea
The value of fish capture is calculated using net profit per tonne (landed) estimates, provided by Seafish, for different marine species. Across the period 2015 to 2019 an average of 95% of the fish capture by tonnage had profit data.
Source: Office for National Statistics, Scientific, Technical and Economic Committee for Fisheries, Seafish, Marine and Management Organisation
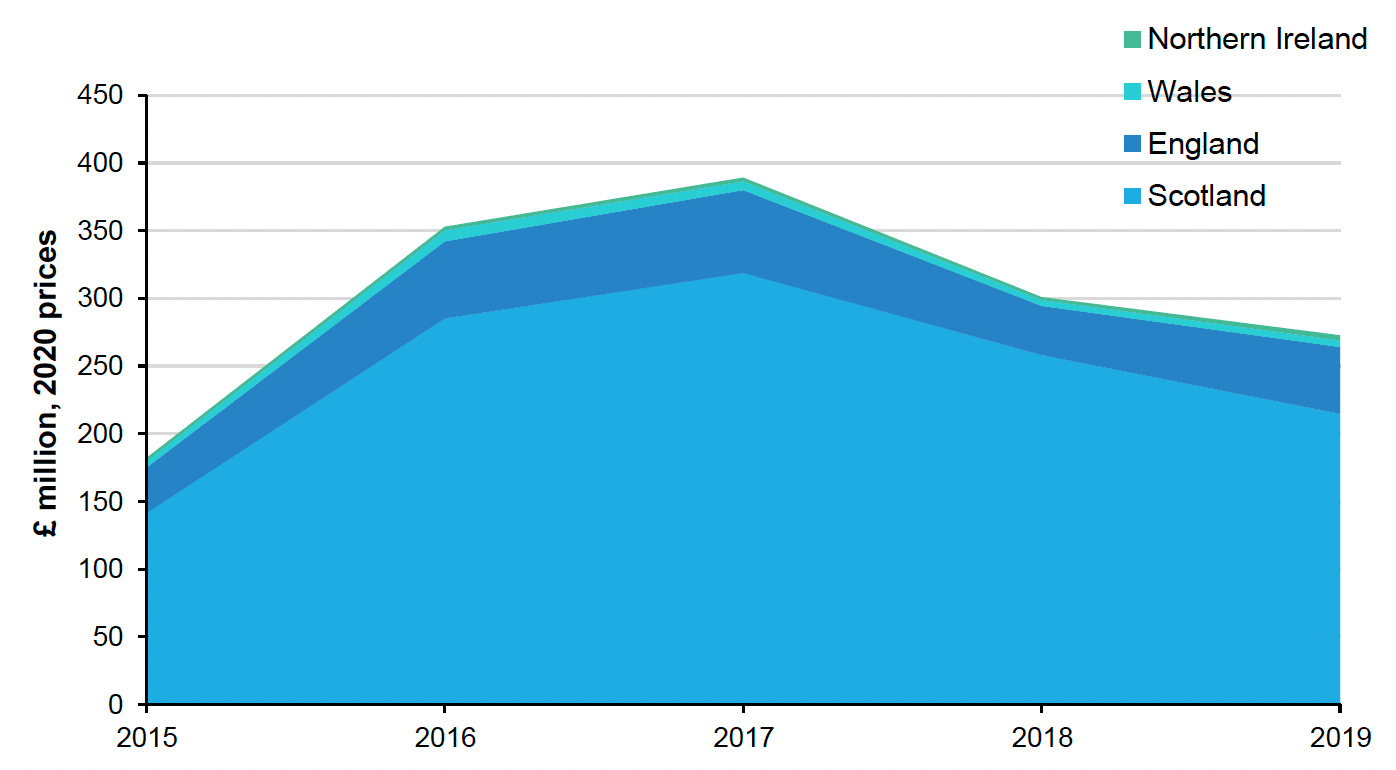
The net profit of both mackerel and herring fell by 24% between 2018 and 2019. However, Scottish waters represent even more of the UK by net profit than by tonnage as fish stocks are on average more profitable per tonne in Scotland (£261) than in the UK (£240). The contribution of Scottish waters toward overall net profit has grown year-on-year between 2015 and 2018 from 75% to 86%. However, the proportion of profitability has dipped in 2019 (79%) compared to 2018 (86%) due to the declining volume of profitable fish in Scottish water such as mackerel and herring.
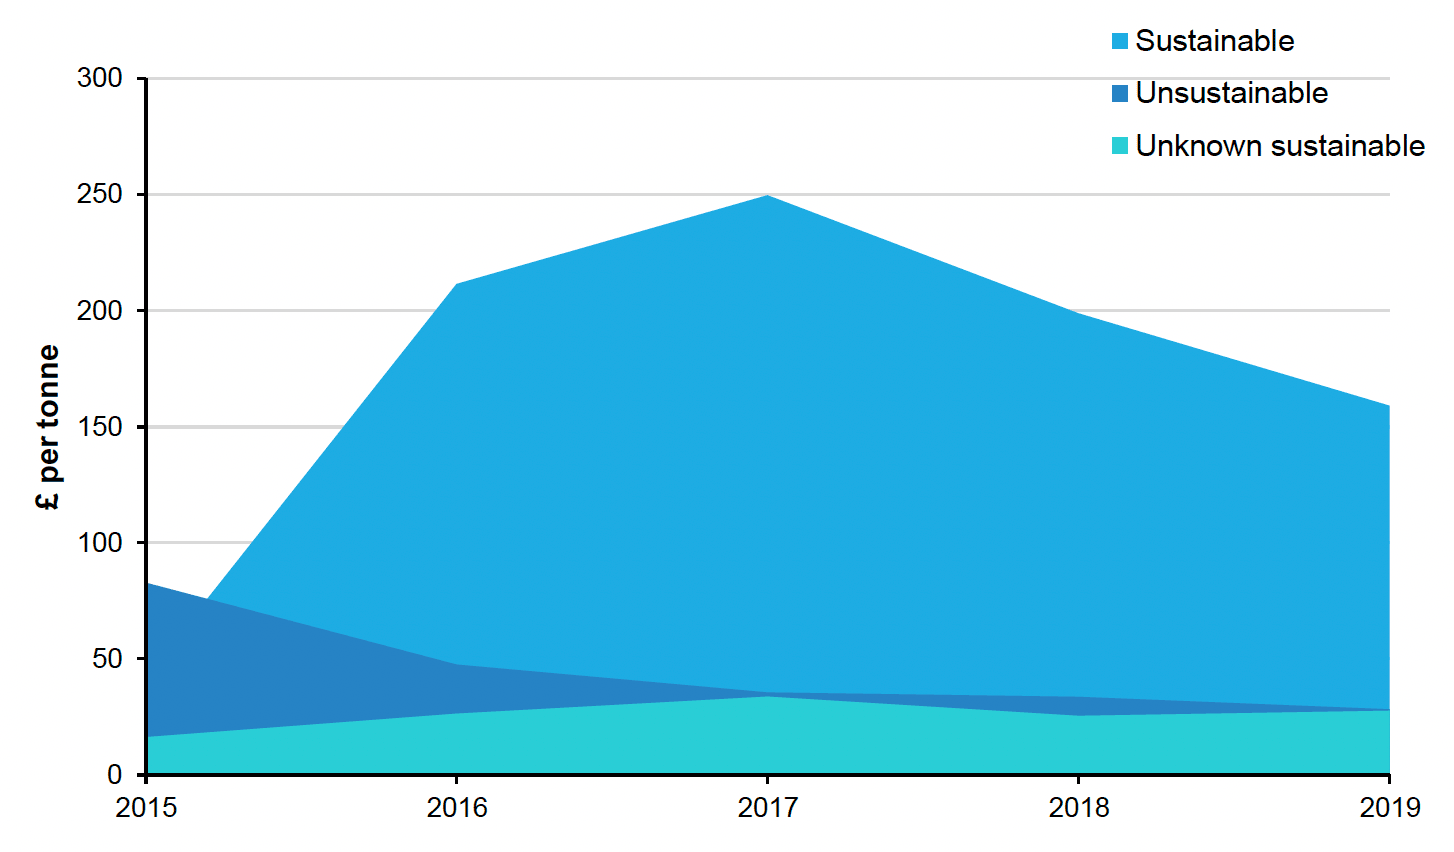
The value of Scottish fish capture provisioning services was £215 million in 2019, with an asset value of £5.7 billion.
In 2019, 74% of the value of fish capture from the Scottish EEZ was sustainable — around £159 million of £215 million. In 2019, 13% of Scottish landed fish value came from unsustainably sourced fish and 13% came from landed fish where sustainability is not known.
Source: Office for National Statistics, Marine Management Organisation, Seafish, Scientific, Technical and Economic Committee for Fisheries and The International Council for the Exploration of the Sea
Timber
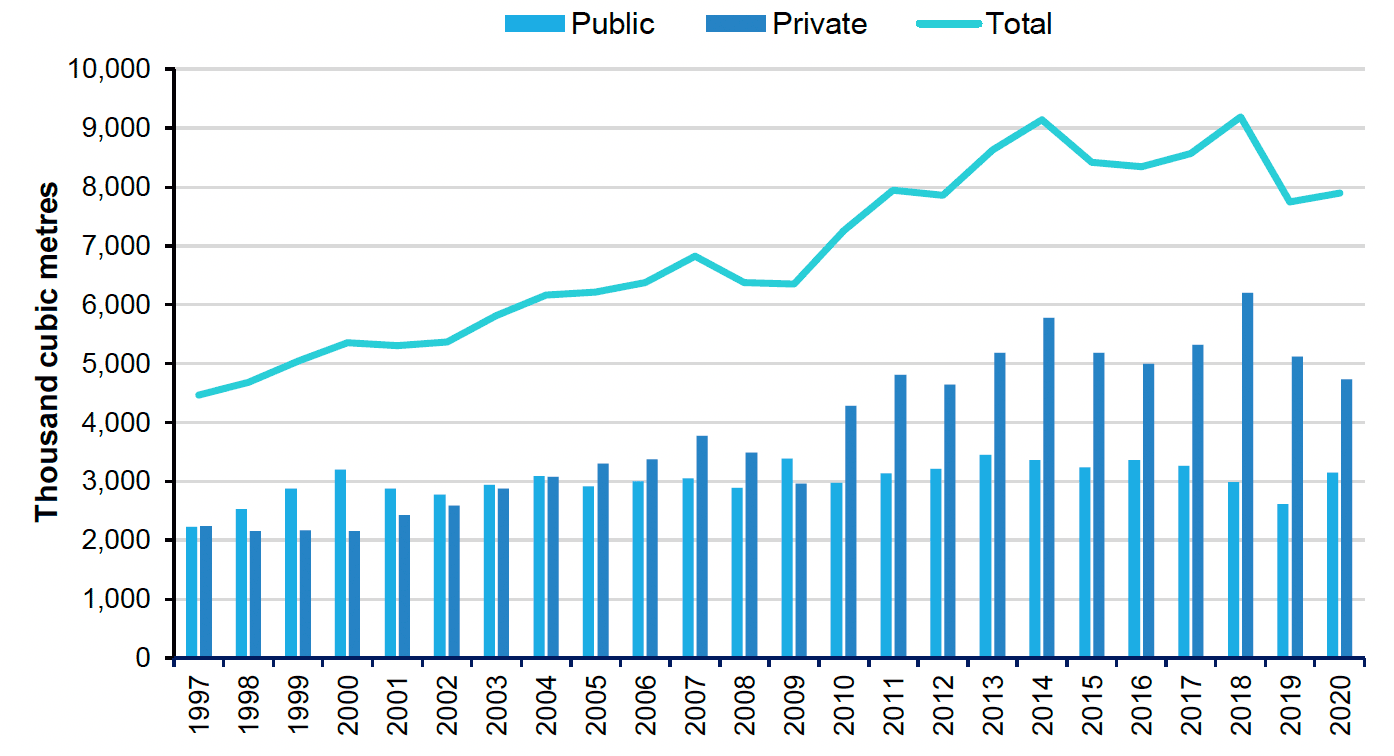
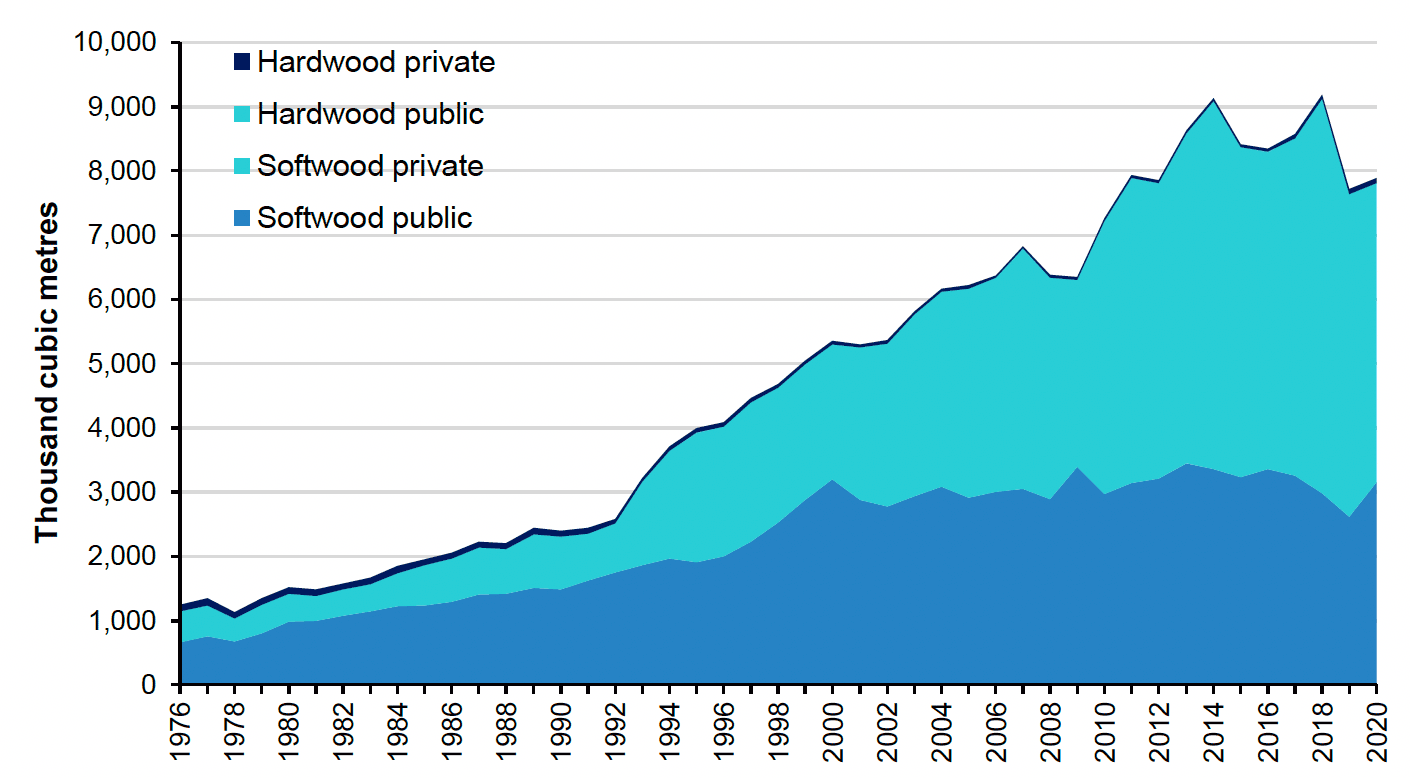
The total volume of timber production in Scotland has increased by 9% from 2010 to 2020. In 2020, nearly two-thirds of Scottish timber were produced by the private sector, increasing from around 40% of timber production 20 years prior. Across the time series, most of the timber production is softwood from coniferous trees such as spruce, pine and larch, which generally grow faster than hardwood species of broadleaved trees such as oak, birch and beech.
Source: Forest Research
An individual hectare of forest plantation that exclusively produces timber may not continuously provide a full range of additional ecosystem services. For example, once trees are felled, they cease to capture pollutants from the air. Following replanting, the carbon sequestration services provided by younger trees will be lower than for older growth. Some of the fellings store carbon longer term, for instance, in timber used for building material, while other carbon may be released into the atmosphere when wood is burned for heat or energy generation.
Source: Forest Research
Notes:
1. Public refers to Forestry and Land Scotland
Softwood production peaked in 2018 at 9,116,000 metres cubed of overbark (m³) but has since dropped by 14% to 7,815,000 m³ in 2020. Overall, hardwood production has increased in recent years. However, in 2020 hardwood production dropped marginally by 1% from its highest total in 2019, with 74,437 m³ produced.
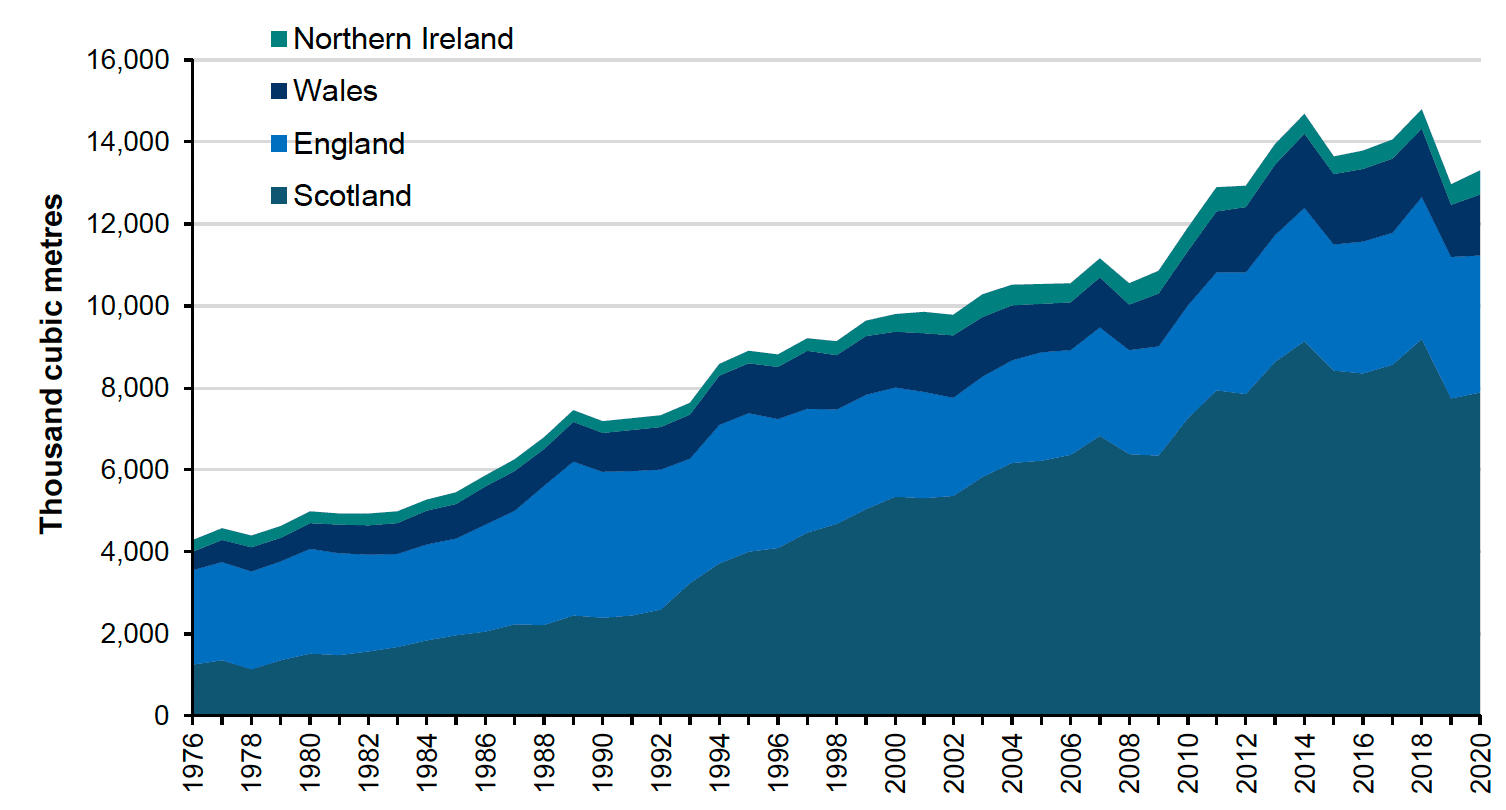
Relative to the rest of the UK, Scotland's timber production has increased substantially in recent decades. Scotland represented 59% of UK timber production in 2020, increasing from 55% in 2000 and 33% in 1990. Scottish forests make up 46% of the woodland area in the UK.
Source: Forest Research
The stumpage price is the price paid per standing tree for the right to harvest timber from a given area and is used to calculate the overall valuation for timber services.
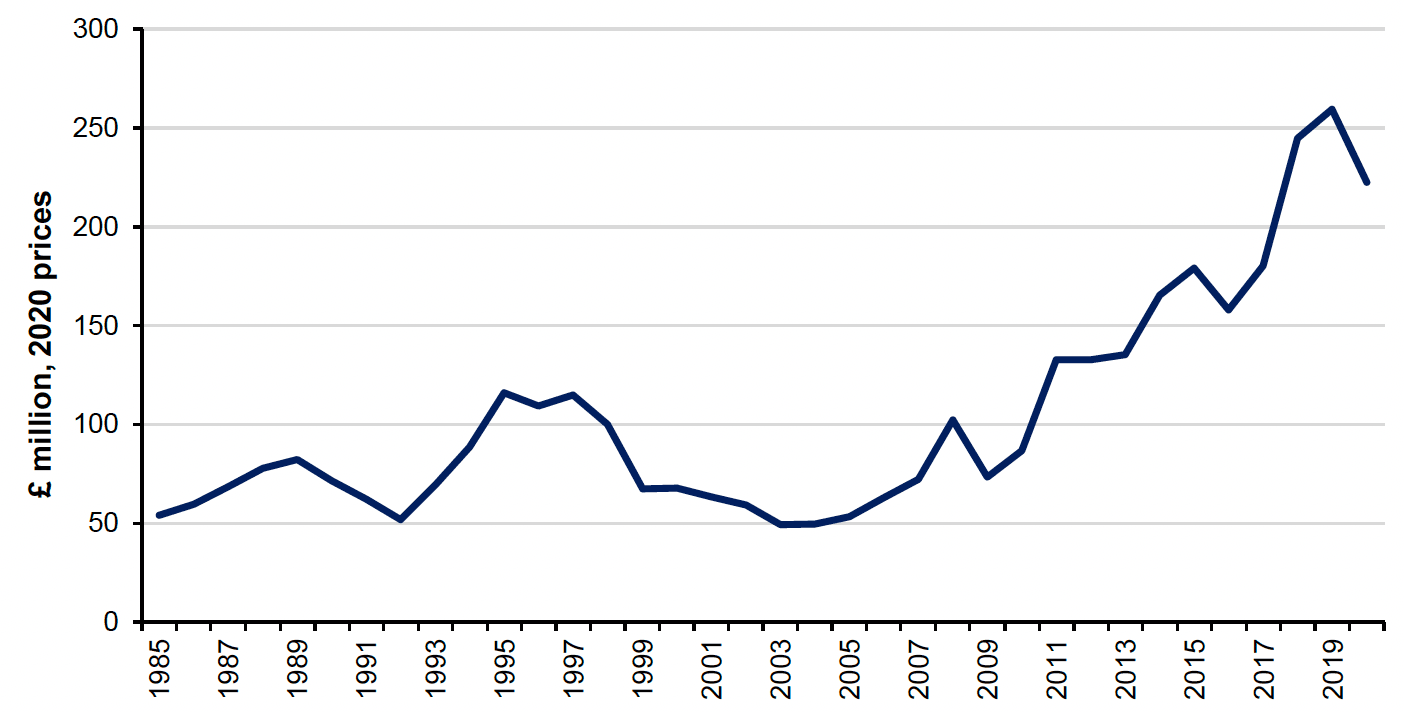
The timber provisioning service valuation has increased by 156% over the last decade, from £87 million in 2010 to £223 million in 2020. The increase in the annual valuation has been driven by a 9% increase in production and a 136% increase in stumpage price for the same period.
Although overall timber production in Scotland increased by 2% in 2020, Figure 13 shows a decline in annual value for the same period. This is due in part to a 16% decrease in stumpage price, down from £33.50 in 2019 to £28.22 in 2020.
However, it is worth pointing out that the September 2021 stumpage price has already recovered to £40.12 per cubic metre (2020 prices); so, while stumpage prices have risen reasonably steadily over the 15 years prior to 2019, prices have fluctuated more dramatically in recent years.
Source : Office for National Statistics and Forest Research
Scotland's forestry strategy states that between 2030 and 2050 there will be a decline in softwood availability, mainly due to the uneven age structure of the forest estate following high levels of planting prior to the 1990s. Scotland contributed 80% of the UK's new planting in 2020. Of the 49,500 hectares of new planting in Scotland between 2010 and 2020, 64% of this new planting was softwood (conifers) and 36% was hardwood (broadleaved).
Current and historic planting data informs forecasts of timber production, which we use to estimate the value of the timber provisioning service in the future. In 2020, the asset value of Scottish timber was £8.1 billion, contributing 61% towards the total UK value of £13.1 billion.
Water abstraction
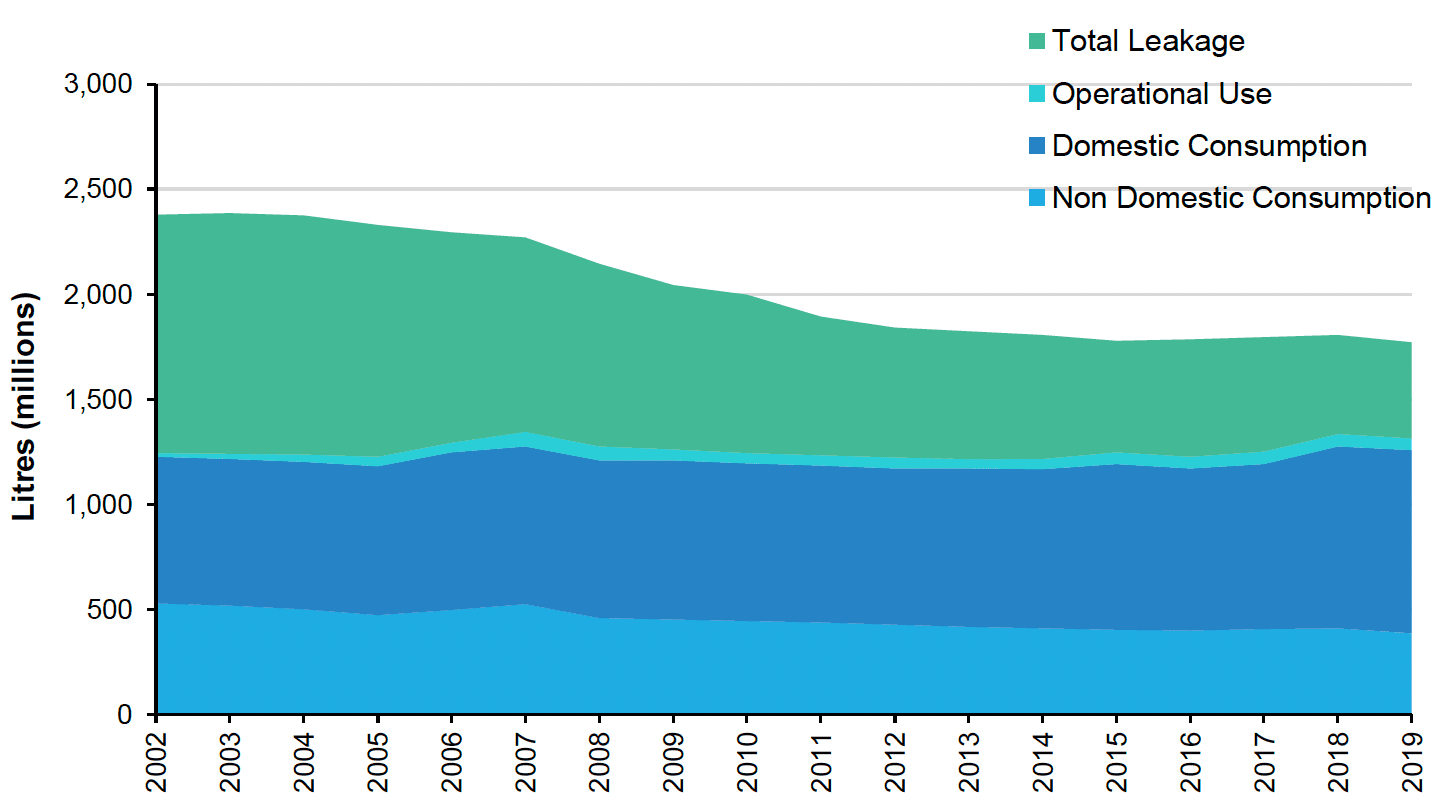
Water abstraction is the process of taking water from a surface source (such as a river, stream or canal) or from an underground source. Total water abstraction for public water supply between 2002 and 2019 has decreased by 25%, from 912 million to 683 million cubic metres, primarily due to a reduction in demand in water caused by less leakage. Of all water abstracted, on average 96% became treated water.
As illustrated in Figure 14 below, the greatest proportional change of treated water since 2002 has been in water leakage. Whereas water abstracted for domestic consumption, non-domestic consumption and operational use has remained relatively constant, leaked water has decreased substantially by 60% from 1,132 million to 454 million litres in 2019.
Source : Scottish Water
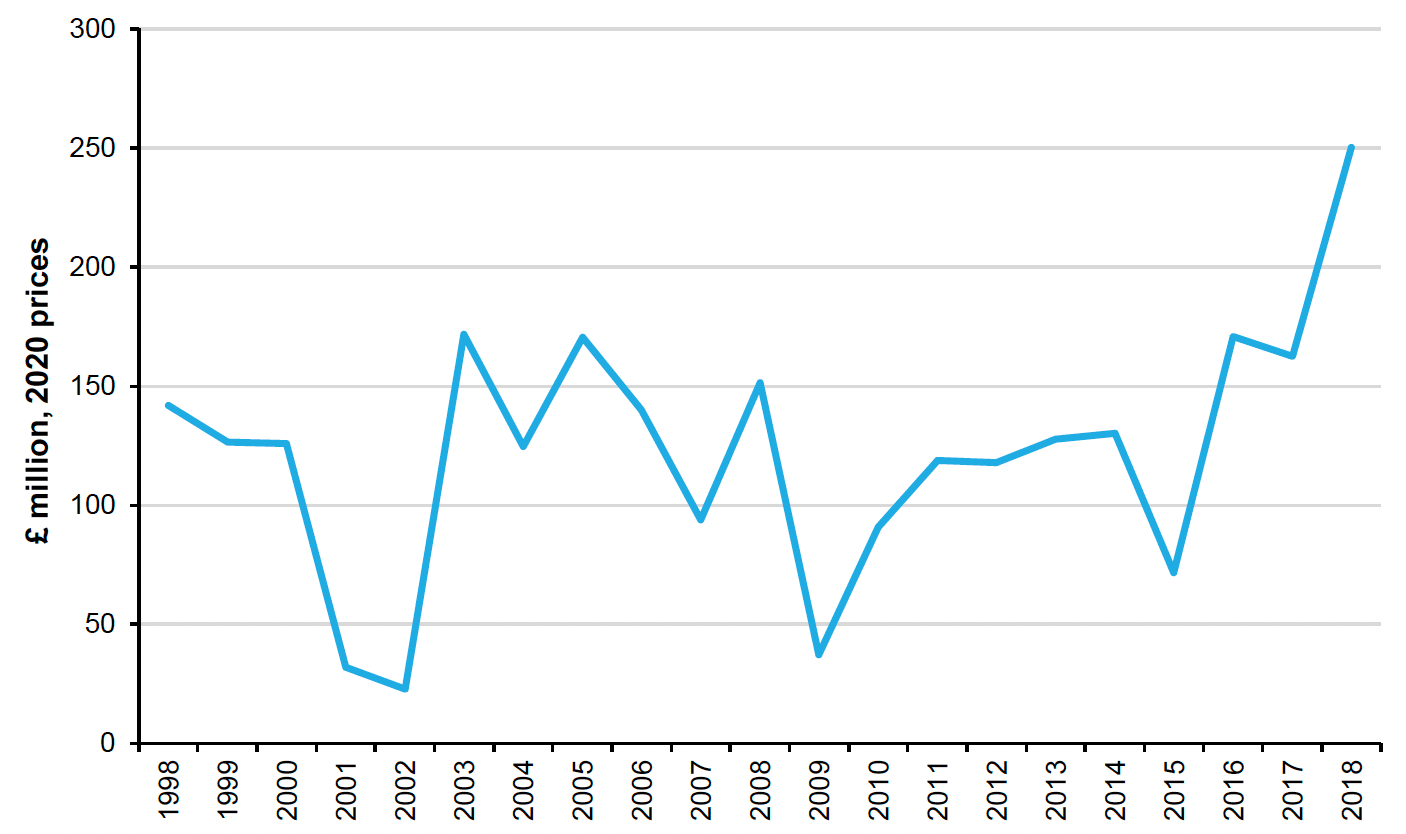
We derive monetary estimates of the water abstraction provisioning service from industry level data on the collection, treatment, and distribution of water for domestic and industrial needs. This valuation varies year-on-year but was estimated to be £250 million in 2018 (see Figure 15), up 54% from 2017, which is 6% of the UK annual value.
Source : Office for National Statistics and Scottish Water
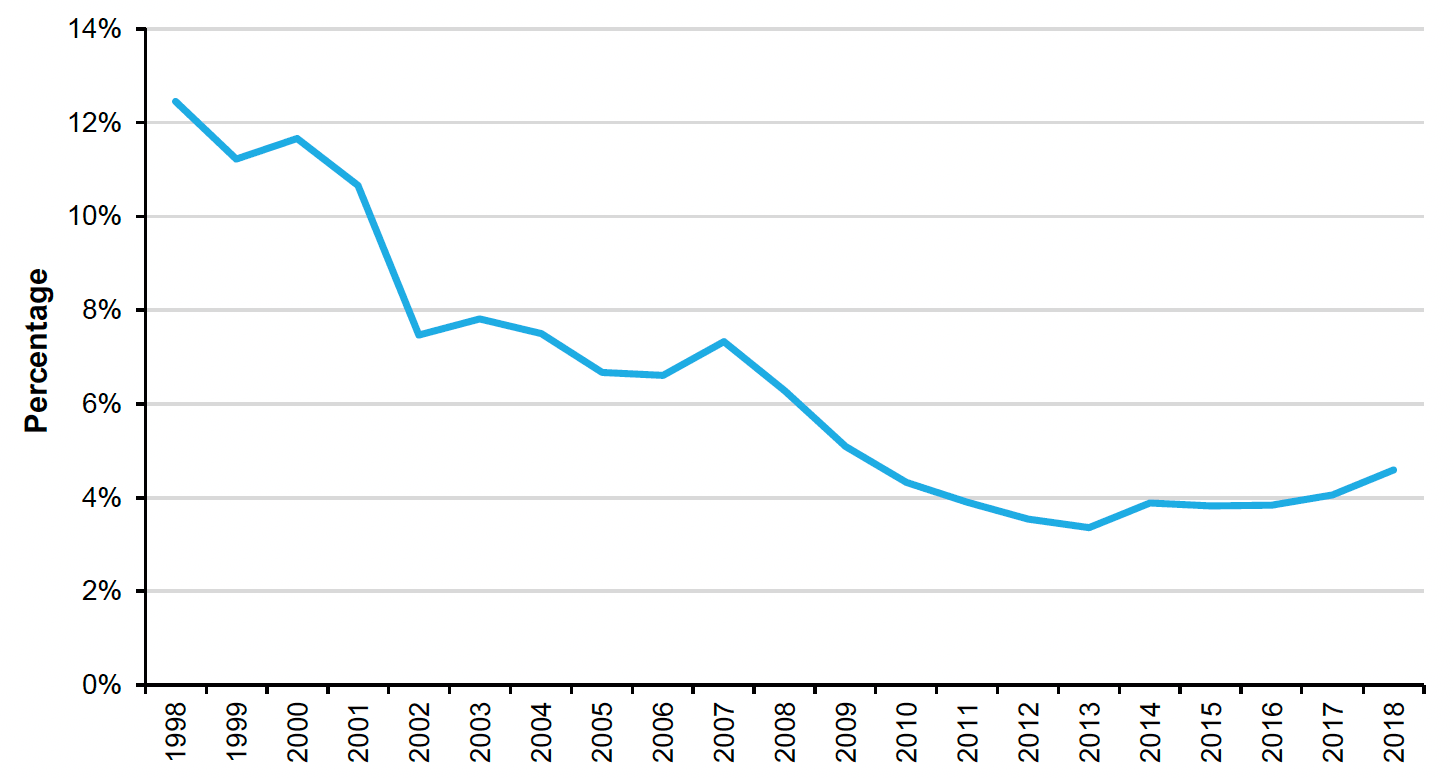
In 2018, the asset value of Scottish water abstraction was £4.7 billion, representing an 18% increase from 2017. The Scottish contribution to the UK asset value has reduced by 63% since the beginning of the time series. In 1998, Scottish water abstraction made up 12% of the UK asset value but has since fallen to 5% two decades later in 2018. This appears mainly due to Scotland's much larger reduction in leakage than other areas of the UK.
Source : Office for National Statistics
Minerals
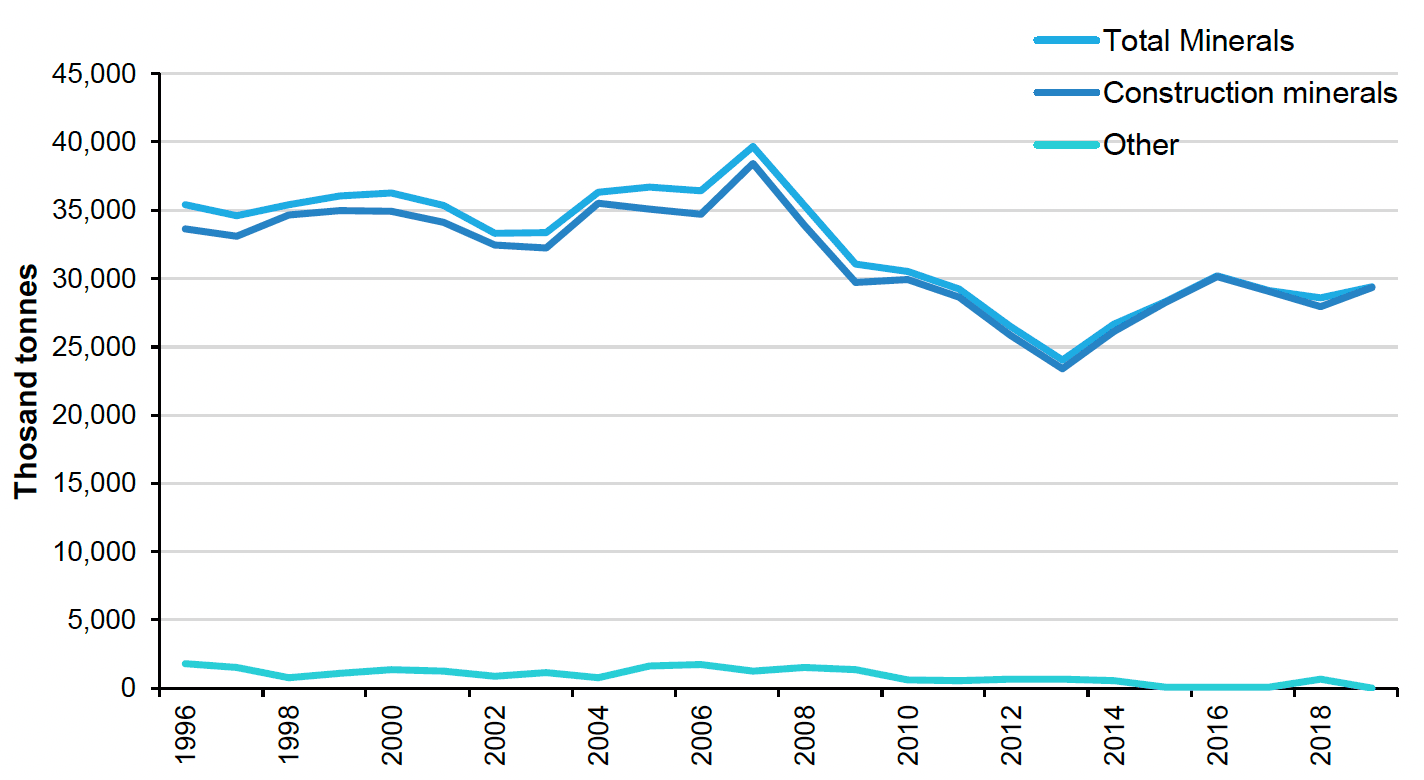
Mineral extraction in Scotland in 2019 stood at 29,366 thousand tonnes, this was a 3% increase on the amount extracted in 2018. In 2019, Scotland accounted for 13.9% of all minerals extracted in the UK. The amount of minerals extracted in the UK as a whole actually decreased by 3% between 2018 and 2019.
The vast majority of minerals extracted in Scotland are construction minerals, which accounted for 99.9% of all minerals extracted in 2019. This is slightly more than the UK where 96% of minerals extracted were construction minerals.
Source : British Geological Survey
Notes:
1. Construction minerals include sand and gravel, slate, igneous rock, limestone and dolomite, and sandstone.
2. Other minerals include barytes, fireclay, honestone, peat, silica sand, talc, and clay and shale.
Construction materials are used in house building and infrastructure projects. In 2019, the number of houses built in Scotland increased by 10% which accounted for the increase in construction minerals being produced.
Source : Office for National Statistics
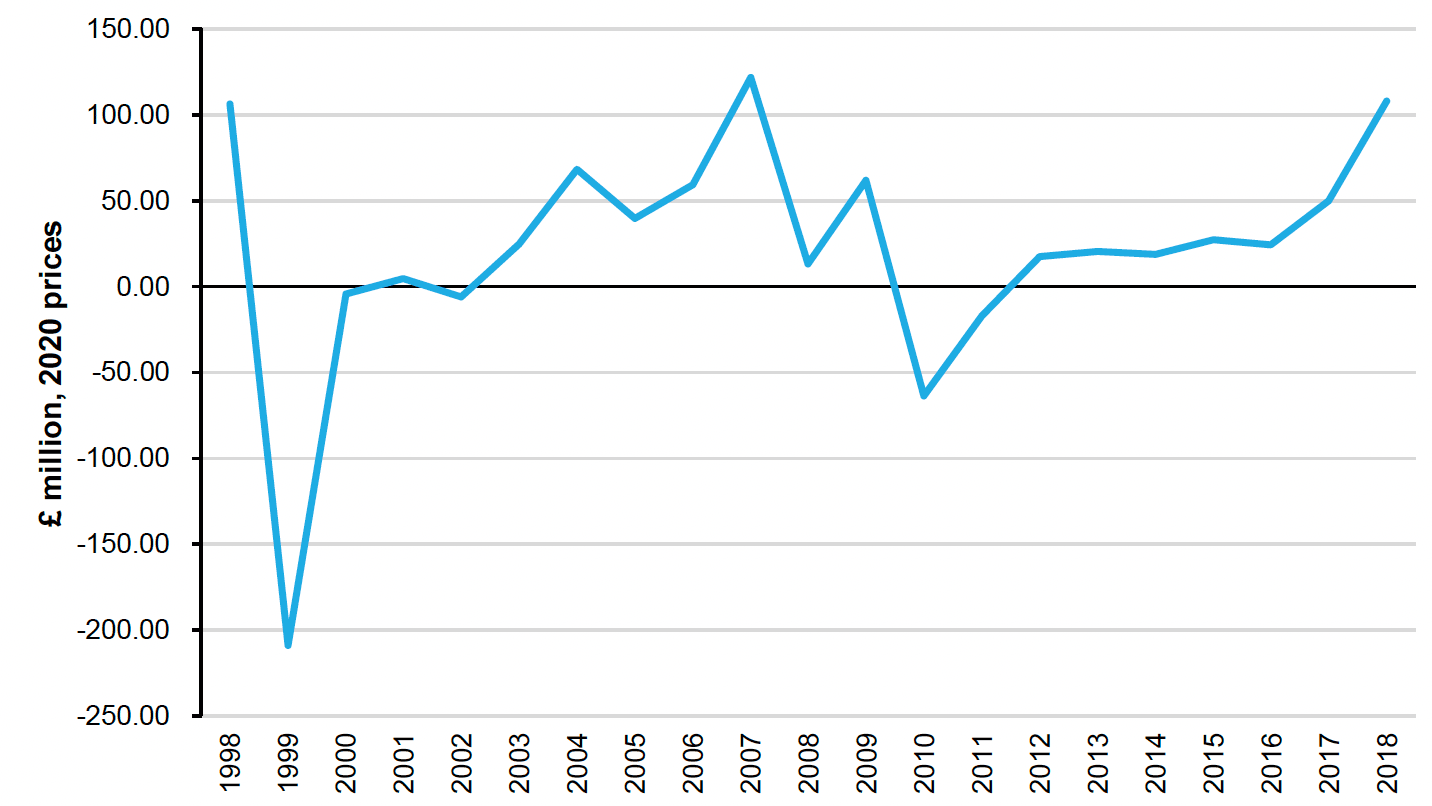
Using the resource rent approach (see Methodology section), the annual value of mineral provisioning fluctuated between 1998 and 2018. There are costs incurred for making use of natural resources, and in 1999 and 2010 these estimated costs outweighed income from the extraction of minerals. In 2018, the annual value increased to £108 million.
Unstable valuations of the mineral production abiotic provisioning service, along with years of negative gross operating surplus for the minerals industry in the UK national accounts, do not lend well to valuation comparisons between the UK and Scotland. Data inputs and methods will be reviewed in future accounts.
Fossil fuels
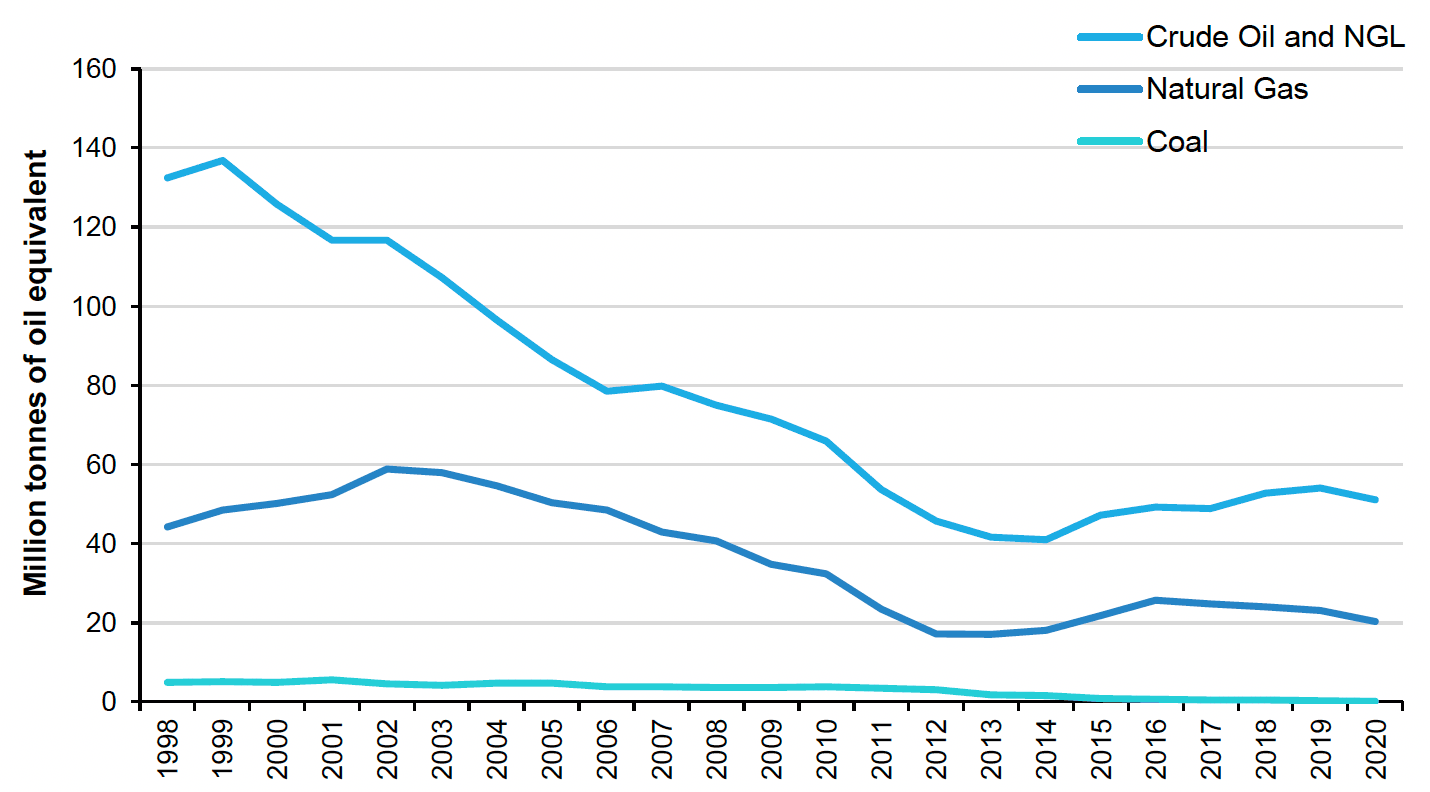
Fossil fuels include crude oil and natural gas liquids (NGL), natural gas and coal. Fossil fuel production has declined by 62% between 1999 and 2020. Crude oil and NGL production have declined by 63%, natural gas production has declined by 58% and coal has declined by 97%.
Scottish production of crude oil and NGL peaked in 1999 with 136.9 million tonnes of oil equivalent, before declining steadily to 41 million tonnes in 2014. It has since rebounded slightly, with production steadily increasing in most years after 2014. However, in 2020 crude oil production fell by 6% compared to 2019.
Natural gas production has declined since 2016 falling by 12% between 2019 and 2020. Coal's significance has declined in the last 20 years from 3% of all fossil fuels produced in 1999 to only 0.2% in 2020. The year 2020 also saw the closure of the last coal mine in Scotland.
Source : Oil and Gas Authority and Department for Business, Energy, and Industrial Strategy
The majority of the UK production of both crude oil & NGL (97%) and natural gas (61%) comes from Scotland. The crude oil and natural gas proportions have been relatively stable over the last 10 years.
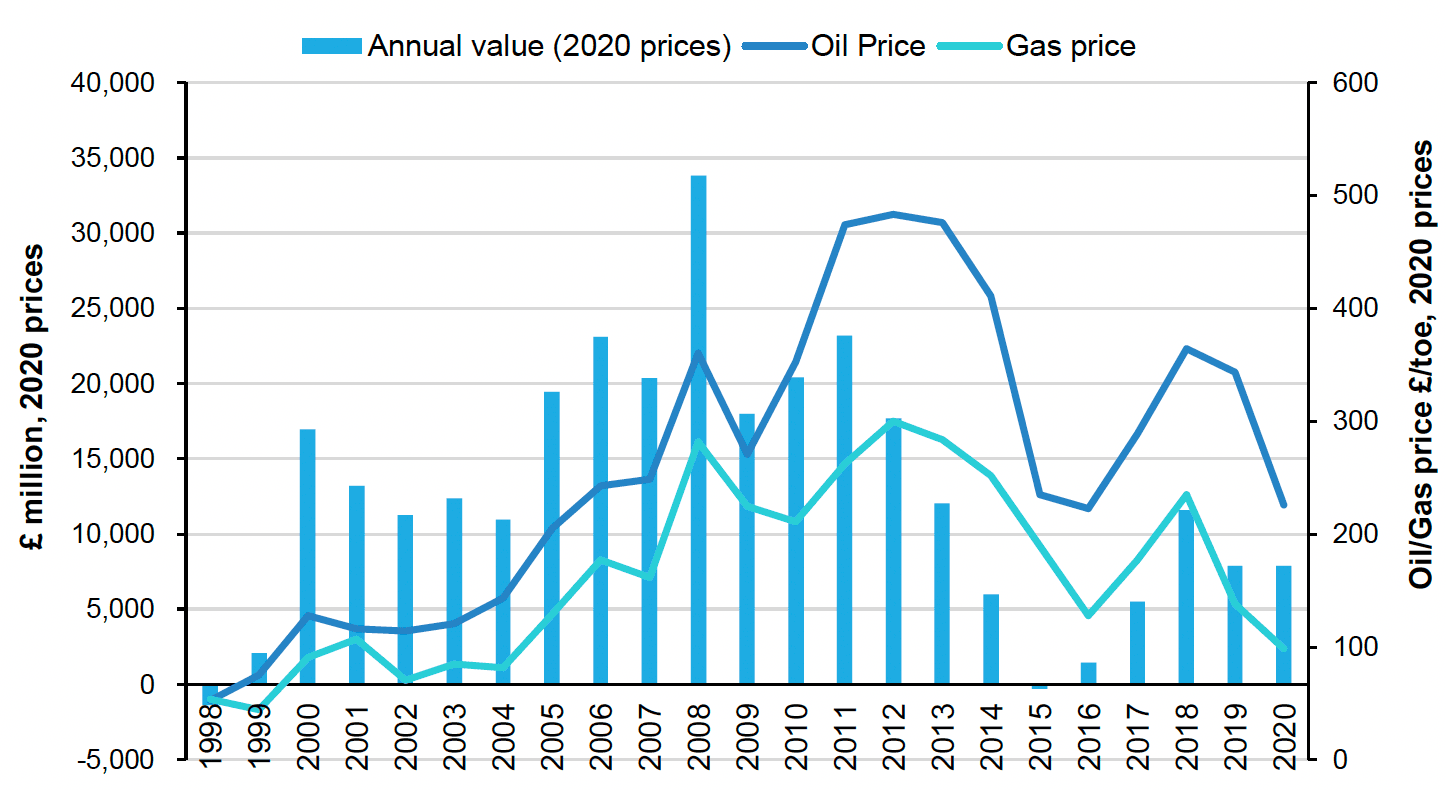
While the general trend shows lasting production shifts, the annual value of fossil fuel abiotic provisioning fluctuates year-on-year, driven largely by oil and gas price changes. The Brent crude oil price was on average 34% lower in 2020 compared to 2019.
Source : Oil and Gas Authority and Department for Business, Energy, and Industrial Strategy
The Scottish fossil fuels provisioning service annual value was £7.9 billion in 2020.
This uses a resource rent approach which estimates the residual remaining to the extractor after all costs and normal returns are considered. This is closely related to profitability. The details of the methodology used to estimate the value of fossil fuels can be found in the methodology section.
Resource rent is different from an intrinsic measure of value, such as the wholesale price determined by the market or the value it provides to the economy in terms of economic output (i.e., gross value added). Resource rent does not value government receipts, employment, supply chain activity or energy security as benefits.
Renewable electricity generation
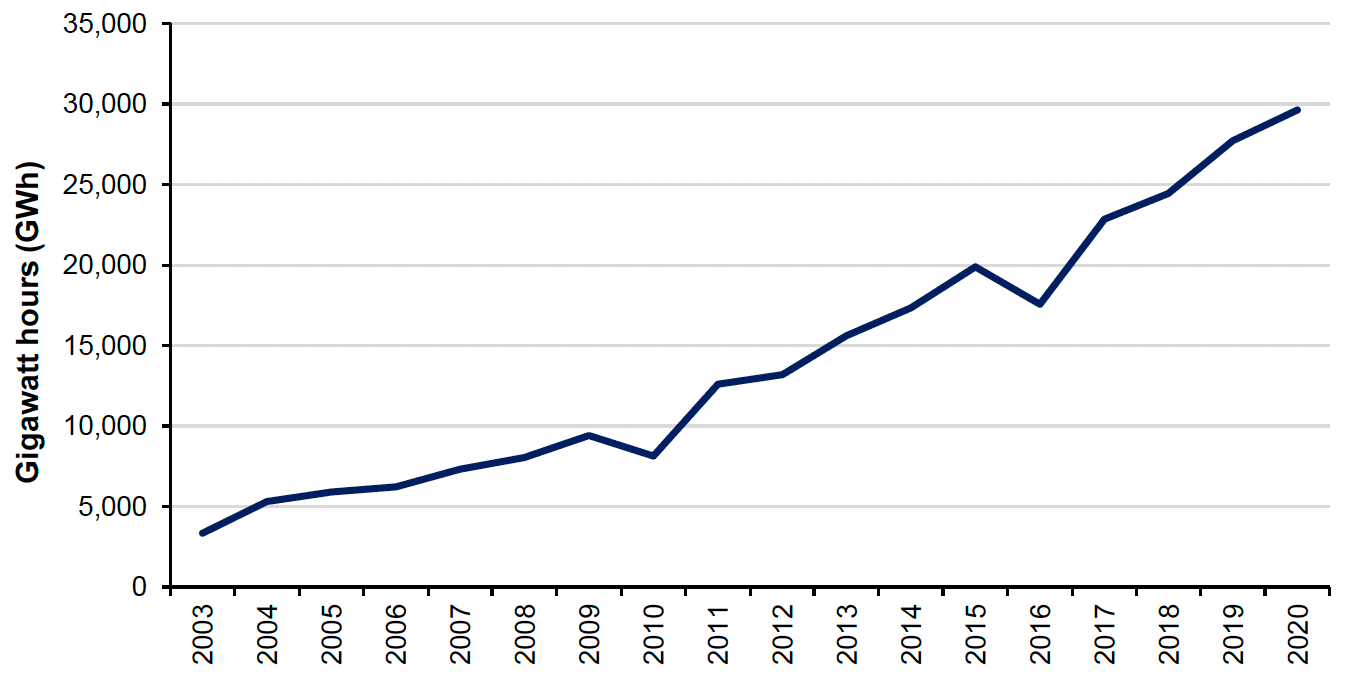
Scotland's electricity generation from renewable sources has increased by 7% from 2019 to 2020. Since 2016 where renewables' output dropped by 12% from the previous year, Scottish renewable electricity generation has seen year-on-year growth. Since 2003 Scottish renewables have increased by 784%, up from 3,351 gigawatt hours (GWh) to a record of 29,626 GWh in 2020.
Source : Department for Business, Energy and Industrial Strategy
Notes:
1. Renewable electricity generation includes hydro, wind, wave and tidal and solar PV.
2. Generation from "other sites" is not included. "Other sites" are sites that have not been attributed to a region so that data related to individual companies are not disclosed.
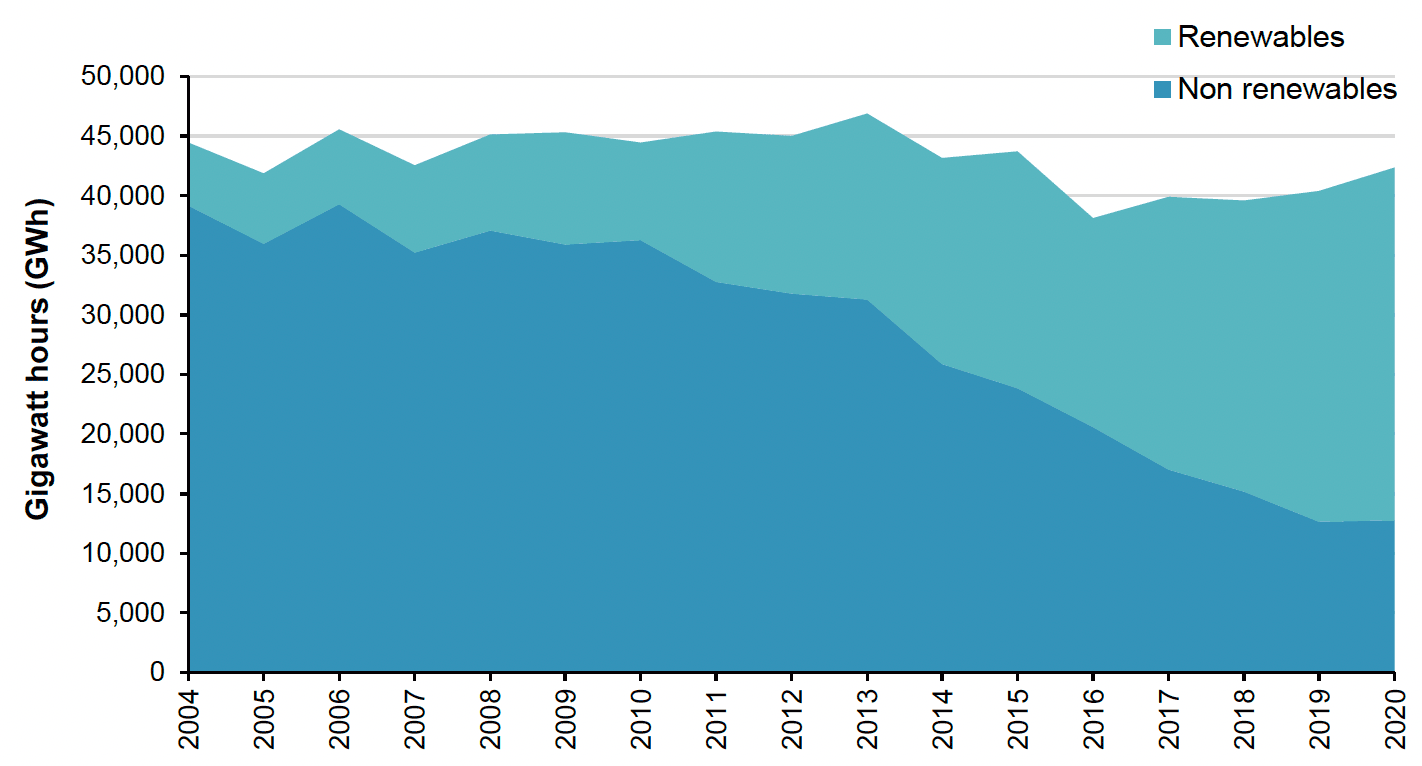
Over the time series, although there has been a slight reduction of 5% in the total electricity generation in Scotland, there has been a 457% increase in renewable energy generation. The increase in renewable outputs coincides with a 68% reduction of the contribution on non-renewable sources such as coal, oil and gas (Figure 22).
Source : Department for Business, Energy and Industrial Strategy
Notes:
1. Renewables include wind, hydro, solar PV and wave and tidal.
2. Non-renewables include coal, oil, gas, nuclear, other thermal, hydro, pumped storage, and non-biodegradable waste combustion.
3. Non-renewable generation only includes generation from Major Power Producers (MPPs).
4. Renewable generation from "other sites" is not included. "Other sites" are sites that have not been attributed to a region so that data related to individual companies are not disclosed.
Scotland's contribution to UK renewable energy provisioning decreased from 76% in 2003 to 31% in 2020. This is because hydropower, which is largely in Scotland, was historically the largest renewable electricity generation source in the UK. Although its generation has remained stable, with other renewables' growth it now represents a minority of UK renewable generation.
Source : Scottish Government and Department for Business, Energy and Industrial Strategy (DUKES)
Notes:
1. Electricity generation from renewables excludes landfill and sewage gas, other bioenergy, anaerobic digestion, and biomass and waste.
2. Generation from "other sites" is not included. "Other sites" are sites that have not been attributed to a region so that data related to individual companies are not disclosed.
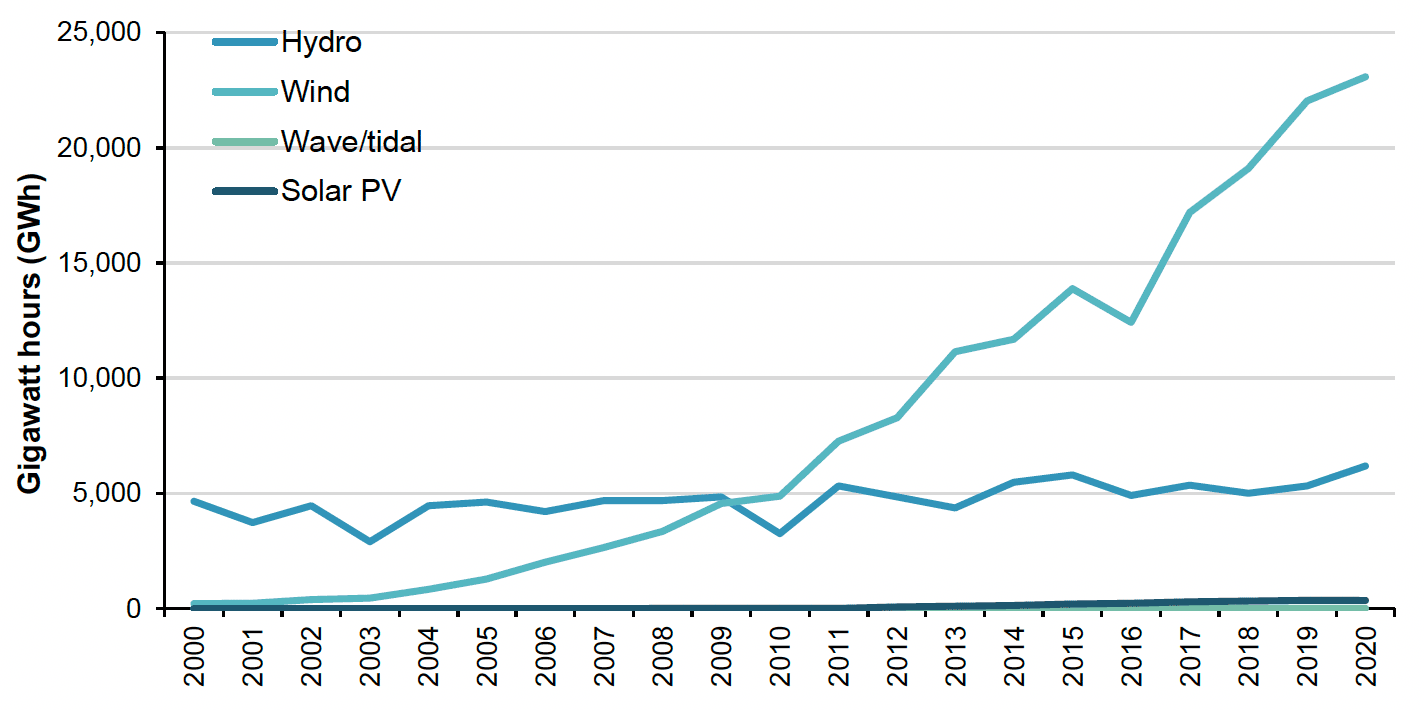
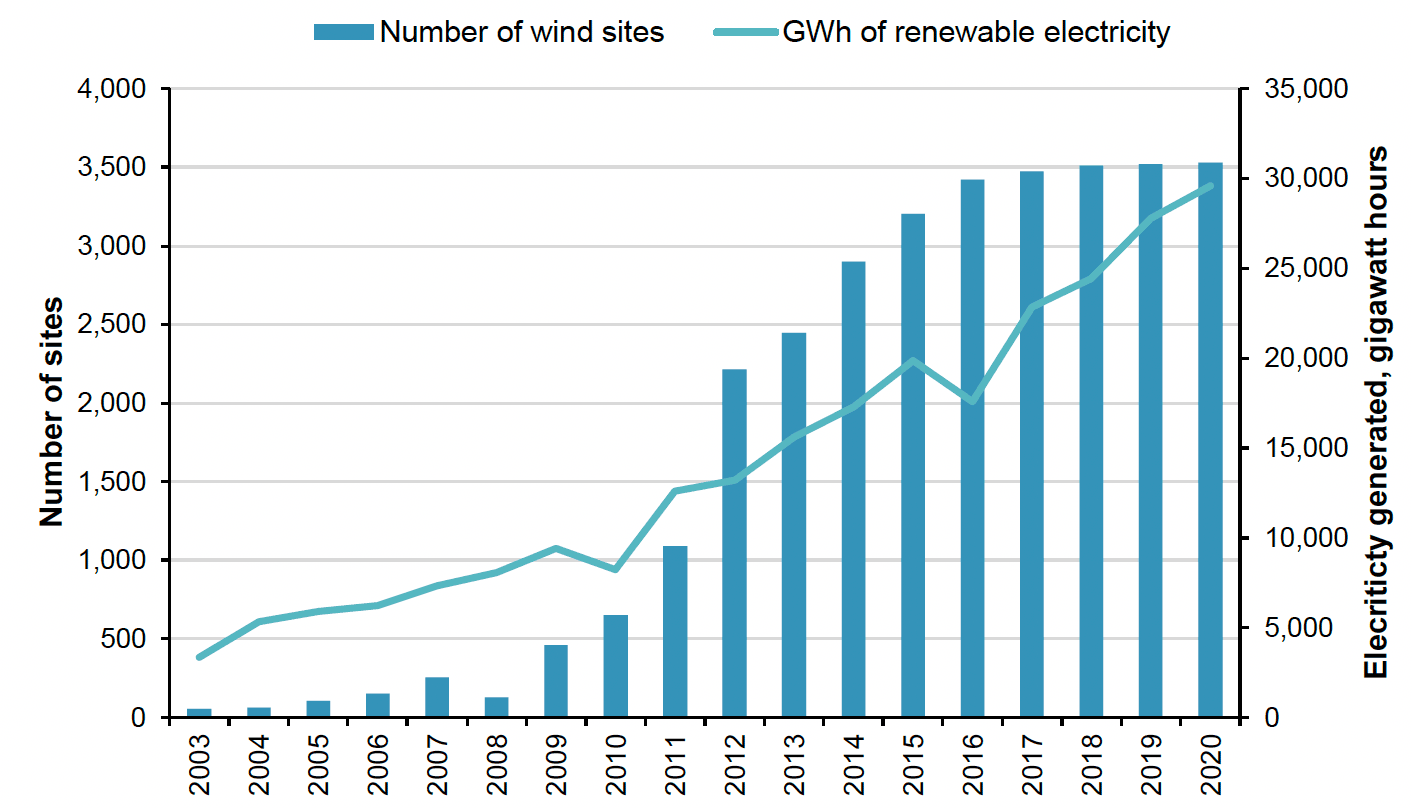
Of all renewable electricity generation in Scotland, wind contributed more than all other sources at 78% in 2020. Before 2010, Scottish hydropower was the long-running main contributor to electrical output. Since then, however, wind generation has become the largest single contributing renewable electricity source. Currently, there are over 27 times the number of wind electricity generation sites than in 2008, producing 23,075 GWh in 2020.
Source : Scottish Government and Department for Business, Energy and Industrial Strategy (DUKES) and Department for Business, Energy and Industrial Strategy (BEIS)
Hydroelectricity generation was the next largest renewable energy source in Scotland in 2020, contributing 6,187 GWh, or 21% of the year's total. This is an increase of 16% from the previous year; the greatest proportional growth of any renewable energy source from their 2019 estimates. This is also the first year that hydroelectric generation has surpassed 6,000 GWh.
Hydroelectricity generation is sensitive to changes in precipitation, as flowing water is needed to spin turbines which generate electricity. As can be seen in Figure 25, the two measures are highly related, with changes in precipitation causing variation in hydroelectric output. The 78% increase in hydropower sites from 2014 to 2018 might have contributed to an increased ability to harness the benefits of rainfall and generate greater electrical output in any given year, relative to precipitation.
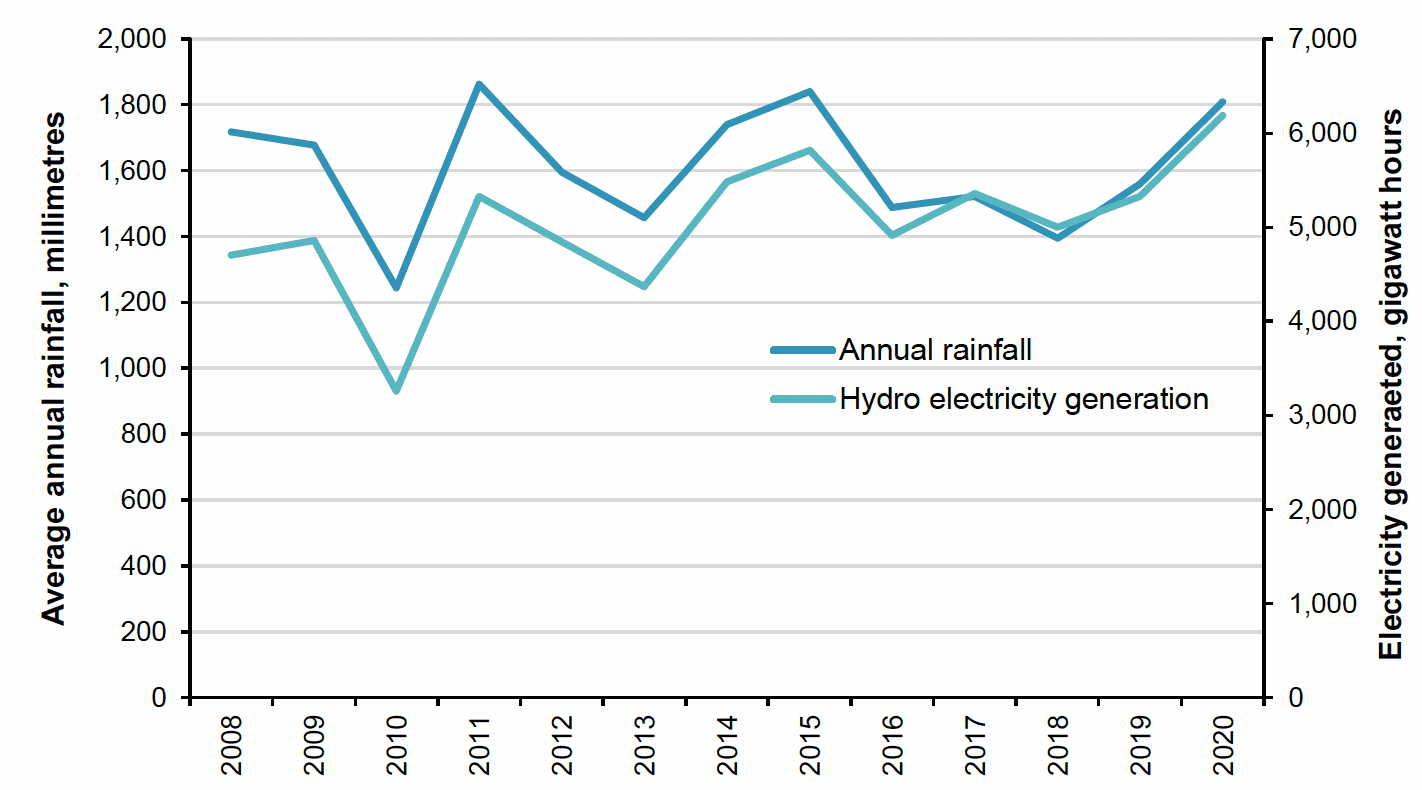
Source : Met Office and Department for Business, Energy, and Industrial Strategy
Capacity factors are a ratio of actual to technical potential total generation capacity. Hydropower capacity factors increased by 15.8% from 36.8% in 2019 to 42.6% in 2020. Capacity factors vary with the weather but can improve with advancements in renewable technologies. In the case of hydropower, it appears that an increase in rainfall has resulted in a greater capacity factor and produced a comparable increase in electrical output.
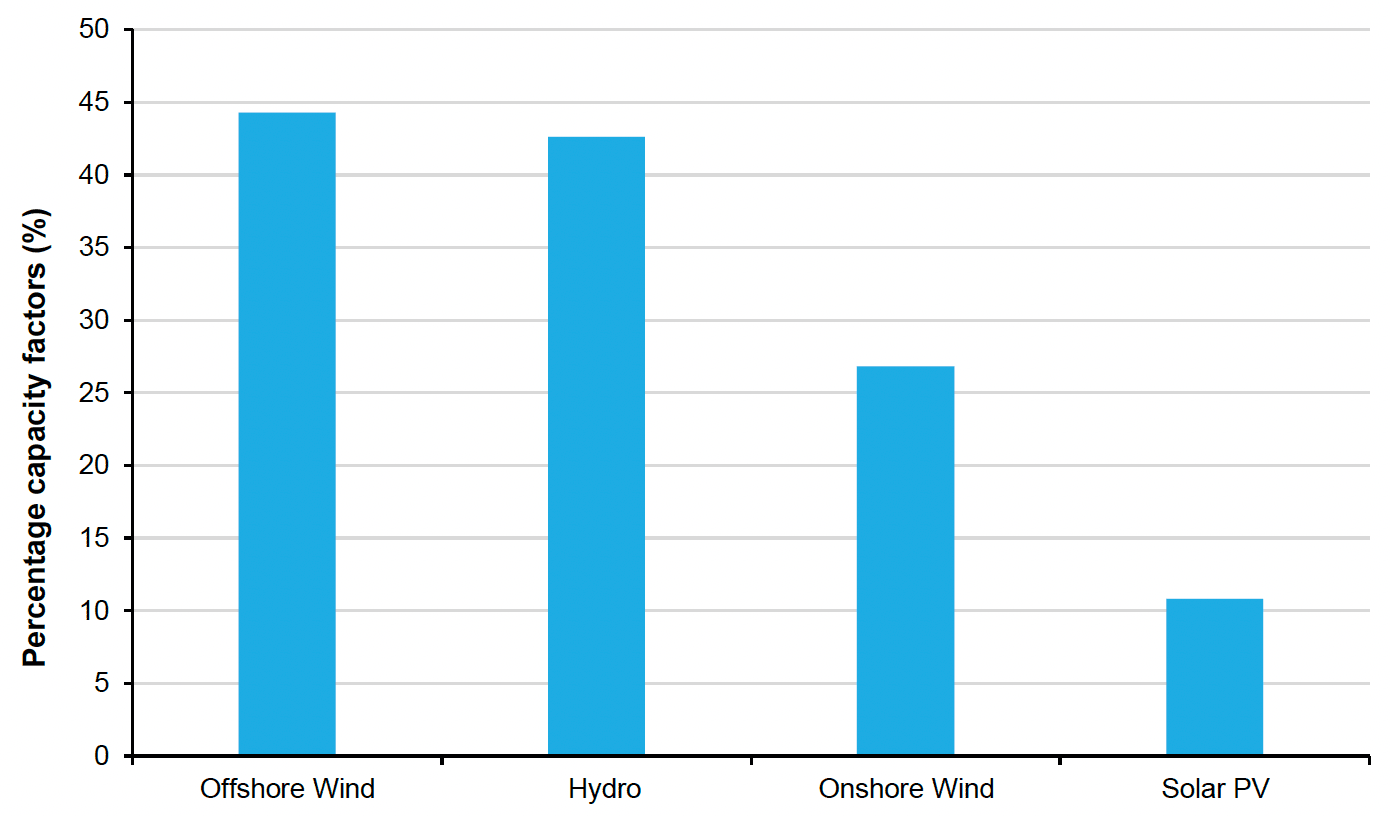
Source : Department for Business, Energy and Industrial Strategy
The number of solar PV sites has more than doubled since 2012, and since then electricity generated from solar PV has increased 404%. This means that the electricity generated per site has nearly doubled in this same time period. Although the load factors for solar PV are the lowest of all renewable production in Scotland (10.8%), solar PV was responsible for 1.2% of all electricity from renewable sources in 2020.
Scotland's 2018 annual value of renewables was £221 million, while the asset value was £5.3 billion.