Scottish Natural Capital Accounts 2022
This report estimates quantity and value of services supplied by Scotland's natural capital.
4. Regulating services
As well as provisioning services, natural assets provide several less visible services known as regulating services. A regulating service is an ecosystem benefit which moderates natural phenomena. Regulating services include cleaning the air, sequestering carbon and regulating water flows to prevent flooding.
This section presents four regulating ecosystem services:
1. Carbon sequestration
2. Air pollution removal
3. Noise mitigation
4. Urban cooling
Green and blue spaces in Scotland's urban areas can help reduce the temperature on hot days, leading to savings in productivity, and can reduce noise disturbance. The annual value of Scottish urban cooling in 2019 was £3.8 million and Scottish noise mitigation equalled £0.7 million in 2019
However, green urban areas can also provide other regulating services, such as carbon sequestration and air pollution removal, which are both carried out by vegetation. Because air pollution is known to lead to respiratory diseases in humans, the risk of those diseases for a population can be estimated from the levels of pollution and the health costs of those diseases. The capacity for vegetation to sequester carbon and remove such air pollution invariably relies on the amount of vegetation present in a particular area.
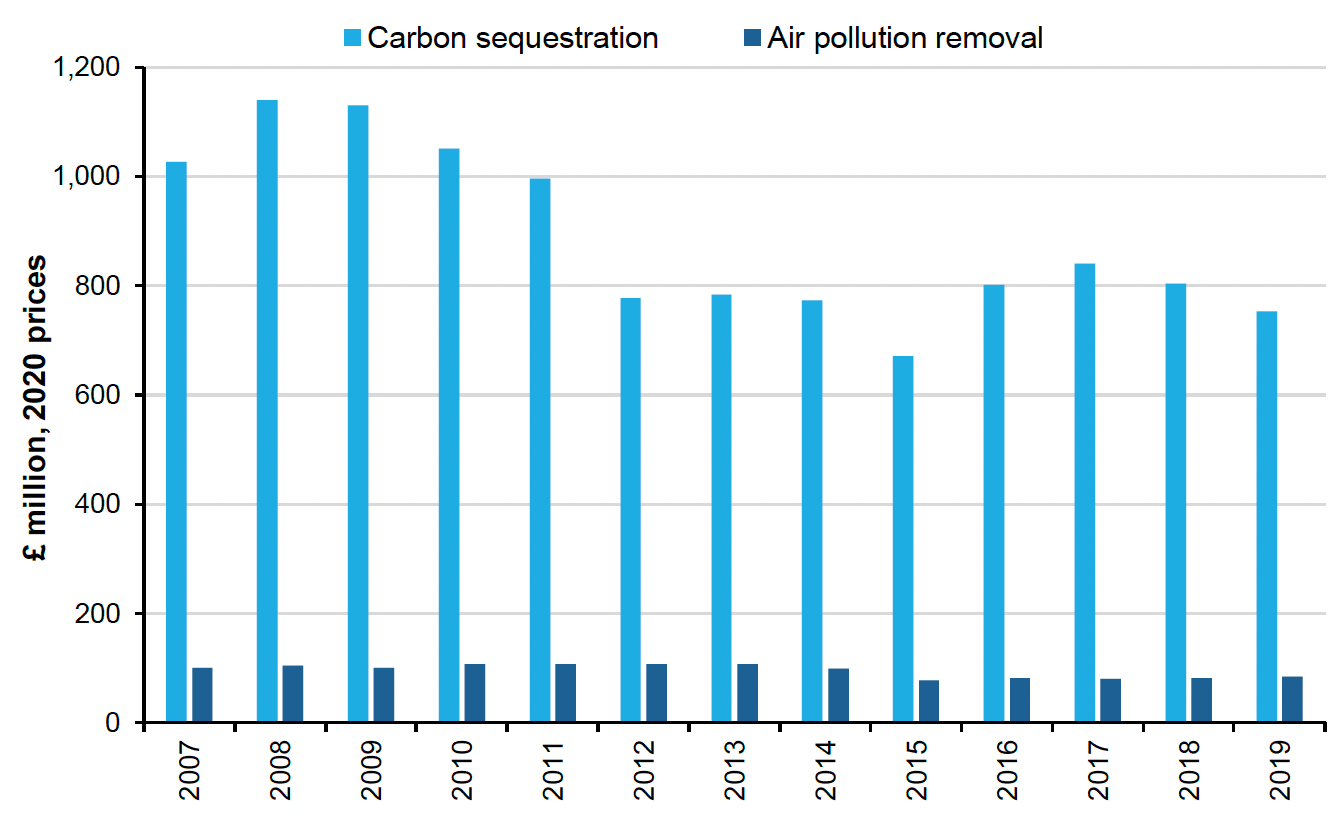
The valuation methods used differ; whereas carbon sequestration is a removal cost, air pollution removal is a societal cost. That is, we measure the value of avoiding damage (for carbon) and the value of treating existing damage (for air pollution). Air pollution removal valuation does not account for the cost of abatement, and carbon sequestration valuation does not consider the global societal impacts of carbon dioxide.
The amount of carbon sequestrated is substantially more than the amount of air pollutants removed by vegetation. However, the value per tonne of air pollutant removed is on average four times higher than a tonne of carbon removed. This is because the avoided health impacts of pollutants, mainly PM2.5, provide significant benefits to society.
In 2019, the annual values for Scottish carbon sequestration and air pollutant removal equalled £753 million and £84.4 million, respectively (2020 prices).
Source : Office for National Statistics, National Atmospheric Emissions Inventory (NAEI), and UK Centre for Ecology and Hydrology
Carbon sequestration
When using this analysis, it is important to note that we do not capture all carbon sequestration. Because of a lack of data, values related to carbon sequestration by marine ecosystems are not included in the current estimates.
An assessment of Scotland's blue carbon resources (2017) estimates the scale of carbon production and storage in Scottish inshore Marine Protected Areas (MPA) and Special Areas of Conservation (equal to around 11,350 km2). Estimates show that stocks of carbon, in inshore MPAs in both living materials and sediment, are estimated to be 9.4 megatons of organic carbon and 47.8 megatons of inorganic carbon.
Annually, the living components of inshore MPA habitats are estimated to emit 248,000 tonnes of organic carbon. MPA sediments sequester 126,000 tonnes of organic carbon. This means that Scotland's MPAs stores around half of the organic carbon it produces. However, most of the sequestrated organic carbon is likely to originate from land rather than the marine environment.
Scottish MPAs production of inorganic carbon is vastly outweighed by the quantity of inorganic carbon it sequesters, by around 950% – while 36,000 tonnes of inorganic carbon are produced, 348,000 tonnes of carbon are stored each year. The major difference between inorganic carbon production and sequestration has several possible explanations. Inorganic carbon production may be underestimated, and inorganic carbon sequestration may be overestimated. Furthermore, Scottish inshore MPAs may sequester inorganic carbon that originates from outside the MPA zone.
This 2021 report by climate change (Scotland centre of expertise connecting climate change policy and research) gives the latest estimates of peat extent and condition in Scotland. About a quarter of Scotland's area is covered in peat, storing over 3 billion tonnes of carbon. When peat is in a near natural condition, it has a net cooling effect on the climate.
Gross carbon sequestration is defined as the change in living biomass. This value only includes new carbon sequestered from the atmosphere leaving out transfers between habitats. This measure is used within the natural capital accounts as it minimises transfers and ensures a positive overall sequestration figure. Gross carbon sequestrated stood at 3.17 million tonnes of CO2 equivalent in 2019 (Figure 22) between habitats. This represents 36% of the UK total amount sequestered (8.88 million tonnes). The large proportion being sequestered in Scotland, is because Scotland has a high proportion of the UK's forests and woodland. This provides a service worth £0.75 billion yearly and an asset valuation of £38.37 billion. However, this excludes the emission costs related to the management of natural habitats.
Net carbon sequestration provides an overall picture as it includes transfers between different habitats and emissions. In 2019, Scotland's environment as defined as Land Use, Land Use Change and Forestry (LULUCF) emitted a net amount of 2.72 million tonnes of carbon equivalent, this is a reduction compared to 1990 when 9.07 million tonnes of carbon equivalent were emitted. This reduction may be in part due to a 44% fall in the amount of carbon emitted by the cropland habitat and a 35% reduction in the amount emitted by the grassland habitat.
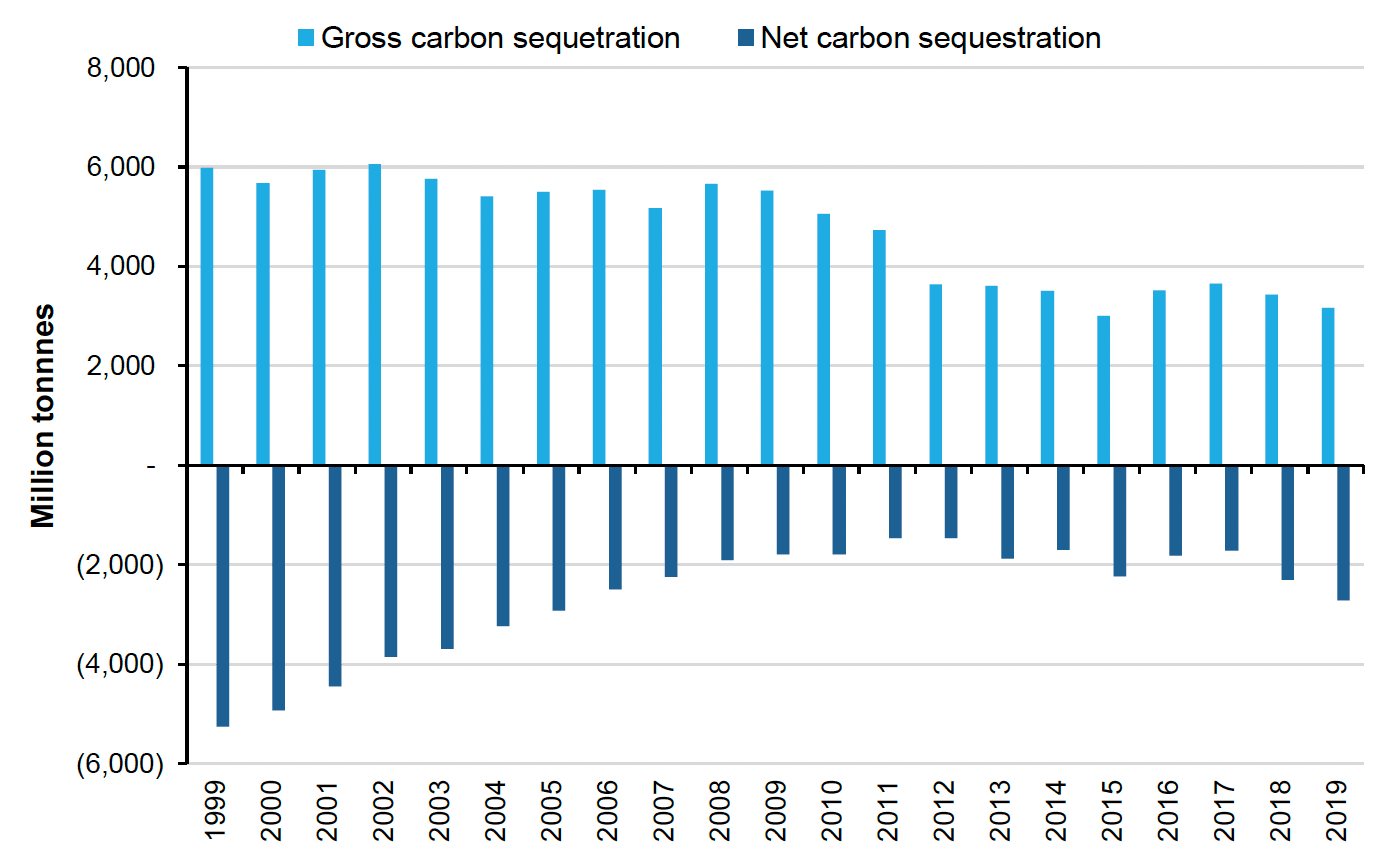
Source : Office for National Statistics and National Atmospheric Emissions Inventory (NAEI)
In 2019, forest land removed 6.25 million tonnes of carbon. In contrast, cropland emitted 5.15 million tonnes, however, this is a decrease compared to 1999 when cropland emitted 8.36 million tonnes. This means Scottish croplands provide negative net carbon sequestration valued at negative £1.22 billion annually. This could be seen as a hidden cost of food production and in principle could be netted off with market-based costs such as fertiliser and fuel within the agricultural biomass account.
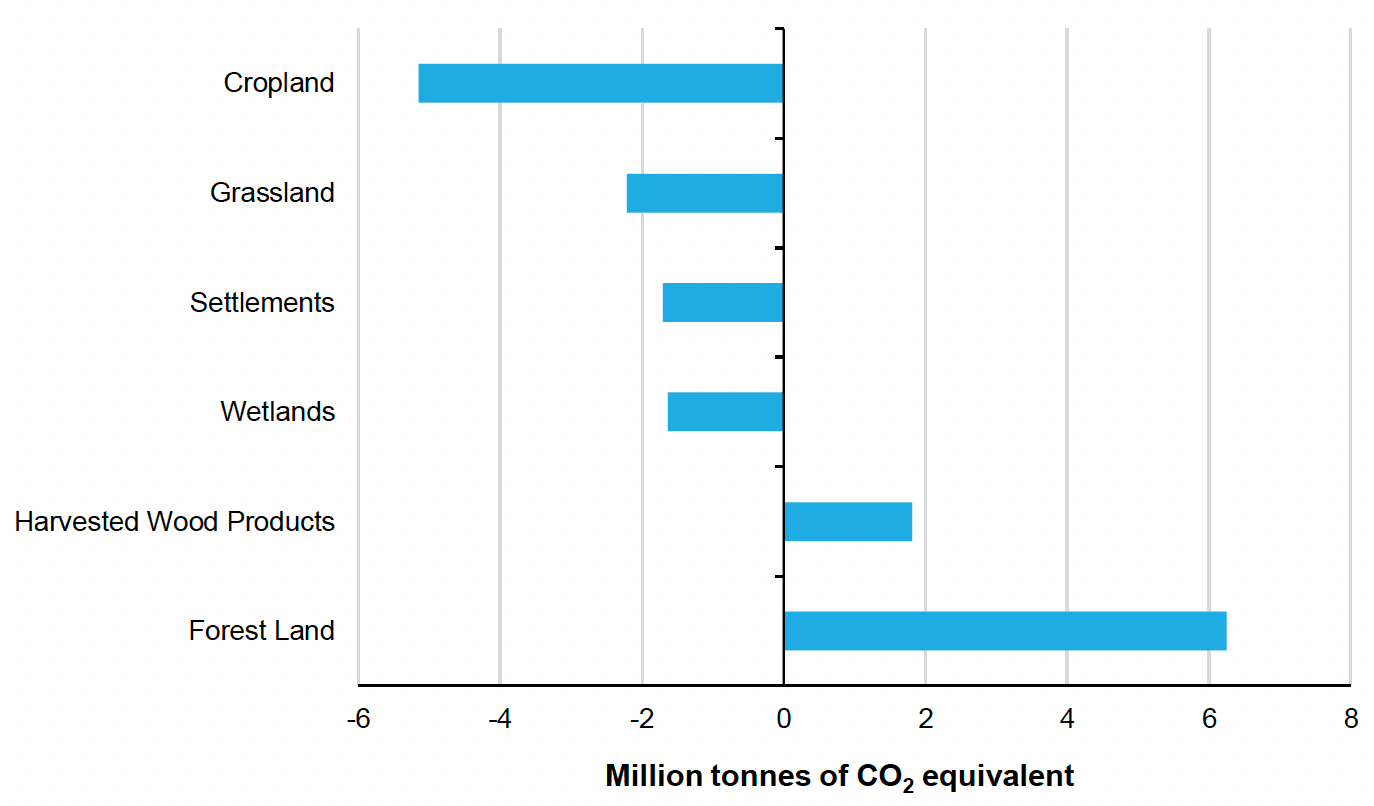
Source : Office for National Statistics and National Atmospheric Emissions Inventory (NAEI)
Air pollution removal
Vegetation removes airborne pollutants from the environment. We can measure the benefits of this to humanity by looking at the savings to health costs associated with breathing in air pollutants. The causes of air pollutants we measure are PM10, PM2.5, sulphur dioxide (SO2), ammonia (NH3), nitrogen dioxide (NO2) and ozone (O3). More information on the type of health costs saved and the method of measuring this benefit can be found in the methodology section.
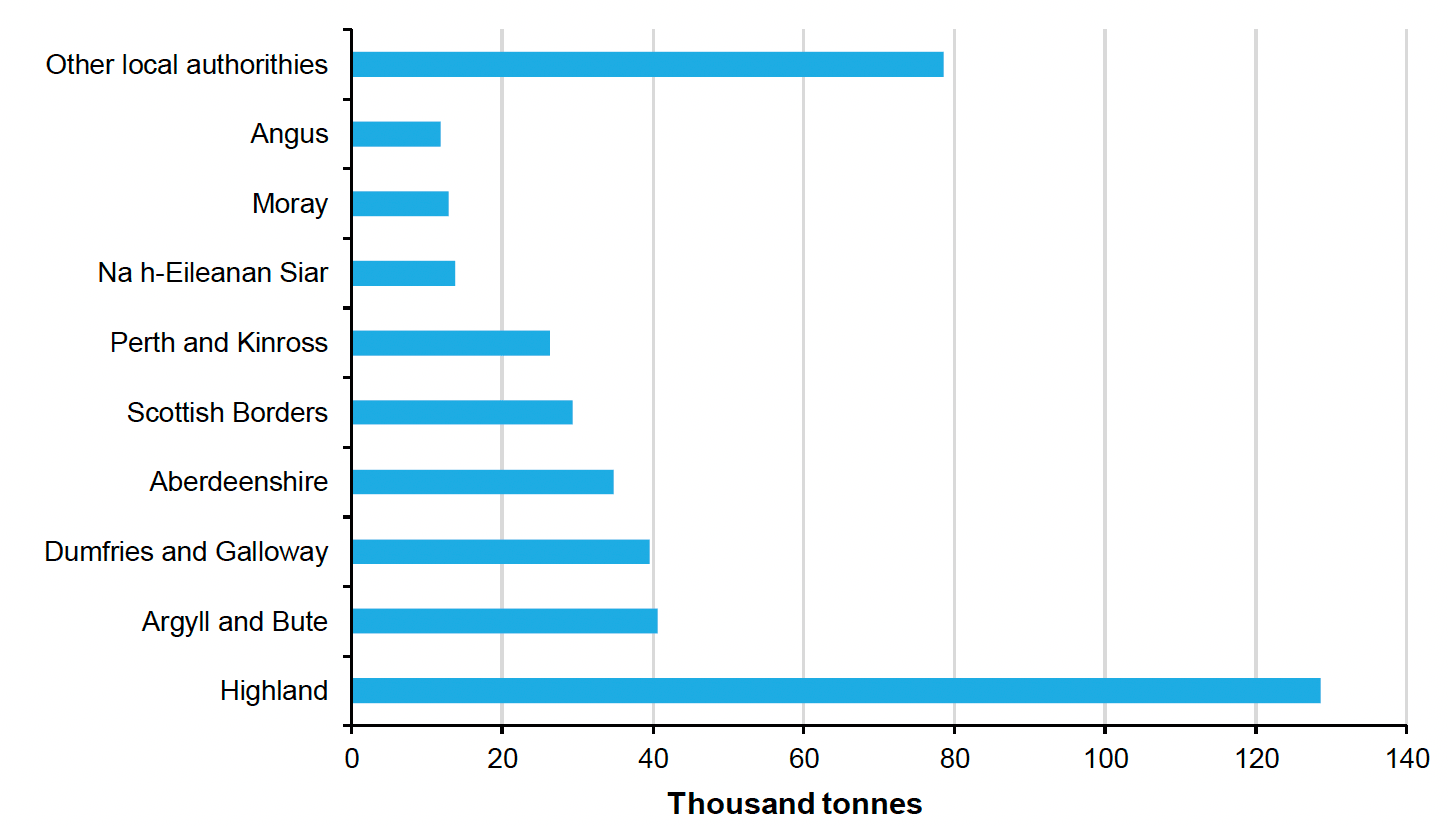
In 2019, it was estimated that vegetation in Scotland removed 411 thousand tonnes of pollutants, which is a 7.7% increase on the volume of pollutants removed in 2018. This represents 31% of the volume of air pollutants removed across the UK. The habitats that removed the most air pollution in 2019 were woodlands, accounting for just over 28% of all air pollution removals. The Highlands was the local authority that removed the most airborne pollutants in 2019, removing 129 thousand tonnes (30% of total). This may be expected given its large landmass compared to more urban authorities.
Source : Office for National Statistics and UK Centre for Ecology and Hydrology
The main pollutant is ground level ozone. Ozone is not directly emitted but is formed by a complex set of reactions involving other pollutants such as nitrogen oxides in the presence of sunlight. There tends to be more ozone in rural than urban areas, as in a natural environment a balance is formed where sunlight breaks down nitrogen dioxide to form ozone.
In polluted conditions where the air contains nitric oxide from fuel combustion, the balance is upset. As it is nitric oxide that destroys ozone, ozone concentrations are actually lower next to busy roads. Ozone represented 93% of all pollutants removed in 2018. Ground level ozone has also accounted for over 90% of all air pollution removed in all years going back to 2007.
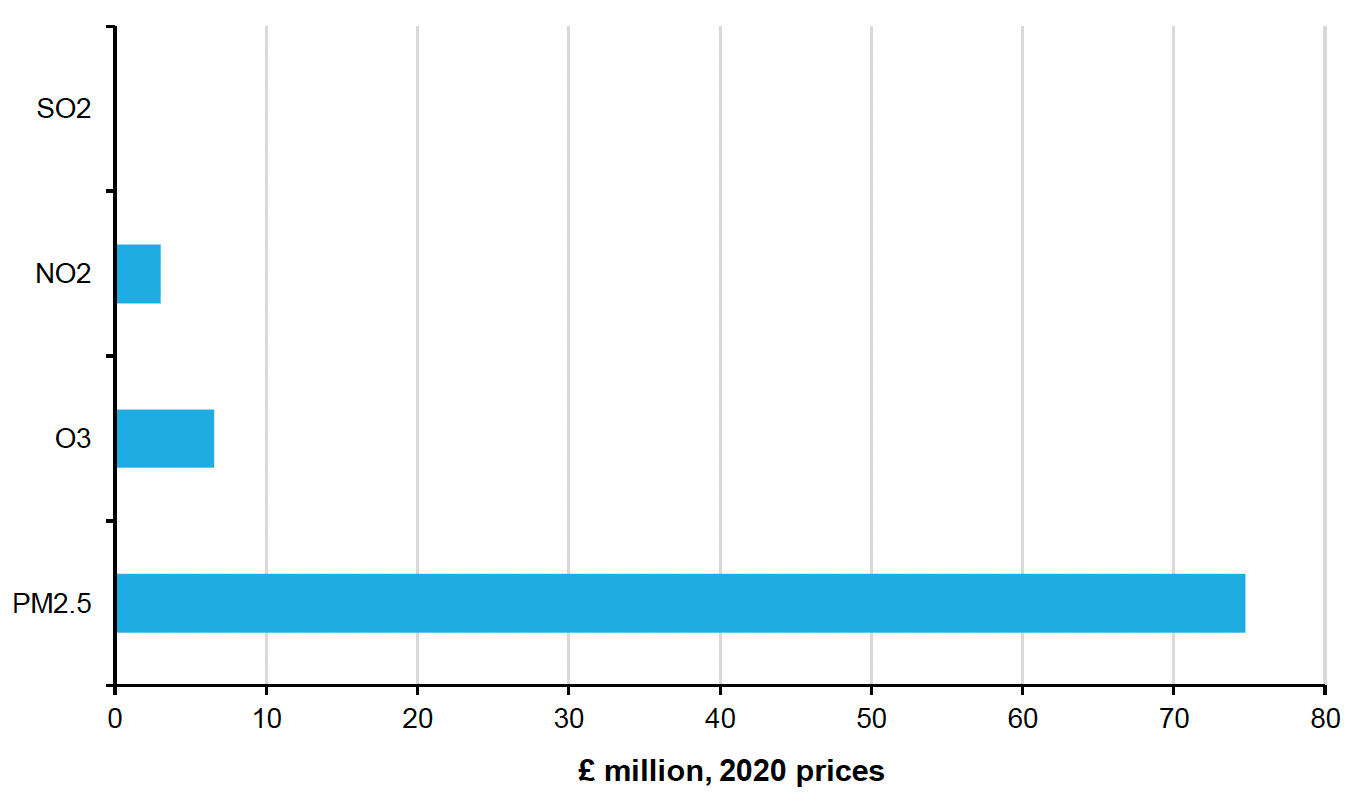
It is estimated that in 2019, the avoided health costs in the form of avoided deaths, avoided life years lost, fewer respiratory hospital admissions, and fewer cardiovascular hospital admissions, amounted to a substantial £84.4 million.
PM2.5 (fine particulate matter with a diameter of less than 2.5 micrometres, or 3% of the diameter of a human hair), is the most harmful. PM2.5 can bypass the nose and throat to penetrate deep into the lungs, leading to potentially serious health effects and healthcare costs. Although the removal of PM2.5 represents only 1.6% of total pollution removed, 89% of the avoided health impacts are a result of reductions in PM2.5 concentrations.
Source : Office for National Statistics and UK Centre for Ecology and Hydrology
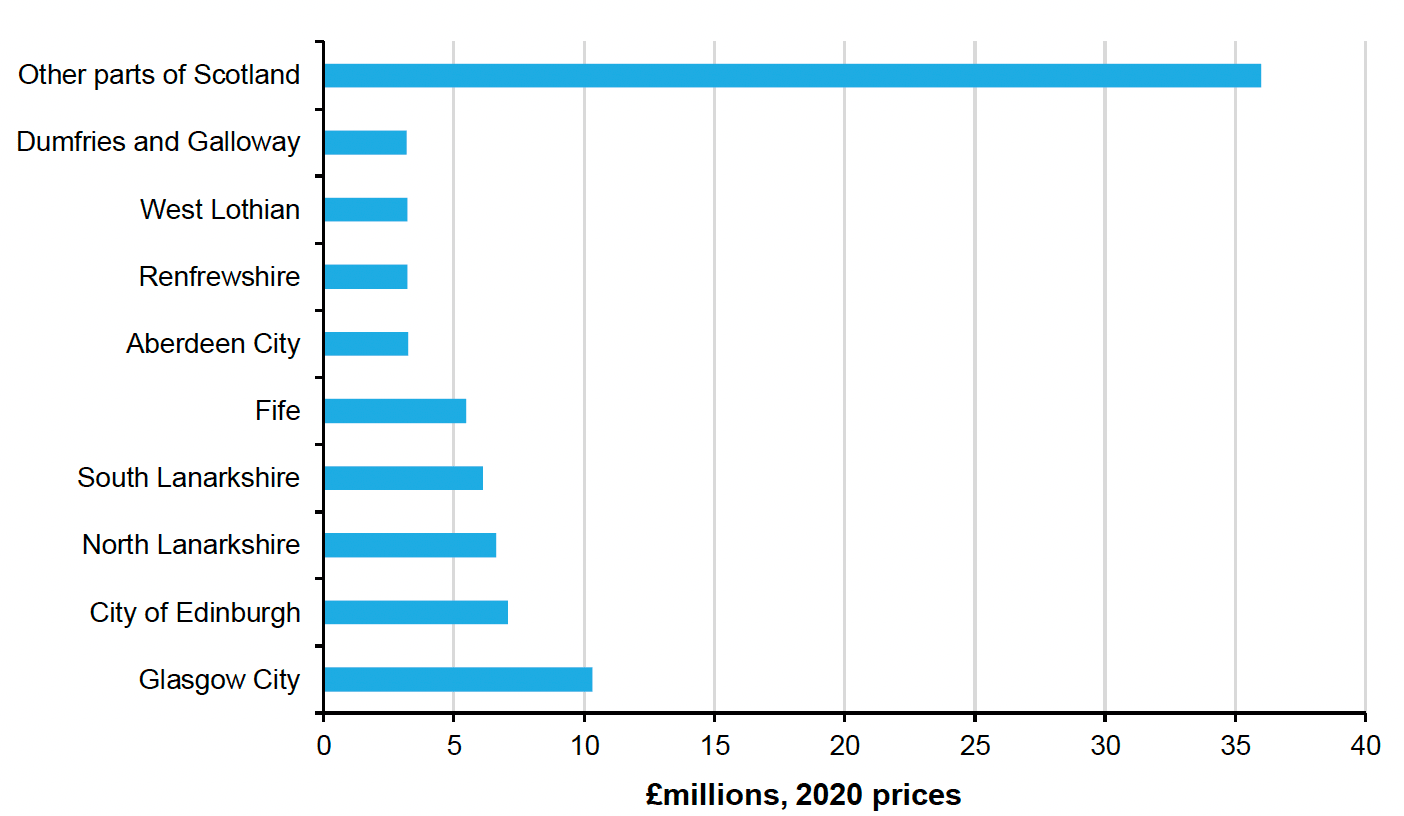
While most of the pollution was removed in rural parts of Scotland, the two areas that benefited the most were the bigger cities of Scotland, Glasgow and Edinburgh. This is because the benefits are associated with health savings of lower pollution and the savings will also be greater in areas with larger populations.
Source : Office for National Statistics and UK Centre for Ecology and Hydrology
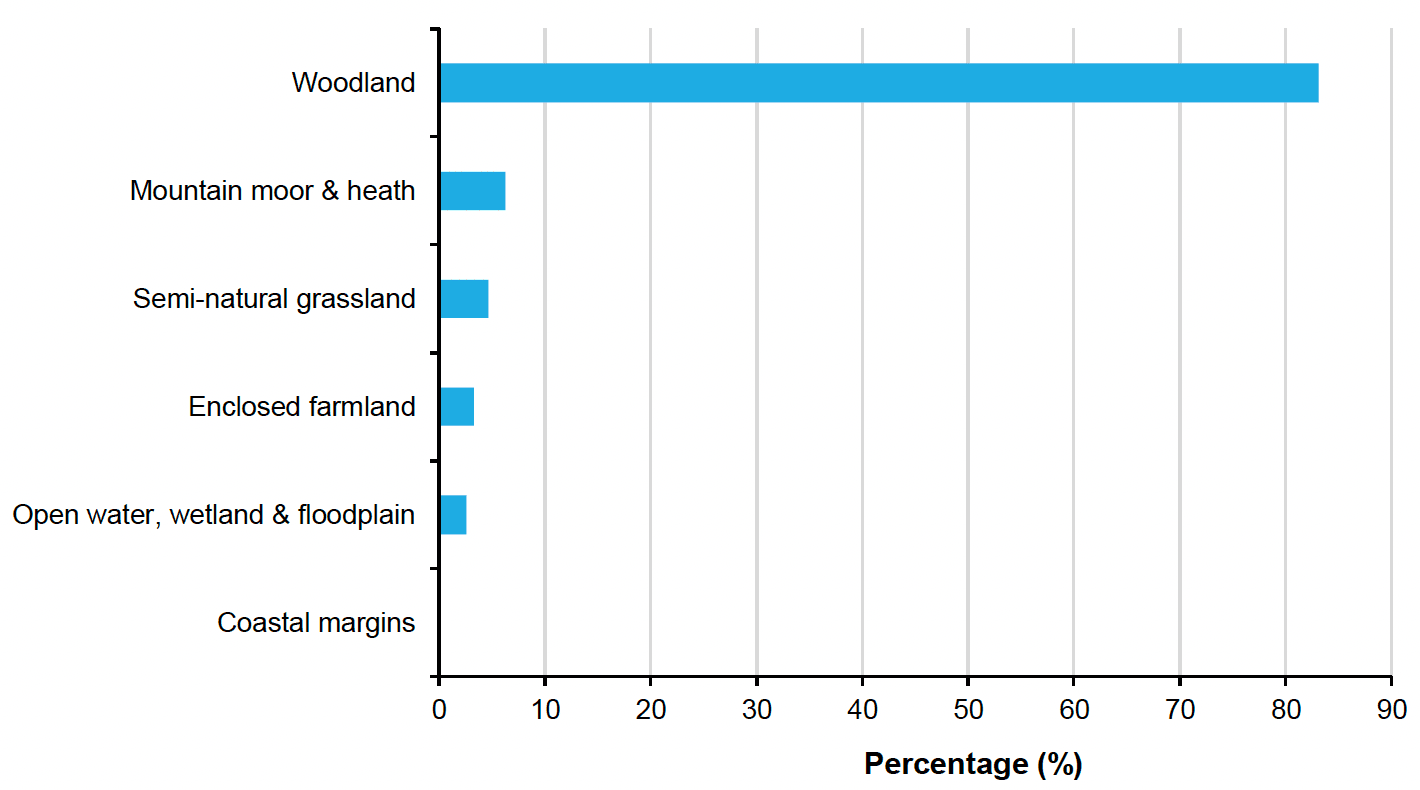
Most PM2.5 in Scotland is removed by woodland This accounts for 83% of all PM2.5 removed in 2019. Also, it is the rural authorities that account for most of the removal of this dangerous pollutant, even though they are not the authorities that benefit most from the removal.
Source : Office for National Statistics and UK Centre for Ecology and Hydrology
Noise mitigation by vegetation
The Scottish Government estimated over one million people in Scotland are exposed to regular noise of 55 decibels or greater, around the volume of normal speech. Vegetation acts as a buffer against noise pollution, for example, in urban areas with road traffic noise. Forest Research found that planting buffers of trees and shrubs can reduce noise by five to ten decibels for every 30 metres width of woodland. Noise pollution causes adverse health outcomes through lack of sleep and annoyance, even hearing loss from prolonged exposure. Eftec and others (2018) have developed initial estimates of the benefits vegetation has in reducing noise.
These estimates are considered minimum values, but further work is needed to develop more refined and robust estimates. The number of buildings receiving mitigation in Scotland is estimated to be 7,000 (Table 1). This is lower than estimates for other countries but could be largely influenced by the different noise metric used. Where these metrics were compared, the metrics used in Scotland covered a smaller area than the metrics used elsewhere. For further methodological information please see the extending noise regulation estimates produced by Eftec and others (2018).
| Noise band in noise metric by decibel1 | England | Scotland | Wales | Northern Ireland | UK |
|---|---|---|---|---|---|
| More than 80 | - | - | - | - | - |
| 75.0-79.9 | 1,000 | - | - | - | - |
| 70.0-74.9 | 8,000 | - | 1,000 | - | - |
| 65.0-69.9 | 36,000 | 1,000 | 3,000 | 1,000 | - |
| 60.0-64.9 | 98,000 | 6,000 | 8,000 | 4,000 | - |
| Total | 143,000 | 7,000 | 12,000 | 5,000 | 167,000 |
Source: Eftec and others
Notes:
1. 5 dBA bands applied along with guidance in Defra's noise pollution: economic analysis published in 2014.
2. Number of dwellings receiving mitigation in Scotland is likely to be lower than the estimates for the other countries because Eftec and others (2018) used the Lden noise metric rather than the LA1018 metric which was not available for Scotland.
3. Urban vegetation includes large woodlands (>3,000m2) and smaller woodlands (<3,000m2), but not very small woodlands (<=200m2).
In 2019, the value of noise reduction in Scotland was £665,000 in avoided loss of quality adjusted life years (QALY) from sleep disturbance and annoyance. Valuations based on QALY are economic welfare values, which investigate how noise reduction affects people's social welfare. The annual avoided loss of quality adjusted life for the UK was worth £14.2 million in 2019.
| Noise band in noise metric by decibel1 | England | Scotland | Wales | Northern Ireland | UK |
|---|---|---|---|---|---|
| More than 80 | 2 | - | - | - | 2 |
| 75.0-79.9 | 160 | - | 12 | 3 | 175 |
| 70.0-74.9 | 1,197 | 8 | 115 | 61 | 1,381 |
| 65.0-69.9 | 4,368 | 134 | 339 | 153 | 4,994 |
| 60.0-64.9 | 8,437 | 522 | 729 | 351 | 10,039 |
| Total | 14,164 | 665 | 1,196 | 567 | 16,591 |
Source: Eftec and others
Notes:
1. 5 dBA bands applied along with guidance in Defra's noise pollution: economic analysis published in 2014.
The asset value of noise mitigation from vegetation in Scotland was £36 million in 2019. Scotland made up around 4% of the £903 million asset value of noise mitigation across the UK. The asset value for noise reduction in Scotland is based on the estimated future flow of benefits over 100 years.
Many assumptions were made when estimating the future flow of value from noise mitigation by urban vegetation. For example, population affected was held constant and the impact of electric cars was not considered.
Urban cooling
The urban heat island effect means that cities and towns are prone to higher temperatures than the rural environments surrounding them. Green and blue spaces, such as parks and lakes, can cool urban environments through the process of evapotranspiration and shading. This benefits the economy by avoiding labour productivity loss and reducing the use of artificial cooling (air conditioning).
Eftec and others (2018) estimated the cooling effect provided by natural capital for 11 city regions across Great Britain, including two Scottish regions – Glasgow and Edinburgh. The cooling effect is based on reducing heat on hot days. "Hot days" refers to any day with a temperature between 28 degrees Celsius and 35 degrees Celsius, as defined by the Eftec and others (2018) report.
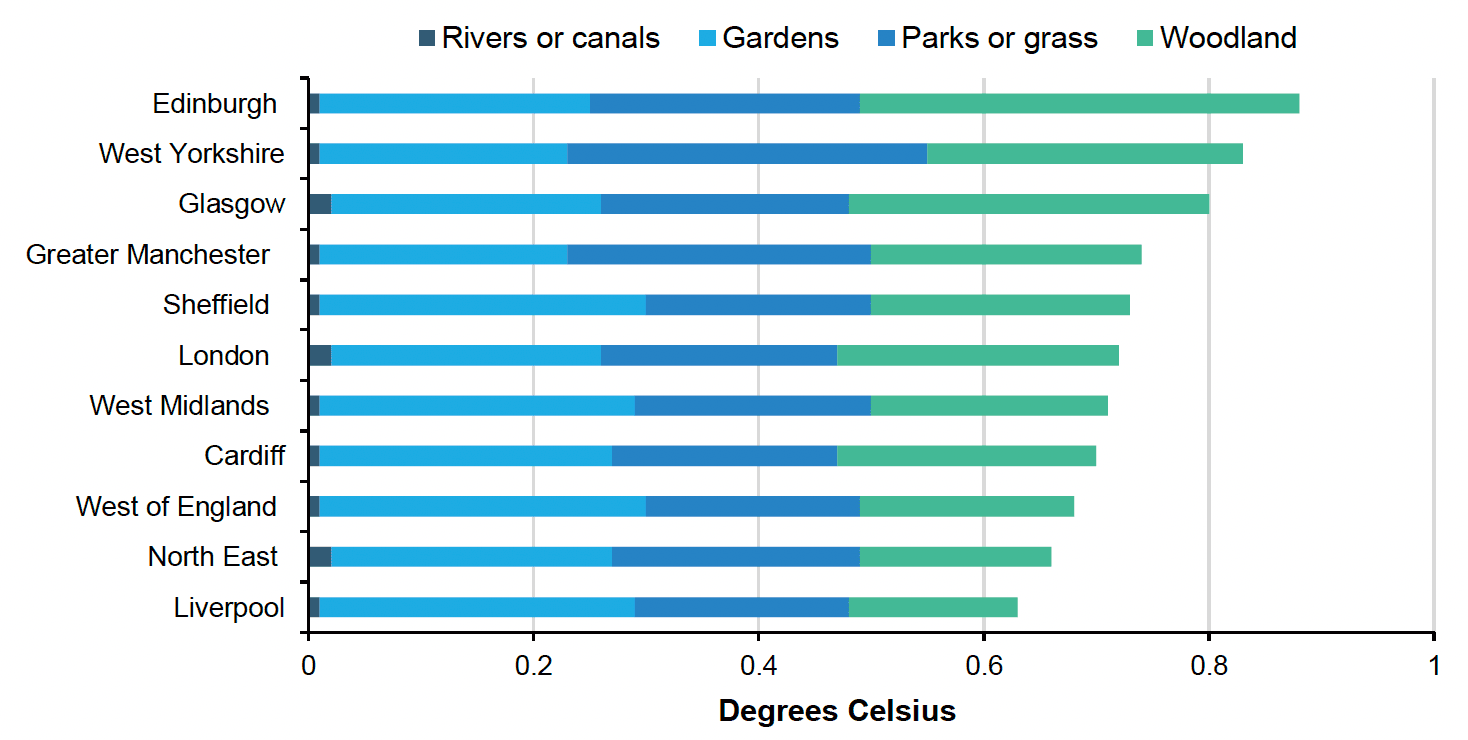
As shown in Figure 34, the cooling effect in both Glasgow and Edinburgh is similar, with Edinburgh's green and blue space providing just 0.08 degrees more cooling. For all areas in the UK, as well as both Scottish cities included here, green spaces (such as parks) provide substantially more cooling than blue spaces (such as lakes).
Edinburgh has a greater cooling effect than all other city regions mentioned in Eftec and others (2018), closely followed by Glasgow. Figure 34 shows Edinburgh has a cooling effect 0.14 degrees Celsius greater than the average of the 11 Great British city regions covered. Scottish cities have the highest cooling effects because of the amount of woodland relative to the size of the city region.
Source : Eftec and others (2018)
The value of green space in Scotland increased to £3.82 million in 2019 before falling to £0.33 million in 2020 (Table 3). These values are low compared with other Great British city regions such as London, which had the highest avoided costs in both 2019 and 2020 at £360.2 million and £312.1 million, respectively. This is because London, of all regions included here, has the largest economy and highest number of hot days (see Table 4). The total number of hot days across all regions of Britain during 2019 was nearly half of those in 2018.
However, Scottish city regions experienced an overall increase in the number of hot days in 2019, with Edinburgh seeing an extra 0.4 days over 28 degrees Celsius, and Glasgow reporting no change from its 2018 total. This 29% increase in hot days resulted in a 6% increase in avoided costs due to urban cooling effects, up from £3.6 million in 2018 to £3.8 million in 2019 (2020 prices).
| City Region | 2017 | 2018 | 2019 | 2020 |
|---|---|---|---|---|
| Cardiff | 5.88 | 4.75 | 5.52 | 10.82 |
| Greater Manchester | 1.39 | 8.79 | 10.81 | 16.91 |
| Liverpool | 0.80 | 4.18 | 6.20 | 9.91 |
| London | 212.02 | 647.48 | 360.19 | 312.07 |
| North East | 0.03 | 0.07 | 2.41 | 0.72 |
| Sheffield | 3.11 | 7.93 | 7.92 | 7.90 |
| West Midlands | 16.33 | 28.04 | 36.04 | 39.25 |
| West of England | 12.31 | 10.38 | 13.43 | 21.37 |
| West Yorkshire | 2.00 | 8.36 | 6.66 | 13.99 |
| Edinburgh | - | 0.38 | 1.41 | 0.18 |
| Glasgow | - | 3.22 | 2.40 | 0.15 |
| Scottish Total | - | 3.60 | 3.82 | 0.33 |
| Total GB | 253.87 | 723.58 | 452.99 | 433.26 |
Source: Eftec and others (2018) and Met Office
| City Region | 2017 | 2018 | 2019 | 2020 |
|---|---|---|---|---|
| Cardiff | 3.1 | 4.9 | 2.3 | 4.9 |
| Greater Manchester | 0.8 | 4.2 | 3.0 | 3.7 |
| Liverpool | 1.8 | 6.3 | 2.8 | 3.0 |
| London | 7.3 | 23.2 | 7.8 | 13.8 |
| North East | 0.0 | 0.1 | 0.8 | 0.5 |
| Sheffield | 1.6 | 5.2 | 5.5 | 5.0 |
| West Midlands | 4.6 | 10.3 | 5.6 | 8.0 |
| West of England | 4.6 | 8.4 | 3.6 | 7.1 |
| West Yorkshire | 1.1 | 3.0 | 3.6 | 3.2 |
| Edinburgh | 0.0 | 0.4 | 0.8 | 0.1 |
| Glasgow | 0.0 | 1.0 | 1.0 | 0.1 |
| Scottish Total | 0.0 | 1.4 | 1.8 | 0.2 |
| Total GB | 24.8 | 66.9 | 36.8 | 49.5 |
Source: Eftec and others (2018) and Met Office
Notes:
1. In 2017 there were no days classed as hot days in Edinburgh and Glasgow.
In 2020, while the total number of hot days for all regions in Britain increased by 35% from 36.8 to 49.5, Scottish city regions showed a decrease from 1.8 to 0.2 hot days from 2019. Correspondingly, this has resulted in a 91% decrease in annual value, down to £330,000. As might be expected, the cooling effects provided by green and blue urban spaces are limited in their benefits by the number of hot days. For example, more cold days and fewer hot days will decrease the demand for air conditioning, so the financial benefit of cooling is reduced.
The 2020 asset value of urban cooling for Glasgow and Edinburgh city regions are £133.2 million and £69.5 million, respectively (2020 prices). These are calculated using the average number of hot days over the last five years and projected green space urban cooling increases over the next 100 years. The £202.7 million asset value of urban cooling in Scotland has risen steadily year-on-year and now stands at nearly three times its £51.4 million estimate from 2016.
With climate change projected to continue throughout the century, green and blue urban spaces will come to play an increasingly important role in urban temperature regulation. The Met Office's derived projections on climate change suggest that, at a global mean warming of 2 degrees Celsius, both Scotland's hot and cool days in summer could warm by 1 to 1.5 degrees Celsius, with summers as hot as 2018 becoming around 50% more likely. Accordingly, the value of urban green and blue spaces will likely increase as their cooling effects will continue to provide valuable regulating services affecting productivity and avoided artificial cooling costs.