Scottish Mentoring and Leadership Programme: impact and value for money evaluation
Findings of the impact and value for money evaluation of the Scottish Mentoring and Leadership Programme (SMLP), looking at the MCR Pathways element of the programme for care experienced young people.
3. Impact of the MCR Pathways programme on outcomes
This chapter summarises the impact of the MCR Pathways programme on the different outcomes of interest: attendance, exclusion, staying-on rates, attainment and positive post-school destinations.
As discussed in Chapter 2, given the varying robustness and statistical power of the different approaches taken, the most weight should be placed on the statistical significance of Approach B2 and the effect sizes of Approaches B2, C, and D.
Attendance
The analysis did not find clear results on whether MCR has had a significant effect on attendance rates overall, although it does suggest that it has led to an improvement in S5 attendance.
Analysis of attendance was complicated by attendance data only being available every second year, by not having data on when participation in MCR started and ended, and because of the impact of the pandemic[7]. Given these constraints, these results are based on small sample sizes and should be treated with caution.
Estimates of the impacts of MCR on attendance rates are set out in Table 3.1.
| Attendance measures |
Approach A Effect size |
Approach B1 Effect size |
Approach B2 Effect size |
Approach C Effect size |
Approach D Effect size |
|---|---|---|---|---|---|
| S4 attendance | 12.3*** | 4.1*** | 2.8 | 2 | 1 |
| Sample sizes[8] | 206 vs 201 | 710 vs 5,154 | 710 vs 984 | 571 | 274 |
| S5 attendance | 9.4** | 3.3** | 4.4** | 1 | 1 |
| Sample sizes | 294 vs. 262 | 1,006 vs. 3,205 | 1,006 vs. 559 | 559 | 236 |
| S6 attendance | 3.9 | 1.0 | 3.1 | 2 | 2 |
| Sample sizes | 284 vs. 152 | 750 vs. 1,567 | 750 vs. 260 | 330 | 107 |
˜*** denotes findings significant at the 99% level, ˜** denotes findings significant at the 95% level, and ˜* denotes findings significant at the 90% level.
Approaches A and B1 indicated that there were statistically significant differences in the attendance rates of care experienced pupils in S4 and S5, but not S6. Approach B2, one of the three more robust approaches, found a significant effect for attendance in S5 but not in S4 and S6. Approaches C and D did not find any significant effect on attendance at S4, S5, or S6 (Table 3.1). As such, we conclude that there is no evidence of the effect of the programme on attendance in S4 and S6 but there is evidence of a potential increase in attendance in S5. The B2 Approach estimates that care experienced pupils attended school around 28,850 days more in S5 as a result of the MCR Pathways programme between 2014/15 and 2021/22[9].
Exclusions
Overall, the results of the evaluation indicate that MCR has had a positive effect on reducing the proportion of pupils who are ever excluded from school. It was estimated that its introduction has led to a fall in the proportion of care experienced (CE) pupils who are ever excluded of between seven and nine percentage points.
| Exclusion measures |
Approach A Effect size[10] |
Approach B1 Effect size |
Approach B2 Effect size |
Approach C Effect size |
Approach D Effect size |
|---|---|---|---|---|---|
| No exclusions | 15%*** | 11%*** | 9%*** | 9%** | 7%* |
| Any exclusions | -15%*** | -11%*** | -9%*** | -9%** | -7%* |
| Of which, 1-5 days in total | -3%*** | -3%*** | -2%*** | -2% | -1% |
| Of which, 6-10 days in total | -3%*** | -2%*** | -2%*** | -2% | -1% |
| Of which, more than 10 days | -9%*** | -7%*** | -5%*** | -3% | -3% |
| Sample sizes |
940 vs. 940 |
3,452 vs 13,142 | 3,452 vs. 2,590 | 701 | 290 |
˜*** denotes findings significant at the 99% level, ˜** denotes findings significant at the 95% level, and ˜* denotes findings significant at the 90% level.
Table 3.2 sets out the estimated effect of MCR in reducing exclusions amongst care experienced pupils. All analytical approaches indicated that the MCR Pathways programme significantly reduced the proportion of pupils ever excluded from school. For the more robust Approaches (B2, C, and D), the estimated reduction in the share of care experienced pupils excluded for any period ranged from seven to nine percentage points. The B2 Approach, our favoured method, yielded a result of a nine percentage point reduction (with a 95% confidence interval of seven to twelve percentage points). In other words, the B2 Approach estimates that there were between 245 and 400 fewer care experienced pupils who were ever excluded as a result of the MCR Pathways programme.
The programme appears to be effective in reducing exclusions across all durations, with a more pronounced impact on those excluded for more days in total. All approaches show larger effects for reducing exclusions for more than 10 days than for reducing exclusions for a smaller number of days. This suggests that the programme may have a greater impact on pupils at risk of exclusion for more days in total.
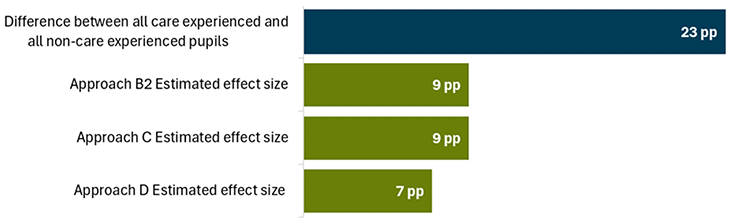
To provide context to the size of the impact, Figure 3.1 shows estimated effects of the programme compared to the difference in the level of exclusions between care experienced and non-care experienced pupils across the same period as for calculating the effects of the programme, namely for all pupils in S4 between 2014/15 to 2021/22. Overall, 6% of non-care experienced pupils are ever excluded from school compared to 29% of care experienced pupils, a difference of 23 percentage points[11]. This means that the estimated impact of the programme (7 to 9 percentage points) equates to around a third of this difference.
Staying-on at school rates
The analysis indicates that the MCR Pathways programme has had a positive impact on rates of staying-on in school, with an estimated increase of around eight to thirteen percentage points in the proportion of the target population staying on to S5.
In Scotland, while the end of compulsory education is at age 16, the first formal exit point differs by month of birth. Older pupils (those born between March and September) can leave school after the end of S4, while younger pupils (those born between October and February) must stay on to the following Christmas, the end of Term 2 in S5. Pupil census data was used to determine if pupils stayed on to the start of S5 and S6. However, the census is conducted early in the academic year and may not reflect pupils who leave midway through a year. While it is not possible to estimate the number of pupils who stay on to the end of S5, it is possible to derive an additional measure of staying-on: whether pupils achieved qualifications at two or more annual exam diets. This indicates the proportion of pupils who stayed on until the end of S5 (when exams are taken) and earned at least one qualification in both S4 and S5. This measure is shown in Table 3.3 alongside the S5 and S6 staying-on rates measures.
| Staying-on measures |
Approach A Effect size |
Approach B1 Effect size |
Approach B2 Effect size |
Approach C Effect size |
Approach D Effect size |
|---|---|---|---|---|---|
| S5 Staying-on rate | 18%*** | 14%*** | 13%*** | 10%* | 8%* |
| S6 Staying-on rate | 27%*** | 15%*** | 14%*** | 9% | 5% |
| Quals achieved in two or more exam diets | 28%*** | 10%*** | 10%*** | 8%* | 8%* |
| Sample sizes |
940 vs 940 |
3,452 vs 13,142 | 3,452 vs 2,590 | 701 | 290 |
˜*** denotes findings significant at the 99% level, ˜** denotes findings significant at the 95% level, and ˜* denotes findings significant at the 90% level.
The MCR Pathways programme had a positive effect on pupils staying on in education across all three measures (Table 3.3).
- In relation to S5 staying-on rates, all analytical approaches showed a statistically significant effect, with estimated effect sizes ranging from eight to thirteen percentage points among the more robust approaches (Approaches B2, C, and D). The B2 Approach, our favoured method, yielded a result of a thirteen percentage point increase (with 95% confidence intervals of eleven to fifteen percentage points). This equates to an estimate of between 365 and 525 more pupils staying on to S5 because of the MCR Pathways programme during the period 2014/15 to 2021/22.
- The programme also positively impacts rates of staying-on to S6, with estimated effects of five to fourteen percentage points for the more robust Approaches (B2, C, and D). The B2 Approach gave a result of a fourteen percentage point increase (with 95% confidence intervals of twelve to seventeen percentage points). This equates to between 410 and 570 more pupils staying on to S6 because of the programme during this period.
- It has also had a positive impact on increasing the proportion of pupils achieving qualifications in two or more exam diets by between eight to ten percentage points for Approaches B2, C, and D. The estimate from the B2 Approach was a ten percentage point increase (with 95% confidence intervals of seven to twelve percentage points) The means the B2 Approach estimates that between 250 and 405 more pupils achieved qualifications in two or more exam diets as a result of the programme during the period 2014/15 to 2021/2022.
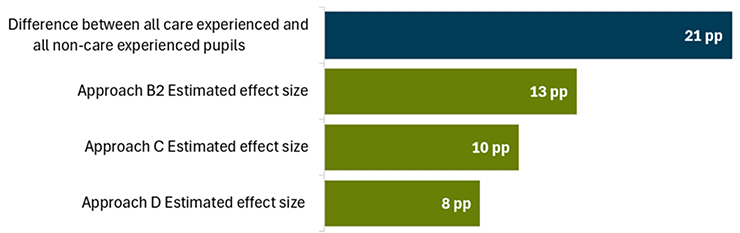
Figure 3.2 shows the estimated effects of the programme compared to the difference in the S5 staying-on rate between all care experienced and non-care experienced pupils across Scotland in S4 between 2014/15 and 2021/2022. Overall, 68% of care experienced pupils stay on to S5 or beyond, compared to 89% of all non-care experienced pupils, a difference of 21 percentage points. This means that the estimated impact of the programme (8 to 13 percentage points) equates to between a third to two-thirds of this gap. This means that the programmes impact is equivalent to a larger share of the gap between all care experienced and non-care experienced pupils for this outcome measure than for any other.
Attainment
The results of the evaluation suggest that the programme has had a positive effect on raising attainment across all summary measures that were examined. In relation to achieving 3 or more Level-5 qualifications, the programme has led to an increase of between six to seven percentage points. The B2 Approach, our favoured method, yielded a result of a seven percentage point increase (with a 95% confidence interval of five to ten percentage points).
The estimated impact of the programme was larger for the less advanced measures of attainment and smaller for the more advanced ones. This is unsurprising given that advanced qualifications are undertaken by fewer pupils and are typically sat in S5 and S6 after the end of compulsory schooling.
Table 3.4 displays the estimated effect sizes of the MCR Pathways programme on seven different summaries of attainment across the different analytical approaches.
| Attainment measures |
Approach A Effect size |
Approach B1 Effect size |
Approach B2 Effect size |
Approach C Effect size |
Approach D Effect size |
|---|---|---|---|---|---|
| 1+ English Level-5 | 18%*** | 8%*** | 6%*** | 6%* | 6%* |
| 1+ Maths Level-5 | 8%*** | 5%*** | 4%*** | 4% | 3% |
| 3+ Level-5 | 21%*** | 9%*** | 7%*** | 7%* | 6%* |
| 5+ Level-5 | 11%*** | 5%*** | 5%*** | 4% | 3% |
| 3+ Level-6 (Highers) | 9%*** | 4%*** | 4%*** | 3% | 3% |
| 5+ Level-6 (Highers) | 4%*** | 2%*** | 2%*** | 1% | 1% |
| 1+ Level-7 | 4%*** | 2%*** | 1%** | 1% | 1% |
| Sample sizes |
940 vs 940 |
3,452 vs 13,142 | 3,452 vs 2,590 | 701 | 290 |
˜*** denotes findings significant at the 99% level, ˜** denotes findings significant at the 95% level, and ˜* denotes findings significant at the 90% level.
Approach B2 suggested that the estimated effect of the programme was statistically significant for all seven measures. Regarding the likely scale of the impact of the programme on these five measures of attainment, the estimated effect sizes for Approaches B2, C and D were as follows:
- Six percentage points for achieving one or more Level-5 qualifications in English. The B2 estimate of a 6pp increase equates to an increase of between 135 and 300 care experienced pupils achieving this measure.
- Three to four percentage points for achieving one or more Level-5 qualification in Maths. The B2 estimate of a 4pp increase equates to an increase of between 80 and 205 care experienced pupils achieving this measure.
- Six to seven percentage points for achieving three or more Level-5 qualifications. The B2 estimate of a 7pp increase equates to an increase of between 175 and 335 care experienced pupils achieving this measure.
- Three to five percentage points for achieving five or more Level-5 qualifications. The B2 estimate of a 5pp increase equates to an increase of between 95 and 225 care experienced pupils achieving this measure.
- Three to four percentage points for achieving three or more Level-6 qualifications. The B2 estimate of a 4pp increase equates to an increase of between 65 and 175 care experienced pupils achieving this measure.
- One to two percentage points for achieving five or more Level-6 qualifications. The B2 estimate of a 2pp increase equates to an increase of between 25 and 105 care experienced pupils achieving this measure.
- One percentage point for achieving one Level-7 qualification. The B2 estimate of a 1pp increase equates to an increase of between 5 and 70 care experienced pupils achieving this measure.
While the effect sizes appear small when presented as a percentage point change, the impact of the programme should not be underestimated. For example, given that among all care experienced pupils, just 10% achieve 3 or more Level-6 qualifications, the estimated effect of the programme of a three to four percentage point increase is considerable.
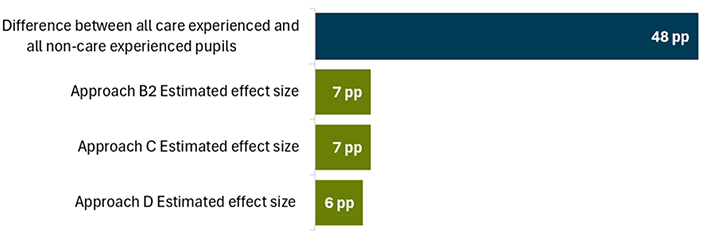
Over the period 2014/15 to 2021/22, 75% of non-care experienced pupils across Scotland achieved three or more Nat-5 qualifications compared to 27% of all care experienced pupils, a difference of 48 percentage points (Figure 3.3). This means that the estimated impact of the programme (6 to 7 percentage points) equates to less than a fifth of this gap. This is, therefore, a smaller narrowing of the gap compared to the other outcomes where the programme has had a more substantial effect.
Post-school destinations
The results of the evaluation indicate that the MCR Pathways programme has had a positive effect on pupils post-school destinations. It has increased the proportion of care experienced pupils who enter Further Education and training on leaving school and reduced the proportion who are unemployed. However, the results do indicate a small reduction in the size of the positive effect on post-school destinations over time, comparing data at three months and nine months post-school.
The estimated impact of MCR on post-school destinations three months after leaving school are presented in Table 3.5, while the estimates for nine months after leaving are displayed in Table 3.6:
- All positive destinations: MCR has had a positive effect on increasing the proportion of care experienced pupils who enter any positive destinations after school[12]. The estimated effect of the MCR Pathways programme decreases slightly over time but remains significant. At three months, the estimated effect sizes for Approaches B2, C, and D range from seven to eight percentage points, (with an estimate of eight percentage points from our favoured Approach B2, with 95% confidence intervals of six to ten percentage points). The corresponding range for nine months after leaving school is from five to seven percentage points (with an estimate of seven percentage points from Approach B2 with 95% confidence intervals of five to ten percentage points). This equates to an estimate of between 180 and 340 more pupils going to a positive destination nine months after leaving school.
- Further Education: The estimated effect on increasing participation in Further Education (FE) also decreases over time but remains significant. At three months, the estimated effect size for Approaches B2, C, and D is six percentage points. The corresponding estimates for nine months after leaving school range from three to five percentage points.
- Training: The results indicate that MCR increases the proportion of the target group entering training post-school. At three months, the estimated effect size is three percentage points. The estimates for nine months after leaving are similar, ranging from two to three percentage points.
- Higher Education: The effect of the programme on progression to Higher Education (HE) was of a similar magnitude to the impact on entry to training. At three months, the estimated effect sizes range from three to four percentage points. The estimates for nine months after leaving, ranged from two to three percentage points.
- Unemployment: The results suggest that the programme's impact on reducing unemployment is positive and maintained over time. At three months, the effect sizes for B2, C, and D were a reduction of between four and six percentage points. The corresponding estimates for nine months after leaving was a reduction of five percentage points. This indicates that the programme has a positive effect on reducing unemployment, lasting to at least nine months after leaving school.
| Post-school destinations at 3 months |
Approach A Effect size |
Approach B1 Effect size |
Approach B2 Effect size |
Approach C Effect size |
Approach D Effect size |
|---|---|---|---|---|---|
| Higher Education | 8%*** | 4%*** | 4%*** | 3% | 3% |
| Further Education | 10%*** | 4%*** | 6%*** | 6%* | 6% |
| Employed | -3%* | -2%*** | -4%*** | -2% | -2% |
| Training | 3%** | 3%*** | 3%*** | 3% | 3% |
| Voluntary work | 1% | 0% | 0% | 0% | -1% |
| Personal Skills Development | 1% | 3%*** | 2%*** | 1% | 1% |
| Activity Agreement | -1% | -3%*** | -3%*** | -4% | -3% |
| All positive | 19%*** | 9%*** | 8%*** | 8%* | 7%* |
| Unemployed | -13%*** | -6%*** | -6%*** | -5%* | -4%* |
| Unknown | -7%*** | -3%*** | -1%** | -2% | -1% |
| Sample sizes |
940 vs 940 |
3,452 vs 13,142 | 3,452 vs 2,590 | 701 | 290 |
˜*** denotes findings significant at the 99% level, ˜** denotes findings significant at the 95% level, and ˜* denotes findings significant at the 90% level.
| Post-school destinations at 9 months |
Approach A Effect size |
Approach B1 Effect size |
Approach B2 Effect size |
Approach C Effect size |
Approach D Effect size |
|---|---|---|---|---|---|
| Higher Education | 6%*** | 3%*** | 3%*** | 3% | 2% |
| Further Education | 11%*** | 3%*** | 5%*** | 5%* | 3% |
| Employed | -2% | -1% | -2%** | -1% | -1% |
| Training | 1% | 3%*** | 3%*** | 3% | 2% |
| Voluntary work | 1% | 0% | 0% | 1% | 0% |
| Personal Skills Development | 0% | 2%*** | 1%*** | 1% | 1% |
| Activity Agreement | -1% | -3%*** | -3%*** | -2% | -2% |
| All positive | 17%*** | 8%*** | 7%*** | 6%* | 5%* |
| Unemployed | -9%*** | -4%*** | -5%*** | -5%* | -5%* |
| Unknown | -8%*** | -4%*** | -2%*** | -1% | -1% |
| Sample sizes | 938 vs. 939 | 3,442 vs. 13,097 | 3,442 vs. 2,581 | 701 | 290 |
˜*** denotes findings significant at the 99% level, ˜** denotes findings significant at the 95% level, and ˜* denotes findings significant at the 90% level.
In summary, the MCR Pathways programme generally shows positive and significant effects on pupils' post-school destinations, though with some diminishing effects over time. The programme's impact on reducing unemployment is particularly noteworthy, as it remains consistent even nine months after leaving school. The effect on ˜All positive outcomes also remains significant, although it decreases slightly over time. The programme's long-term impact (at 9 months post-school) appears to be positive, with pupils more likely to engage in Further Education, training, and employment while reducing the likelihood of unemployment.
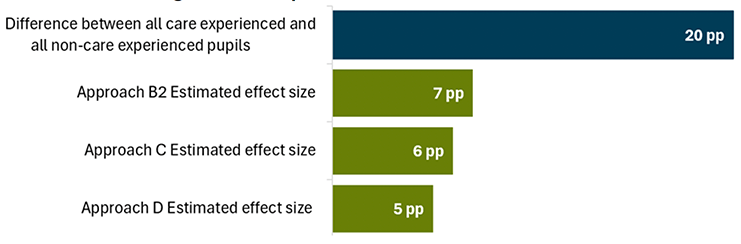
Figure 3.4 compares the estimated impact on positive destinations 9 months after leaving school compared to the difference in this outcome between all care experienced and non-care experienced pupils across Scotland. Overall, 90% of non-care experienced pupils in S4 between 2014/15 and 2021/22 were in a positive outcome 9 months after leaving school compared to 70% of all care experienced pupils, a difference of 20 percentage points. This means that the estimated impact of the programme (5 to 7 percentage points) equates to around a quarter to a third of this difference.