Scottish Mentoring and Leadership Programme: impact and value for money evaluation
Findings of the impact and value for money evaluation of the Scottish Mentoring and Leadership Programme (SMLP), looking at the MCR Pathways element of the programme for care experienced young people.
Appendix A - Technical appendix
This appendix sets out the technical details of the analysis presented in the main body of the report, including the propensity score matching (PSM) exercises and the regression modelling of outcomes at school-level. Supplementary tables referred to in this appendix are available alongside this publication in Excel format. The supporting tables are available here: supporting tables.
Data processing and dataset linking
The data deployed in the evaluation consists of three primary sources: various pupil data records from ADR Scotland (a partnership between the Scottish Government and the Scottish Centre for Administrative Data Research), MCR Pathways programme data, and school-level contextual data.
This section details the process used to link and harmonise the multiple administrative and programme-specific datasets that underpin the analysis. The methodology was designed to create pupil-level and school-level datasets covering pupils in S4 in school years 2014/15 to 2021/2022.
Identification of care experienced pupils and MCR Pathways participants
The evaluation was limited to the MCR Pathways element of SMLP and for Group 1 (care experienced) pupils only. Columba 1400 pupils and MCR Pathways Group 2 (˜tough realities) are not included in the analysis. The exclusion of Columba 1400 pupils and MCR Pathways Group 2 is because the criteria for participating in these are flexible and not defined on the basis of readily observable pupil characteristics. School-coordinators and other school staff have discretion about who should be offered a place on the programme at the local level. As such, it is not possible to identify suitable control groups that would enable robust analysis for these groups.
The eligible population was therefore defined as MCR Pathways Group 1 pupils only, and included pupils who met the following criteria:
- In a school that was part of the MCR Pathways programme and in S4 between 2014/15 and 2021/22 (based on Pupil Census data).
- Had received 10 or more mentoring sessions on the MCR Pathways programme (based on data from MCR).
- Had a record of any degree of experience in care (based on CLAS data, as discussed below), e.g. with fostering or adoption, or care within their families such as an aunt or grandparent (also known as kinship care), or with a family friend, or in residential care.
Pupils attending participating schools
Whether a pupil was in a school offering MCR Pathways between 2014/15 and 2021/22 was defined using the School Census and MCR data on school participation.
The Scottish School Census is an annual individual-level data collection conducted by the Scottish Government that gathers detailed information on all pupils in all publicly funded schools. It provides key demographics of each pupil (gender, ethnicity etc.), school attended, and stage of schooling.
In total, sixteen separate annual waves (2008/09 to 2023/24) were collated. Each wave contained around 678,000 to 705,000 records per annum. The same pupil will appear in multiple years and is identified by an ID that stays stable over time. Overall, there were around 50,000 to 55,000 unique pupils in S4 per wave.
Within each wave, around 0.3% to 0.5% of records were duplicate pupils, typically due to pupils moving schools mid-year. In these instances, the later school record was retained. This data source provided the main spine for the data assembly with most data linked via the pupil ID and academic year via the Pupil Census record.
MCR provided details of 126 schools that joined (and left) the programme and when between 2007/08 and 2023/24 (note only one school joined the programme before 2014/15). These were also appended to the school-level data to identify the care experienced pupils attending participating schools and academic years in which the programme was being delivered.
A small number of schools were excluded from the whole dataset because they did not cater for pupils across all secondary years or closed during the period 2014/15 to 2021/22. For example, this included schools such as Buckhaven High School, Kincorth Academy, and James Hamilton Academy. None of these participated in the MCR Pathways programme.
Pupil programme participation
Whether a pupil had received ten or more mentoring sessions was defined using MCR provided data on programme participation. MCR provided data for the period 2016/17 to 2024/25.
Given that we have no records of MCR participants in earlier cohorts, and that the latest data available for outcomes such as qualifications and destinations is 2023/24, means that final analysis is based on those in S4 between 2014/2015 and 2021/2022.
The data from MCR was provided separately for Glasgow and the Rest of Scotland and categorised by ˜Leavers, ˜S5a, and ˜S4fS5 cohorts. As well as providing the pupil ID, it included mentoring status (whether received 10+ mentoring sessions or not) and MCRs record of the care experience of the pupil. This dataset provided records of 5,580 unique pupils, of which 2,115 had received 10+ mentoring sessions. The match rate with the Pupil Census was greater than 99%. In total, 737 cases where not in S4 between 2014/15 and 2021/2022, giving 1,378 unique cases within the target period. Data fields used in the propensity score matching were missing for around 4% of cases, giving 1,315 cases (before excluding cases because of the care experience flags).
Pupil care experience
Whether a pupil was care experienced was defined using data from the Children Looked After Survey (CLAS). This is an annual individual-level data collection that gathers detailed information on every child in the care of Scotland's 32 local authorities. It provides records of all care experience episodes for every pupil and was used to identify pupils in the potentially eligible population for the programme.
Initial processing of this data restructured this to one record per pupil and included information on whether they were ever care experienced, types of care experience, and if they were in care during each or any academic year. All pupils appearing in the dataset (regardless of number or type of episodes) were considered to be care experienced for the purposes of the analysis. Around 4% of CLAS records data did not match Pupil Census data. It was assumed that there were no pupils who had been in care but with no record of care experience in the CLAS data.
It should be noted that there was a discrepancy between the MCR data and the CLAS data on whether pupils had experienced care. Not all MCR participants flagged as care experienced appeared in the CLAS dataset. As shown in Table A1.1, 29% of the MCR Pathways Group 1 participants, based on the MCR data, had no record of care experience in the CLAS data. The reason for the discrepancy for the ˜Care Experience status between the MCR data and the CLAS data is unclear. However, the discrepancy is decreasing over time.
| Year of S4 | No Care Experience flagged in CLAS data | Care Experience flagged in CLAS data | Care Experience flagged in MCR data | Number of pupils |
|---|---|---|---|---|
| 2014/15 | 45% | 55% | 100% | 20 |
| 2015/16 | 63% | 37% | 100% | 54 |
| 2016/17 | 41% | 59% | 100% | 102 |
| 2017/18 | 38% | 62% | 100% | 142 |
| 2018/19 | 39% | 61% | 100% | 194 |
| 2019/20 | 26% | 74% | 100% | 225 |
| 2020/21 | 24% | 76% | 100% | 295 |
| 2021/22 | 22% | 78% | 100% | 283 |
| All | 29% | 71% | 100% | 1,315 |
To ensure consistency between how the control group and the participant group were defined in the analysis, the source used for defining pupils with care experience was the Children Looked After Survey (CLAS) and MCR data on care experience was ignored. This gave a total of 940 MCR participants included in the analysis.
The final analysis is based on 416,926 individual pupils in S4 between 2014/15 and 2021/22, of which 16,594 had experienced care. Of these, 3,452 had attended participating schools (for at least one academic year) and 13,142 attended schools that did not participate in the programme (at least for the duration of their time at the school). For all care experienced pupils between 2014/15 and 2021/22, the analysis is based on 82,016 pupil-academic year pairs.
Outcomes and contextual information
Data on the outcomes of interest was obtained by appending the following administrative datasets from the Scottish Government[35]:
- Attendance data: Statistics on pupil attendance and absence is collected by the Scottish Government at a pupil-level across Scotland. Nine separate waves were collated (annual between 2008/2011 and biennial thereafter). Around 0.1% to 0.3% of pupils in the Pupil Census were missing attendance data per wave. There were a very small number of records of attendance (<0.1%) that did not match any pupil in the Pupil Census data. These were deleted. Annual attendance rate was defined as actual attendance days (sum of actual attendance, late, work experience, and sick with educational provision) divided by possible attendance.
- Data on exclusions: The Scottish Government also collects information on exclusions at a pupil-level. Again, nine separate waves were collated (annual between 2008/2011 and biennial thereafter). There were a small number of records of exclusions (less than 1% each wave) that did not match any pupil in the Pupil Census data. It was assumed that pupils with no records of exclusion had never been excluded. This data provides records of all exclusions separately. The data was aggregated by pupils across waves to create summary measures of ever excluded and total number of days excluded.
- Leaver destinations were identified based on data collated by Skills Development Scotland. Sixteen annual waves (2008/09 to 2023/24) were included. There were around 4% of pupils in the Pupil Census who were missing data on leaver destinations. These were reported as ˜unknown. Duplicates within years (less than 0.01% of all entries) were deleted. As well as reporting on the individual type of destination, a measure of positive post-school destinations was computed. This included Higher Education, Further Education, employment, training, personal skills development and voluntary work.
- School attainment data: The Scottish Government collates data on attainment among pupils on an annual basis. This combines teachers professional judgements for primary and lower secondary on pupil performance against the Curriculum for Excellence with official exam results certified by the Scottish Qualification Authority (SQA). Sixteen annual waves were collated (2008/09 to 2023/24). The source data contained records of each qualification achieved in SQA examinations by pupil by exam diet, with information given on level of qualification, grade achieved, and subject. The data was aggregated by pupils across exam diets to count the total number of awards achieved at each level, number of awards achieved at each level in Maths and English qualifications, and the number of awards at each grade of Level-5 qualifications. We assume that this data is an accurate record of all SQA awarded qualifications and, therefore, that pupils without qualifications recorded will have not achieved any qualifications. Additionally, the qualifications data was used to define the staying-on measure of achieving qualifications in two or more exam diets.
- Staying-on measures: S5 and S6 staying-on measures were calculated based on the last year of schooling (S4, S5, S6) based on the Pupil Census data.
Additional contextual data was collated from the following sources:
- Additional Support Needs: data is compiled through the annual Pupil Census. Sixteen annual waves (2008/09 to 2023/24) were used with two file per wave, one covering reasons for support and one covering the nature of support. These files were restructured to one record per pupil per year summarising all reasons for support and types of support received. It was assumed that pupils with no records of support did not have any additional support needs.
- School- and area-level controls: Various school-level data was collated. This included ADR produced data covering roll size, rurality, denomination, SIMD profile, percentage of minority ethnic pupils per year. Employment rates and wage rates were appended to the school-level data based on the local authority of the school.
Data processing, linkage and analysis
The initial stages of the data linkage produced a dataset with a record for each pupil for each year. For the final pupil-level dataset the additional stages were undertaken.
- The data was transformed to include one record per pupil.
- The propensity score matching was undertaken and control groups flags were appended for Approaches A, B1, B2.
Included in the main analysis were pupils in S4 in the academic years 2014/2015 to 2021/22. This also meant that the analysis was based on pupils at secondary schools as the stage of schooling for pupils in special schools was recorded as ˜SP and therefore year of S4 was missing.
The final school-level dataset was created combining fixed school-level measures with aggregate counts from the pupil-by-year dataset to create a school-by-year dataset. This included:
- Whether a given school was participating in the MCR Pathways programme, the local authority of the school, the percentage of school catchment area within 6-fold urban-rural categories, the pupil/teacher ratio.
- Roll size, total roll size and roll size within S1 to S6 separately (and separate figures by whether care experienced or not).
- Number of non-white pupils, pupils with a disability flag, pupils where English is not their first language (and again separate figures by whether care experienced or not).
- All outcome measures: destinations after leaving school, qualifications achieved, grades achieved for Nat-5 qualifications, whether excluded and number of days excluded, and attendance measures. These were aggregated for all pupils as well as by whether care experienced or not.
Analytical Approach A: Participants versus non-participants
This approach examined the impact of the programme by comparing care experienced pupils participating in the programme to those not.
Table B.1 in the supporting tables compares the characteristics of MCR participants (Column B) to all care experienced pupils (Column E) and highlights some differences in the makeup of the two groups. MCR participants were more likely to be female (58% relative to 43%) and be more likely to have additional support needs (86% relative to 75%). To account for these differences, a propensity scores matching exercise was completed to identify a group of pupils in the control group that more closely resembled pupils participating in the MCR Pathways programme.
This was achieved by using propensity score matching (PSM) to remove differences in their characteristics that may bias simple comparisons of outcomes. This involved a two-stage process:
A first-stage probit regression compared the characteristics of programme participants and care experienced pupils in other schools, to predict the probability of participation for each pupil in the sample. The models included:
- Gender
- Ethnicity
- Disability
- English language ability
- Refugee status
- Additional support needs and
- National identity
School-level variables were also included:
- Size of pupil roll in 2019
- Size of S4 pupil population
- Proportion of pupil population with additional support needs
- Proportion of pupil population from minority ethnic backgrounds
- Proportion of pupil population with additional language support needs and
- Proportion of school catchment area within 6-fold urban-rural categories
These variables were chosen based on their availability and potential to influence the likelihood of a pupil being care experienced and/or participating in MCR Pathways. The estimated probabilities of participation are known as ˜propensity scores.
The resultant propensity scores were then used to match each programme participant with a care experienced pupil in other schools with whom they shared similar probabilities of participation in the programme (based on the observable individual-, school-, and area-level characteristics).
Various models were tested with different combinations of common support, caliper and replacement. Common support was imposed in all models and refers to the overlap in propensity scores of both treatment and comparison units. This was imposed to ensure a baseline level of comparability between matches. Various calipers were also tested (decreasing in intervals of 0.05 from 0.2 to 0.05). Calipers are used to restrict matching to pairs with similar enough propensity scores, theoretically reducing bias further - but where there are no potential matches within the defined caliper for a treatment pupil, the pupil would be dropped. PSM with replacement allows a single control unit to be matched to multiple treated units, improving covariate balance and reducing bias, but can reduce precision (higher variance) and requires adjustments for weighted outcomes because some controls are reused.
The preferred model reduced the overall average difference in means and medians between treated and control groups without reducing sample size and used one-to-one nearest neighbour matching with common support enforced, no caliper and no replacement. This meant that potential matches needed to be similar enough in terms of their propensity scores and could not be selected as a match for more than one treated pupil.
Table A.1 in the supporting tables outlines the pre- and post-matching means from which the suitability of the match can be observed. The differences in means between treated and control groups for all variables included in the models (described in the bullets above) were closer except for the ˜other national identity category, where the bias increased as a result of the match. The first two columns of the table outlined the average value for variables, e.g. gender in the first row for the unmatched sample of treatment and control groups, respectively. The next two columns present the same averages after matching has been completed.
The bias reduction column indicates the proportion of the difference between the treatment and control group means in the unmatched by which the sample has reduced. The matching reduced the differences in means between treatment and control pupils for almost all variables. Only the difference in means for the ˜Other national identity variable did not improve. The matching process was effective at reducing the differences in these characteristics with mean bias falling from 22 to 5.2 percent.
The t-tests presented in the table then indicate whether differences between the control and treatment groups are statistically significant. On this point, it can be observed that pre-matching there were statistically significant differences between treatment and control groups for all variables except the ˜Other British national identity category and ethnicity category. However, after matching there were no statistically significant differences among any of the variables.
The final column presents the ratio of a covariate's variance in the treated group to that in the control group for the unmatched and matched samples, respectively. Ideally, the variance of continuous variables (e.g. school roll size) would also be the same in the treatment and control group. The ratio of the variances in continuous variables is presented in the final two columns of table A.1 and values closer to one are preferable in the matched sample; however, values between 0.5 and 2 are typically accepted. The matching model can clearly be shown to have improved the balance in variance of these variables too with the ratio for the matched groups closer to one for all relevant (continuous) variables compared to the ratio for the unmatched groups.
Estimates of effect generated through Approaches A, B1 and B2 for the key outcomes described in the main report were obtained by comparing the point estimates for the various outcome measures of the treatment group (pupils who had attended 10 plus mentoring sessions, in S4 between 2014/15 and 2021/22, with care experienced flagged in the CLAS data) with the pupils in the matched control group. A slightly difference approach was required for Approaches C and D as detailed later in the relevant sections below.
The approach described above can account for the differences in the characteristics of pupils participating and not participating in MCR; however, there are significant unobservable factors that likely influence participation in the programme, making it difficult for the matching to produce a control group that is completely comparable to participants. Those who are most likely to have positive post-school outcomes are also the most likely to take part in the programme, and we can only partially control for this by matching on observable characteristics. In addition, it is not possible to account for past outcomes in this approach.
Results are presented in the main report and in the tables forming Appendix C.
Robustness checks
As mentioned above, various PSM models were tested before the preferred model was determined. However, to assess the extent to which overspecification may have been an issue for the preferred PSM model which included a wide range of variables at both pupil- and school-level, a robustness check was performed. Overspecification refers to the inclusion of too many, or irrelevant, covariates when modelling the probability of treatment. While often intended to reduce bias by capturing all possible confounding factors, overspecification can lead to several problems, including inefficient estimates, increased variance, and poor covariate balance.
The reduced model dropped all school-level variables and so only included:
- Gender
- Ethnicity
- Disability
- English language ability
- Refugee status
- Additional support needs and
- National identity
This model was again effective at reducing the differences in the means between the treatment and control groups and reduced mean bias from 18.6 percent to 3.8 percent.
Table A.2 in the supporting tables outlines the comparison of the effect sizes estimated for key outcomes through Approach A using the full PSM model and those estimated when using the reduced PSM model. The estimated treatment effects using the full PSM model are shown in column B whilst those for the reduced PSM model are shown in Column C. Overall, the effect sizes were very similar across all outcomes implying that the preferred full model is not sensitive to overspecification. For example, the estimated effect size for staying-on outcomes in the reduced model was the same for no further than S4 and to S5 whilst only marginally smaller in the reduced model for staying-on to S6 (25 percent relative to 27 percent).
Analytical Approaches B1 and B2: Care experienced pupils in participating vs non-participating schools
The second approach expanded the definition of the ˜treatment group to include all care experienced pupils in participating schools, rather than just programme participants. As mentioned in the main report, this moves the model away from estimating an Average Treatment Effect and towards an Intention-to-Treat estimator[36]. This approach removes possible biases driven by differences between pupils that do and do not take-up the programme in participating schools. The comparison of outcomes for Approach B1 was between all care experienced pupils in schools that took part in the programme with all care experienced pupils in schools that did not[37].
Estimates of effect for Approach B1 were generated by comparing the point estimates of all care experienced pupils (as defined by the CLAS data) in schools delivering MCR with all care experienced pupils in schools not delivering MCR.
An adaptation of Approach B1 was implemented (B2) in which all care experienced pupils in MCR schools were compared with all care experienced pupils in matched non-MCR schools. This B2 Approach involved using the results of the school-level matching, described in the discussion of Approach C in the main report and next section of the appendix, to restrict the pool of comparison schools from which comparison with care experienced pupils would be drawn. This approach is more robust than B1, as it can account for school-related factors that might influence effect sizes; however, it has less statistical power than B1 as the sample size of the control group is smaller.
Table A.3 in the supporting tables outlines the characteristics of schools offering and not offering MCR to illustrate the differences. Schools not offering MCR tended to have a lower proportion of pupils in receipt of free school meals, minority ethnic groups and from poorer backgrounds compared to those offering MCR, motivating the matching here.
The next section outlining Approach C details the variables included in the school-level matching and performance of the matching model.
This matching of schools was brought into Approach B to ensure the control group is formed of pupils from schools that are similar to schools that have adopted MCR Pathways. This helps to ensure that the sizes of the effects in Approach B2 are not driven by the types of school that implement the programme. This left 71 treated schools and 43 comparison schools in the analysis from which comparisons of outcomes for care experienced pupils were drawn.
The number of pupils in the comparison group consequently fell (from 13,097 to 2,581), resulting in this approach having less statistical power than the initial B1 Approach, but it remains more robust given differences between participating and non-participating schools in MCR as shown in Table D.2 (discussed further in relation to Approach C below).
Estimates of effects for Approach B2 were generated through replicating the approach adopted for B1 and comparing point estimates but limiting the comparison group to care experienced pupils at matched schools not offering MCR.
This approach is still based on individual-level comparisons and therefore still carries some of the weaknesses associated with Approach A given that we cannot control for unobserved variables driving selection. For instance, if schools participating in MCR also provide a higher level of support towards care experienced pupils success more generally compared to non-participating schools, this approach will also overestimate the programmes effects. We also do not have pre/post data on pupil outcomes.
Results are presented in the main report and in the tables forming Appendix C.
Analytical Approach C: Comparisons between participating and non-participating schools
The third approach takes advantage of longitudinal data at the school-level which allows for the analysis to control for time invariant differences between schools that could bias results. This involved reconfiguring the analysis from the pupil-level to the school-level. This involved analysis of aggregate outcomes in terms of pupil leaver destinations (proportion of care experienced pupils leaving for each destination), cohort attainment outcomes (proportion of care experienced pupils attaining qualifications and at what level) and cohort exclusion outcomes. The use of regression analysis to control for past observable outcomes at the school-level means that this method is more robust and less likely to be impacted by possible distortions driven by unobserved differences between pupils and schools. Schools participating in MCR were matched with control schools, again using propensity score matching.
In this approach, comparisons were made for school-level outcomes for care experienced pupils between schools that did and did not participate in MCR and share similar characteristics.
Propensity score matching
The matched control group was selected from non-participating schools sharing similar observable characteristics to participating schools. This was again done using propensity score matching (PSM) to remove differences in their characteristics that may bias simple comparisons of outcomes. This again involved a two-stage process:
A first-stage probit regression compared the characteristics of programme participating schools and other schools, to predict the probability of participation for each school in the sample. The models included the following characteristics:
- Local employment rate
- Local wages
- Baseline 3-month leaver outcomes in 2013 for care experienced pupils:
- Proportion leaving for Higher Education
- Proportion leaving for Further Education
- Proportion leaving for employment
- Proportion going into training
- Proportion going to voluntary work
- Proportion going to personal skills development
- Proportion going to activity agreements
- Proportion going to unemployment
- Number of pupils leaving school by stage:
- Number leaving at S4
- Number leaving at S5
- Number leaving at S6
- Pupil attainment - proportion of pupils attaining:
- Qualifications 3+ Nat-5
- Qualifications 5+ Nat-5
- Qualifications 3+ Nat-6
- Qualifications 5+ Nat-6
- Qualifications 1+ Nat-7
- Qualifications 1+ Nat-5 English
- Qualifications 1+ Nat-5 Maths
- Proportion of pupils never excluded
- The size of the school roll by year group
- Number of pupils with additional support needs and
- Number of pupils whose first language is not English
The resultant propensity scores were then used to match each participating school with one or more other non-participating schools where they share similar probabilities of participation in the programme (based on the observable school-, and area-level characteristics). A total of 51 MCR Pathways participating schools were matched with 31 non-MCR Pathways participating schools.
Various models were again tested with different combinations of common support, caliper and replacement. Common support was again imposed in all cases, but the imposition of calipers quickly reduced effective sample sizes. Matching with replacement performed better too, relative to matching for the pupil-level approaches, given the relatively small sample of schools available. The preferred model used one-to-one nearest neighbour matching with common support. This meant that potential matches needed to be similar enough in terms of their propensity scores, but schools could be selected as a match for more than one treated school[38]. Table A.4 in the supporting tables outlines the before and after means for the variables used in this matching. There were significant differences between means for the unmatched treatment and control groups, particularly in the number of pupils with additional support needs and pupils for whom English was not their first language. The matching process was able to reduce these differences to a point at which they were no longer statistically significant. After matching, the t-tests only indicated that the number of pupils attaining a Level-5 qualification in Maths was statistically higher in the treatment group. In terms of the variance of matched control and treatment schools, the match performed less well with ratios above 2 for the employment rate, proportion of pupils leaving for Higher Education, number of pupils getting 5+ Nat-5, number of pupils getting 1+ Nat-7 and number of pupils getting a Nat-5 in maths.
Overall, the matching process was somewhat effective at reducing the differences in these characteristics with mean bias falling from 26.6 to 11.2 per cent. The match was considered to have improved from a very poor level of comparability before matching to an adequate level given the lack of statistically significant differences in means across the key variables of interest. It should also be noted that the general nature of a valid difference-in-differences design controls for residual unobserved differences between groups, in addition to any observed differences.
Approach C analysis
Following matching, the matched sample was analysed using regression techniques to assess the impact of MCR Pathways on participating schools. The outcomes assessed through this analysis included:
- Leaver destinations at 3 months:
- Proportion leaving for Higher Education
- Proportion leaving for Further Education
- Proportion leaving for employment
- Proportion going into training
- Proportion going to voluntary work
- Proportion going to personal skills development
- Proportion going to activity agreements
- Proportion going to unemployment
- Leaver destinations at 9 months:
- Proportion leaving for Higher Education
- Proportion leaving for Further Education
- Proportion leaving for employment
- Proportion going into training
- Proportion going to voluntary work
- Proportion going to personal skills development
- Proportion going to activity agreements
- Proportion going to unemployment
- Pupil attainment - proportion of pupils attaining:
- Qualifications 3+ Nat-5
- Qualifications 5+ Nat-5
- Qualifications 3+ Nat-6
- Qualifications 5+ Nat-6
- Qualifications 1+ Nat-7
- Qualifications 1+ Nat-5 English
- Qualifications 1+ Nat-5 Maths
- Attendance outcomes:
- Attendance rate at S4 (%)
- Attendance rate at S5 (%)
- Attendance rate at S6 (%)
- Exclusion outcomes:
- Proportion of pupils with no exclusions
- Proportion of pupils with any exclusions
- Proportion of pupils with 1 to 5 days excluded
- Proportion of pupils with 6 to 10 days excluded
- Proportion of pupils with more than 10 days excluded
- Staying-on rates:
- Proportion of pupils staying on to S5
- Proportion of pupils staying on to S6
- Proportion of pupils achieving qualification in two or more exam diets
It was not possible using this approach to accurately or directly test the parallel trends assumption. However, school level trends in the leavers outcomes (leaving for employment, Further Education and unemployment), attendance outcomes, exclusion outcomes, staying-on rates and attainment of Level-5 qualifications were charted and analysed with a view to determining the extent to which this assumption holds. This assumption is key and follows that in the absence of treatment, the treatment and control groups would have followed the same, or parallel, trajectory over time. It ensures that any post-treatment difference is due to the intervention rather than pre-existing differences in trend. Analysis of pre-intervention trends in proportions in all outcomes tested provided support for the assumption that in the absence of treatment both the treatment and control schools would have followed similar trajectories.
These outcomes were assessed using fractional regression models (a fractional probit specification). These are regression techniques designed for continuous outcomes that are bounded between 0 and 1 such as percentages, e.g. percentage (%) leaving S4 for employment or percentage (%) achieving a certain qualification.
This model estimates the value of the dependent variable (a proportion/fraction) using an index function that determines the observed fraction. Quasi-maximum likelihood estimate is then used to fit the model. This method can be used to estimate the parameters of a model when the actual probability distribution of the data is unknown. This essentially fits a regression model to the data to estimate the effect of MCR participation on the outcomes of interest. The model implemented took the following general form:
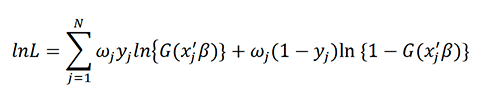
Where 𝑁 is the sample size, 𝑦𝑗 is the dependent variable (outcome) for school 𝑗, and 𝑤𝑗 denotes the optional weights. The probit link function 𝛷(𝑥𝑗′𝛽) was used for the functional form of 𝐺(𝑥𝑗′𝛽). Where x𝑗 are the covariates for school 𝑗 and 𝛷 is the standard normal cumulative density function.
The equation above gives the log-likelihood function that is maximized through Maximum Likelihood Estimation (MLE). This gives the marginal effect on the outcome for the group of schools participating in MCR relative to those not.
These were all implemented in STATA using ˜fracreg[39]. To account for the panel nature of the data, dummy variables were included in regression analysis for each school and each year (with one school excluded and one year excluded arbitrarily by the model) thus allowing for fixed effects at the school- and year-level to be included.
Other control variables in the model were:
- Proportion of pupils eligible for FSM
- Size of S4 pupil population
- Proportion of pupil population with additional support needs
- Proportion of pupil population from minority ethnic backgrounds
- Proportion of pupil population with additional language support needs
- Proportion of school catchment area within 6-fold urban-rural categories
The estimates of effect were produced using the margins command in STATA following estimation. This takes the coefficients produced in the model and backs out the point estimate of the outcome for the treated and control groups separately. These are converted into effect sizes by taking the difference of the estimate for the treated group minus the estimate for the control group. Converted results from the margin command are presented in the main report and in the tables forming Appendix C under Approach C.
Analytical Approach D - Staggered difference-in-differences
The final analytical approach employed exploited the sequential roll-out of the programme in which an increasing number of schools have participated in the programme over time. This approach can be considered more robust than the previous approaches as comparisons are only made between schools that ultimately participate in the programme which are more likely to share unobserved characteristics that influenced participation in MCR and/or the outcomes of interest.
To robustly estimate impacts with staggered treatment, an estimator was adopted. The intuition behind this estimator is to compute different treatment effects for each group treated at different dates. The group-specific treatment effects can be averaged to present an overall treatment effect. The expression for the group specific treatment effects is:
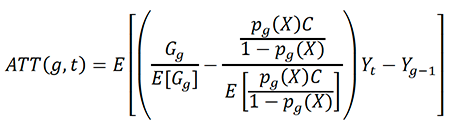
Where the weights, p, are propensity scores, G is a binary variable that is equal to one for schools first treated in year g, and C is a binary variable equal to one for schools in the potential counterfactual group, which did not participate in MCR. The equation above gives the Average Treatment Effect at time t for the group of schools participating in MCR at time g, and it is computed by comparing changes in outcomes for group g between periods g-1 to that of a control group of never treated schools (C).
This is typically implemented in STATA using the user-written command ˜csdid. However, the outcome variables take the form of percentages and so this method needs to be adapted to account of the fractional nature of the outcomes. As such, the ˜jwdid command was instead used. This allows for modelling of fractional regression within STATA and a staggered difference-in-differences specification.
The jwdid[40] package implements an extended two-way fixed effects (ETWFE) model as outlined by Wooldrige (2021)[41]. The baseline model estimated by jwdid is as follows:
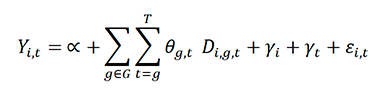
Here, 𝑌𝑖,𝑡 is the dependent variable, 𝐷𝑖,𝑔,𝑡 is a dummy that takes the value of 1 if the school is in the treatment group g, on period t and 0 otherwise. G is a set that indicates at what time treatment started for all observations, and T is the last period of the analysis.
Furthermore, and are sets of fixed effects for the school and time dimensions, respectively. In this setup, the coefficients represent the Average Treatment Effect that the treatment group g experiences at time t (ATT(g,t)). This command can be directly estimated with jwdid using the following syntax:
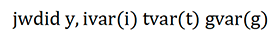
Where y is the dependent variable, ivar(i) is used to identify the individual school, tvar(t) identifies the time period, and gvar(g) identifies the treatment group. g would take the value of 0 if the school is never treated (within the window of the analysis) and the value of the year first treated if participating in MCR. Once a school participates in MCR it is assumed to remain for the rest of the analysis. No additional covariates were used in the modelling.
The coefficients produced by the model give direct estimates of the group and time specific Average Treatment Effects on the treated. Estimating aggregated ATTs for the overall data can be done suing the package post estimation command jwdid_estat. This uses the STATA margins command to identify Average Treatment Effects through the below process:
1. Predict the outcome of interest for all observations given the observed covariates and fixed effects.
2. Assume that all are zero, and predict the outcome of interest ( ) or predicted outcome under the counterfactual scenario of no treatment.
The predicted ATT is then given by:
This is zero for observations that were never treated, and non-zero for the treated-post treatment observations. The outcomes assessed using this approach are the same as those outlined in Approach C above.
This approach allows for the estimation of pretreatment effects using the ˜estat event command. This was used to examine the statistical significance of pretreatment effects which, if they were statistically significant, would indicate a violation of the parallel trends assumption. Examination of the t statistics of estimated pretreatment effects found none to be statistically significant. Joint F tests were conducted with the null hypothesis that all pretreatment effects were equal to zero. There were no instances where it was possible to reject this hypothesis providing support for the parallel trends assumption holding.
Results are presented in the main report and in the tables forming Appendix C.