Scottish Local Government Finance Statistics (SLGFS) 2020-21
Annual publication providing a comprehensive overview of financial activity of Scottish local authorities in 2020-21 based on authorities' audited accounts.
3. Capital Expenditure and Financing
Capital expenditure is expenditure that creates an asset, it includes the initial costs of acquisition and construction, and costs incurred subsequently to add to, replace part of, or service the asset. Subsequent costs arising from day-to-day services of an asset, known as repairs and maintenance, is not capital expenditure. Capital expenditure purchases or constructs the buildings and infrastructure necessary to provide services, such as schools, care homes, flood defences, roads, vehicles, plant and machinery. Due to the nature of capital expenditure, it can fluctuate substantially between years.
Capital expenditure also includes grants a local authority provides to a third party to fund capital expenditure of the third party; direct expenditure on a third parties’ assets; and loans to third parties to support capital investment of a third party.
Capital expenditure can be financed by one or more of the following:
- capital grants and contributions;
- borrowing or credit arrangements;
- contributions from capital or revenue reserve funds;
- capital receipts from the sale of assets.
Chapter 4.1 provides more information on local authorities’ capital reserve funds.
3.1 Capital Expenditure
In 2020-21, total capital expenditure was £2,604 million, a decrease of 31.4 per cent, or £1,190 million, from 2019-20.
Around £450 million of this decrease in capital expenditure relates to significant one-off sale and leaseback transactions for Culture and Related Services that were incurred by Glasgow City Council in 2019-20. A sale and leaseback transaction is where the owner of an asset sells it to a third party and then leases the same asset back from the new owner. The original owner, in this case Glasgow City Council, will then recognise the leased asset as capital expenditure incurred, whilst also recording income from the capital receipts generated by the sale of the asset.
It is likely that the remainder of the decrease reflects the impact of the Covid-19 pandemic on the construction industry during 2020-21, however it is not possible to explicitly quantify the impact of Covid-19 on capital expenditure.
Chart 3.1 shows the split of capital expenditure into these six categories in 2020-21. The majority of capital expenditure, £2,013 million or 77 per cent, related to new construction, conversions & enhancements to existing buildings.
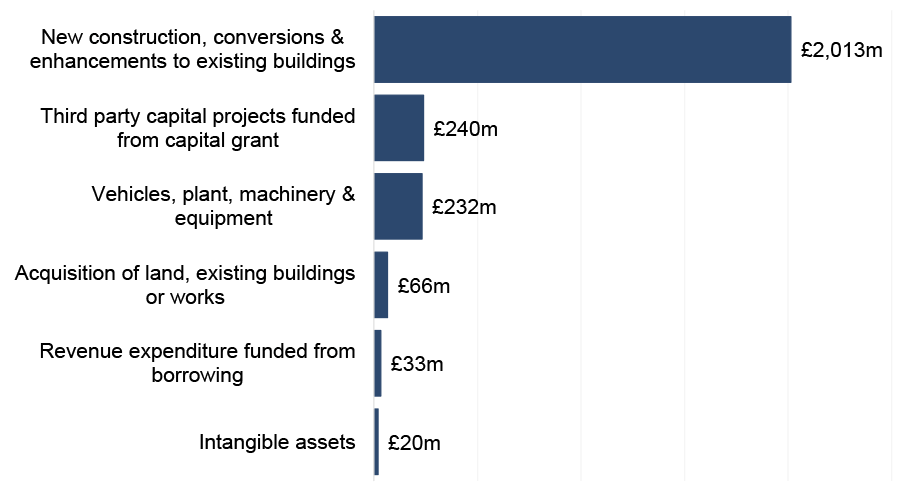
Please note, ‘Third party capital projects funded from capital grant’ and ‘Revenue expenditure funded from borrowing’ are also included in authorities’ revenue figures.
Source: LFR CR
Table 3.1 shows a breakdown of capital expenditure between 2016-17 and 2020-21. New construction, conversions and enhancements to existing building has consistently accounted for the majority of capital expenditure over this period. However, this type of capital expenditure has decreased by 23.0 per cent, or £603 million, between 2019-20 and 2020-21, likely reflecting the impacts of the Covid-19 pandemic on the construction industry.
Capital expenditure on acquisition of land, existing buildings or works has also seen a significant decrease between 2019-20 and 2020-21, however the majority of this decrease can be attributed to one-off sale and leaseback transactions by Glasgow City Council in 2019-20.
| Expenditure Type | 2016-17 | 2017-18 | 2018-19 | 2019-20 | 2019-20 |
|---|---|---|---|---|---|
Acquisition of land, existing buildings or works |
233 | 363 | 169 | 633 | 66 |
| New construction, conversions & enhancements to existing buildings | 2,358 | 2,255 | 2,317 | 2,616 | 2,013 |
Vehicles, plant, machinery & equipment |
193 | 185 | 225 | 228 | 232 |
| Intangible assets | 10 | 5 | 5 | 17 | 20 |
| Revenue expenditure funded from capital grant and borrowing | 168 | 177 | 262 | 301 | 273 |
| Total Capital Expenditure | 2,962 | 2,984 | 2,977 | 3,794 | 2,604 |
Please note, ‘Revenue expenditure funded from capital grant and borrowing’ is also included in authorities’ revenue figures.
Source: LFR CR for 2019-20 and 2020-21, CR Final for all other years
3.1.1 Capital Expenditure by Service
Chart 3.2 shows capital expenditure in 2020-21 by service. HRA had the largest share of expenditure at £684 million, followed by Education with £606 million.
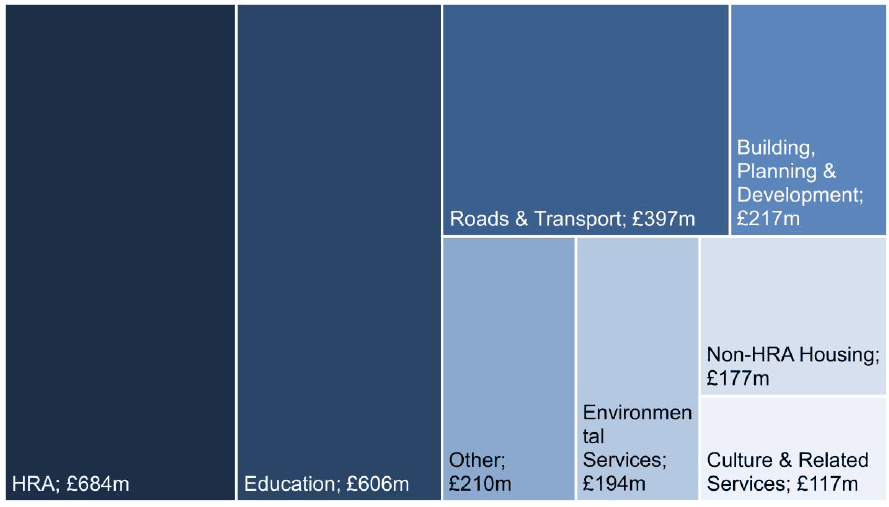
Please note, ‘Other’ includes Social Work, Central Services and Trading Services.
Source: LFR CR
Chart 3.3 shows capital expenditure for 2016-17 to 2020-21 for the six services with the highest capital expenditure in 2020-21. Capital expenditure has decreased for all six services between 2019-20 and 2020-21, reflecting the overall decrease in capital expenditure in 2020-21.
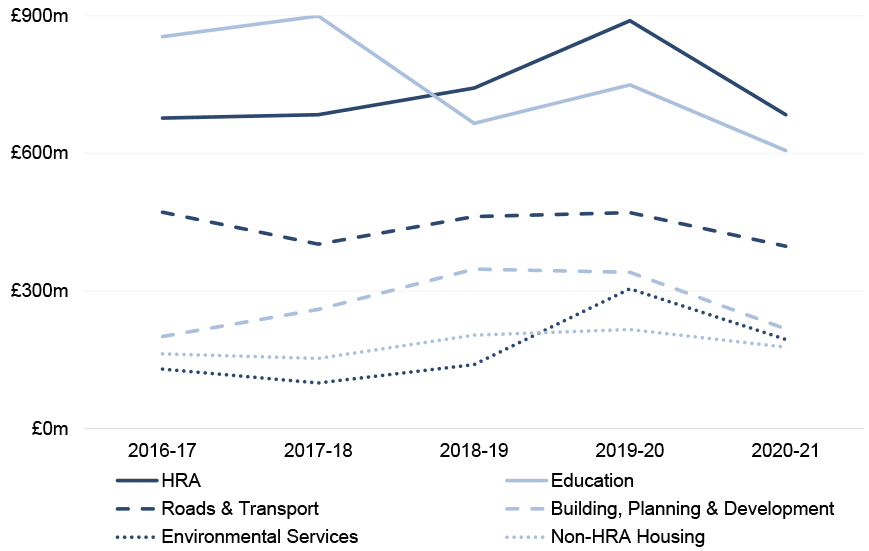
This chart excludes expenditure for Culture & Related Services; Social Work; Trading Services; and Other, including Central Services which, combined, accounted for less than 15% of total capital expenditure in 2020-21.
Source: LFR CR for 2019-20 and 2020-21, CR Final for all other years
3.1.2 General Fund Capital Expenditure by Council
In any given year, capital expenditure per person varies substantially between local authority areas. This will in part reflect the different priorities of local authorities, however it also reflects differences in the timing of capital projects. Expenditure on capital projects can be highly variable as some projects can be high-value and infrequent, and expenditure per head in local authority areas will move, possibly substantially, from year to year as projects begin or wind down.
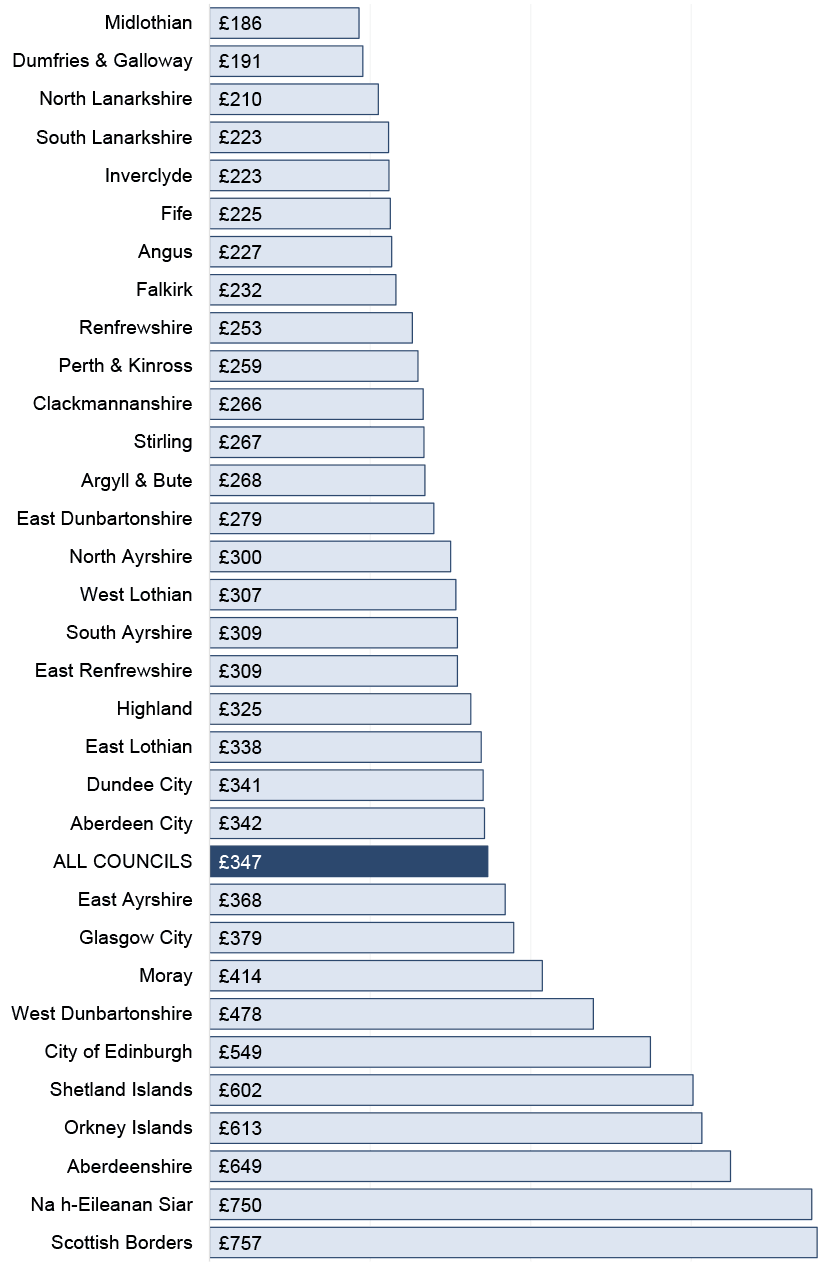
Chart 3.4 shows capital expenditure on General Fund services per person by council. In 2020-21, the average capital expenditure per person across all councils was £347, a decrease from £524 per person in 2019-20. Spend per person ranged from £186 per person in Midlothian to £757 per person in Scottish Borders.
Source: LFR CR, Mid-Year Population Estimates
3.2 Capital Financing
Chart 3.5 shows how local authorities financed their capital expenditure in 2020-21. The two main sources of financing were grants & contributions, £1,322 million, and borrowing from the Loans Fund, £834 million, which together accounted for over four-fifths (83 per cent) of all capital financing in 2020-21.
Capital grants and contributions are provided to local authorities to fund capital investment. This includes grants and contributions received from the Scottish and UK Governments; other government agencies and Non-Departmental Public Bodies (NDPBs); other local authorities; and private developers. The Scottish Government provides two types of capital grant funding to local authorities – a General Capital Grant (GCG) and a number of specific capital grants. The General Capital Grant accounted for just over a third (36 per cent) of grants and contributions in 2020-21.
More information on borrowing is provided in Chapter 3.2.1 and more information on the Loans Fund is provided in Chapter 5.1.1.
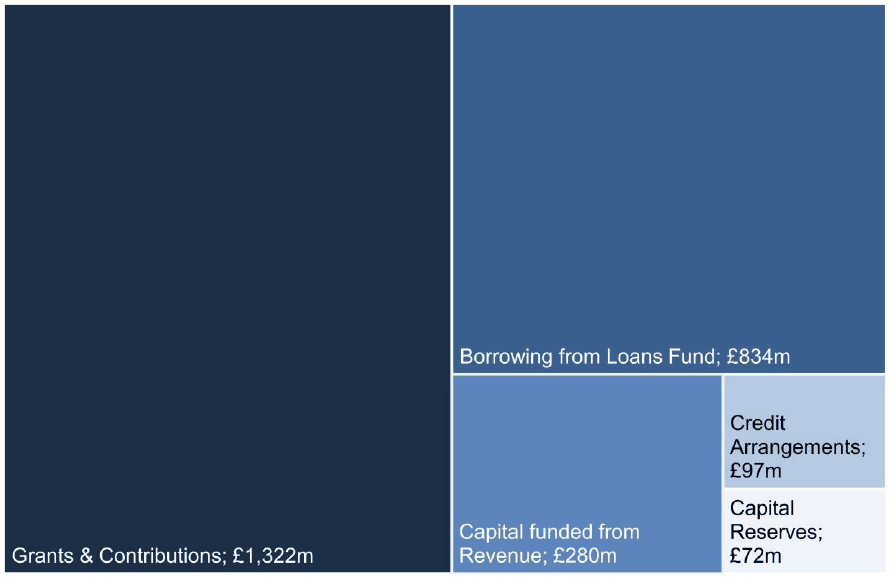
Please note that ‘Grants & Contributions’ and ‘Borrowing from Loans Fund’ include amounts used to fund grant to third party capital projects which will also be included in the revenue figures.
Source: LFR CR
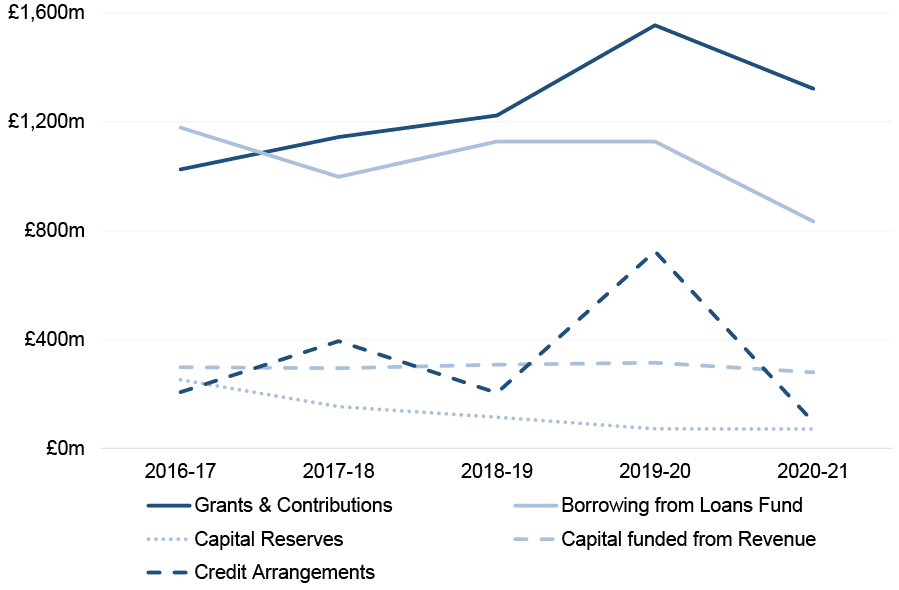
Chart 3.6 shows capital financing by type from 2016-17 to 2020-21. All types of financing have decreased between 2019-20 and 2020-21, reflecting the overall decrease in capital expenditure incurred in 2020-21. Grants & contributions and borrowing continue to be the main sources of capital financing.
Changes in grants & contributions over this period have largely been driven by changes in capital grants from the Scottish Government. In particular, the 2016-17 figure excludes £150 million capital funding payments that were reallocated and included in the 2019-20 capital settlement, as agreed between the Scottish Government and the Convention of Scottish Local Authorities (COSLA).
The fluctuations in borrowing reflect the nature of capital and can be influenced by the type of expenditure being undertaken in each year. In particular, the decrease in borrowing between 2019-20 and 2020-21 will reflect the overall reduction in capital expenditure incurred in 2020-21 due to the impacts of the Covid-19 pandemic.
Financing from credit arrangements was notably high in 2019-20 compared to other years, this was due to significant one-off sale and leaseback transactions for Culture and Related Services by Glasgow City Council. However, financing from credit arrangements in 2020-21 is at the lowest level in the five year period shown.
Please note that ‘Grants & Contributions’ and ‘Borrowing from Loans Fund’ include amounts used to fund grants to third party capital projects which will also be included in the revenue figures.
Source: LFR CR for 2019-20 and 2020-21, CR Final for all other years
3.2.1 Borrowing and Credit Arrangements
Local authorities can borrow to fund capital expenditure, either through the borrowing of money or by way of a credit arrangement, such as a lease. The cost of repaying debt, including the interest costs, is expenditure to the revenue accounts. The costs of servicing debt in 2020-21 are provided in Table 2.5, which shows the cost of repayments and interest payable.
The Local Government (Scotland) Act 1973 provides councils with a general power to borrow money. Other local authorities’ powers are set out in legislation specific to that authority. The Local Authority (Capital Finance and Accounting) (Scotland) Regulations 2016 sets out the purposes for which a local authority may borrow.
Table 3.2 provides a summary of borrowing and credit arrangements in 2020-21. Local authorities financed £834 million of capital expenditure from borrowing in 2020-21, this was a decrease of 26.1 per cent, £294 million, compared to the value of borrowing to finance capital expenditure in 2019-20. As discussed earlier in this chapter, this decrease reflects the overall reduction in capital expenditure incurred in 2020-21 due to the impacts of the Covid-19 pandemic.
In 2020-21, local authorities also entered into credit arrangements, recognising debt of £97 million, a decrease of 86.6 per cent, or £627 million, from 2019-20. The majority of this decrease can be attributed to the one-off sale and leaseback transactions recorded by Glasgow City Council in 2019-20, as noted in Chapter 3.1.
| Category | General Fund | HRA | Total |
|---|---|---|---|
| Advances for Capital Expenditure | 558 | 256 | 815 |
| Advances for Consented Borrowing | 19 | - | 19 |
| Total Loans Fund Borrowing | 578 | 256 | 834 |
| Credit Arrangements | 97 | - | 97 |
| Total Borrowing and Credit Arrangements | 674 | 256 | 931 |
Please note that ‘Advances for Capital Expenditure’ includes borrowing from the Loans Fund used to fund grants to third party capital projects which will also be included in the revenue figures.
Source: LFR CR
Trends for borrowing from the Loans Fund and credit arrangements between 2016-17 and 2020-21 are shown in Chart 3.6 and discussed in Chapter 3.2.
3.3 Capital Receipts
Capital receipts is the term used to recognise income from the sale or disposal of an asset, such as land or council housing. As shown in Table 3.3, local authorities generated £93 million in capital receipts in 2020-21. This is a decrease of £448 million compared to 2019-20, however this is due to one-off sale and leaseback transactions recorded by Glasgow City Council in 2019-20, as noted in Chapter 3.1.
| Category | Capital receipts raised in year |
|---|---|
| General Fund | 68 |
| HRA | 25 |
| Total | 93 |
Source: LFR CR
Capital receipts may only be used to fund capital expenditure or for a purpose specified by statute, or statutory guidance. Local authorities can also hold capital receipts in a capital reserve for future use. This means the value of capital receipts raised in year may not equal the amount used in year. Table 3.4 sets out how capital receipts were used in 2020-21.
| Use | General Fund | HRA | Total |
|---|---|---|---|
| Fund capital expenditure | 20 | 25 | 45 |
| Repay debt | 43 | 2 | 45 |
| Fund equal pay settlement | - | - | - |
| Fund transformation projects | 4 | - | 4 |
| Fund premiums incurred on refinancing | - | - | - |
| Fund deferred premiums | - | - | - |
| Fund impact of Covid-19 | - | - | - |
| Total capital receipts used in year | 66 | 28 | 94 |
Source: LFR CR
Local authorities used a total of £94 million capital receipts in 2020-21. The majority of these were used to fund capital expenditure and repayment of debt, which each accounted for 48 per cent of capital receipts used.
Contact
Email: lgfstats@gov.scot