Scottish Local Government Finance Statistics (SLGFS) 2020-21
Annual publication providing a comprehensive overview of financial activity of Scottish local authorities in 2020-21 based on authorities' audited accounts.
6. Pensions
Expenditure and income from local authority pension funds are entirely separate from the expenditure and income of the authorities’ themselves. In accordance with Regulations 9 and 65 of the Local Government Pension Scheme (Scotland) Regulations 2014, expenditure on pensions, lump sums and the costs of managing the pension are paid from the Pension Fund. Income from employer and employee contributions is paid into this fund, which then generates investment income.
Expenditure and income figures should not be used to gauge the health of a pension fund, as the ratio of expenditure to income will depend on a number of factors, including age of the fund and whether it is open or closed to new members. The relative financial health of the pension scheme is gauged through the three-yearly actuarial valuations carried out on each of the funds.
Table 6.1 shows the movement in net assets of the local government pension funds in 2020-21. The opening net assets of the pension funds at 1 April 2020 was £46,067 million. This increased by 25.2 per cent, or £11,586 million, over the year such that the closing net assets at 31 March 2021 was £57,654 million. The majority of this increase is driven by the total net return on investment in year of £11,977 million – this is discussed in more detail in Chapter 6.2.
| Movement | 2020-21 |
|---|---|
| Opening net assets of the fund at 1 April | 46,067 |
| Add: Contributions receivable | 1,480 |
| Less: Benefits payable | 1,486 |
| Less: Payments to and on account of leavers | 8 |
| Net additions (+) / withdrawals (-) from dealings with members | -15 |
| Less: Management expenses | 353 |
| Add: Net return on investments | 11,977 |
| Less: Revaluation of insurance buy-in contract | 22 |
| Net increase (+) / decrease (-) in the fund in year | 11,586 |
| Closing net assets of the fund at 31 March | 57,654 |
Source: LFR 24
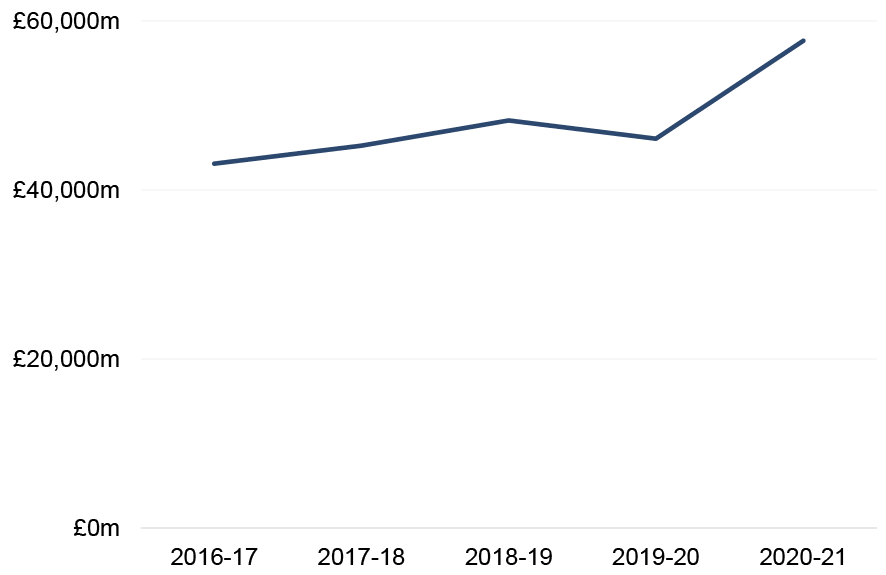
Chart 6.1 shows the closing net asset position of local government pension funds from 2016-17 to 2020-21. As already shown in Table 6.1, the closing net asset position in 2020-21 has increased compared to 2019-20. The only decrease in net assets for the period shown is between 2018-19 and 2019-20 – this was due to the decrease in the market value of pension investments across all local authorities as a result of the impact of the Covid-19 pandemic on the financial market at the start of 2020. Over the five year period, closing net assets have increased by 33.7 per cent, or £14,537 million, from £43,117 million in 2016-17 to £57,654 million in 2020-21.
Source: LFR 24
6.1 Members, contributions and benefits
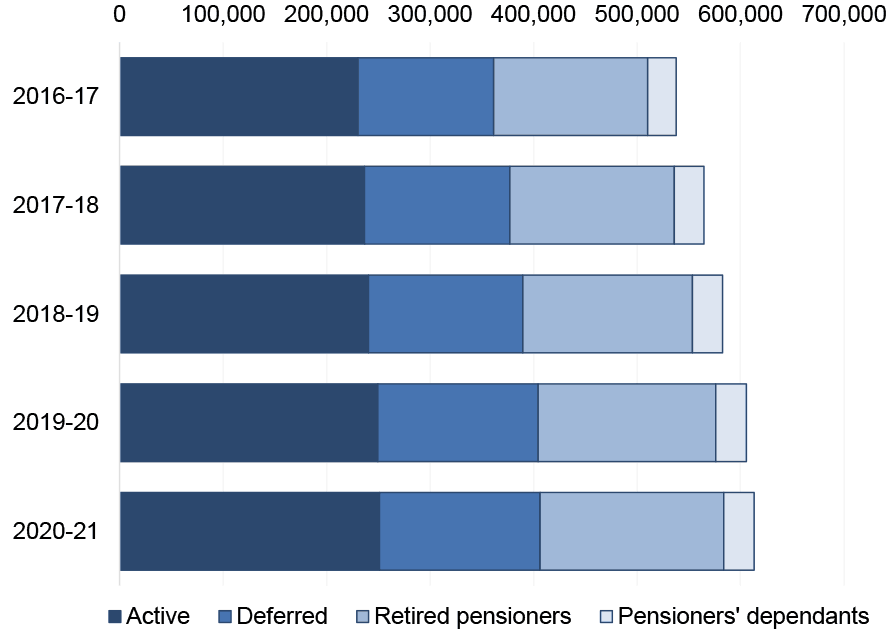
Chart 6.2 shows the number of members enrolled in local government pension schemes between 2016-17 and 2020-21 by type of member. At 31 March 2021, there were a total of 613,195 members enrolled in these pension schemes, an increase of 14.0 per cent, or 75,367 members, from 2016-17.
Source: LFR 24
The split of types of member has remained broadly consistent across the five year period shown. Active members, that is members who are actively contributing to the pension fund, have been the largest category of members across all five years, accounting for just over two-fifths (41.0 per cent) of the total membership in 2020-21. Deferred pensioners, that is members who choose to continue to work beyond retirement age, made up around a quarter (25.3 per cent) of the total in 2020-21. Retired pensioners have been the second largest group across all five years, accounting for 28.9 per cent of the total in 2020-21. Pensioners’ dependants are the smallest group and make up only 4.8 per cent.
6.1.1 Contributions from Members
Contributions from employees and employers represent payments for pensionable service accrued during the year which will be paid out as part of an overall pension at a future date. These contributions can be thought of as income to the pension fund and are dependent on the number of contributing employees, both full time and part time.
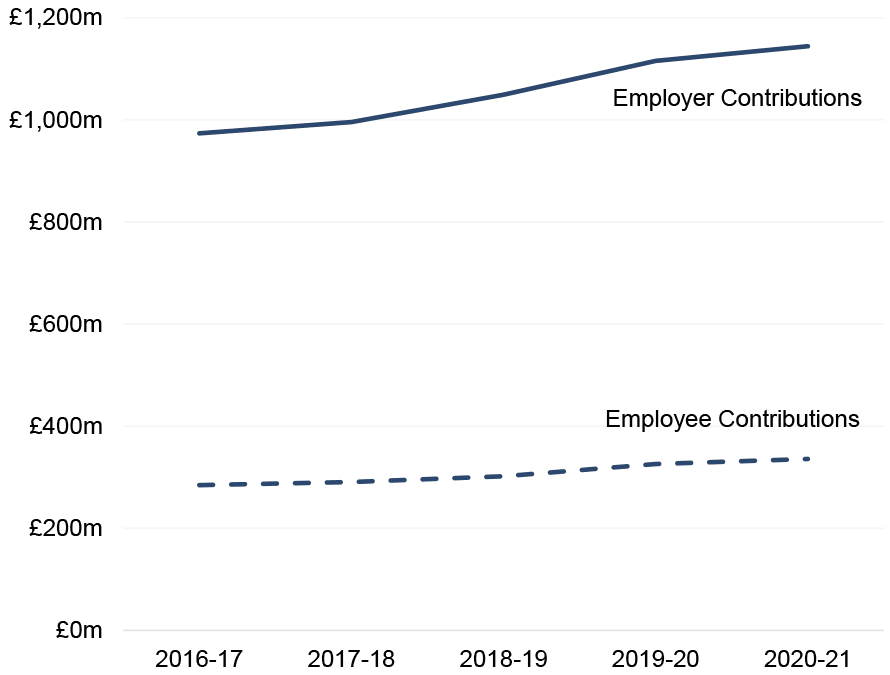
Contributions from employees are fixed at a set percentage of pay, depending on level of salary. Contribution rates from employers are variable and are reviewed on a triennial basis, with actuaries determining the contribution rates for the following three years. This means contributions from employees and employers tend to remain stable over time, as shown in Chart 6.3.
Please note that contributions include those from other employing authorities.
Source: LFR 24
In 2020-21, total contributions provided £1,480 million of income, an increase of 2.6 per cent, or £38 million, from 2019-20. Just over three-quarters of total contributions (77.3 per cent or £1,144 million) came from employers, with the remainder coming from employees. This proportional split of total contributions has been stable over this five year period.
6.1.2 Benefits Paid to Members
Benefits paid to members include pension payments to retirees or dependents, as well as lump sum payments made to members on retirement or upon death. Benefits paid may also include payments made for injuries, however these figures are often zero or of small value.
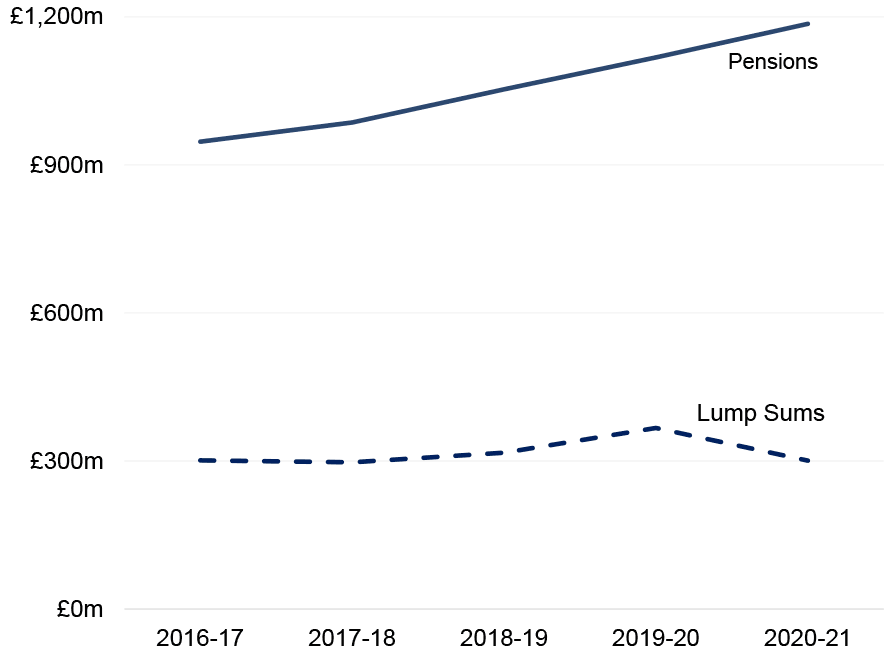
Chart 6.4 shows the pensions and lump sum payments made to members over the last five years. Total paid out in 2020-21 was £1,185 million. This has increased year on year since 2016-17. Total lump sums paid out in 2020-21 was £301 million; these payments increased year on year to a peak of £367 million in 2019-20 then decreased back to the same figure as in 2016-17.
Source: LFR 24
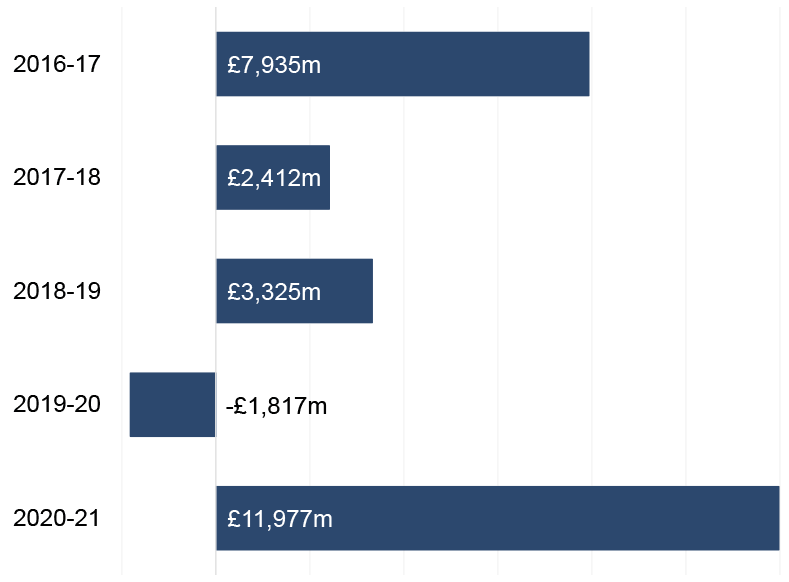
6.2 Net Return on Investments
Pension funds invest in financial markets and other assets. These investments are generally managed separately to the administration of contributions and benefits of the scheme. A pension fund’s net return on investment reflects income and expenditure incurred directly relating to the investment, as well as any changes in the market value of the investment, in year. This figure does not include expenses paid to manage the investment. Therefore, the net return on investment is volatile and is directly influenced by investment conditions; for example, changes in financial markets.
Chart 6.5 shows the net return on investment from 2016-17 to 2020-21. In 2020-21, net return on investment was £11,977 million, an increase of £13,819 million from 2019-20. The negative net return in 2019-20 reflected the impact of the Covid-19 pandemic on financial markets at the start of 2020 and the corresponding decrease in pension investments across all local authorities. The variation in net return on investment between years reflects the volatility of this figure.
Source: LFR 24
Contact
Email: lgfstats@gov.scot