Scottish Housing Market Review – Q4 2021
Scottish housing market bulletins collating a range of statistics on house prices, housing market activity, cost and availability of finance and repossessions.
Housing Supply: Starts and Completions
New build completions
The most recent published Scottish Government figures for new build completions cover the year to end December 2020, in which there were 14,834 completions across all sectors in Scotland, a decrease of 34.6% (7,839 homes) on the previous year, with activity levels being affected by Covid-19 lockdown measures from March to June 2020.
Private New Build Sales
While more recent data on private completions is not available due to delays as a result of Covid-19-related data supply issues, the UK HPI does include private new build sales, which provide a good indication of latest trends. As Chart 6.1 shows, while private new build sales decreased during the restrictions on non-essential construction activity in Q2 2020, falling by 85% annually in May 2020, there has been a strong recovery since then, with an increase in private new build sales on a rolling 1 year basis to August 2021 of 19.4%. When we compare the one year period to August 2021 against the one year period to August 2019 (i.e. prior to Covid-19), private new build sales fell by only 3.6%, indicating a return to more normal market conditions.
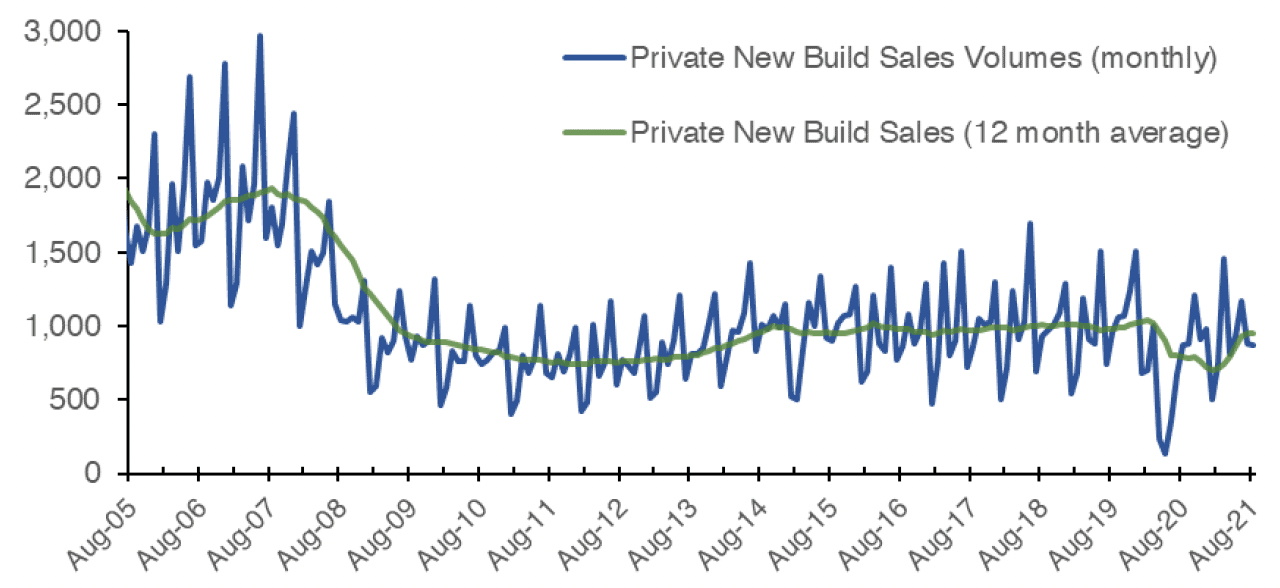
Source: UK HPI (Scotland)
Chart 6.2 provides the growth in private new build sales by region over the one year period to Q2 2021, relative to the year prior. Private new build sales increased by an annual 15.2% for Scotland as a whole. Analysing the data by region, it can be seen that private new build sales increased in all regions shown, with the largest increase in private new build sales in Aberdeen/shire and Moray (35.2%) and the smallest increase in private new build sales in the Forth Valley of 8.1%. (Source: UK HPI).
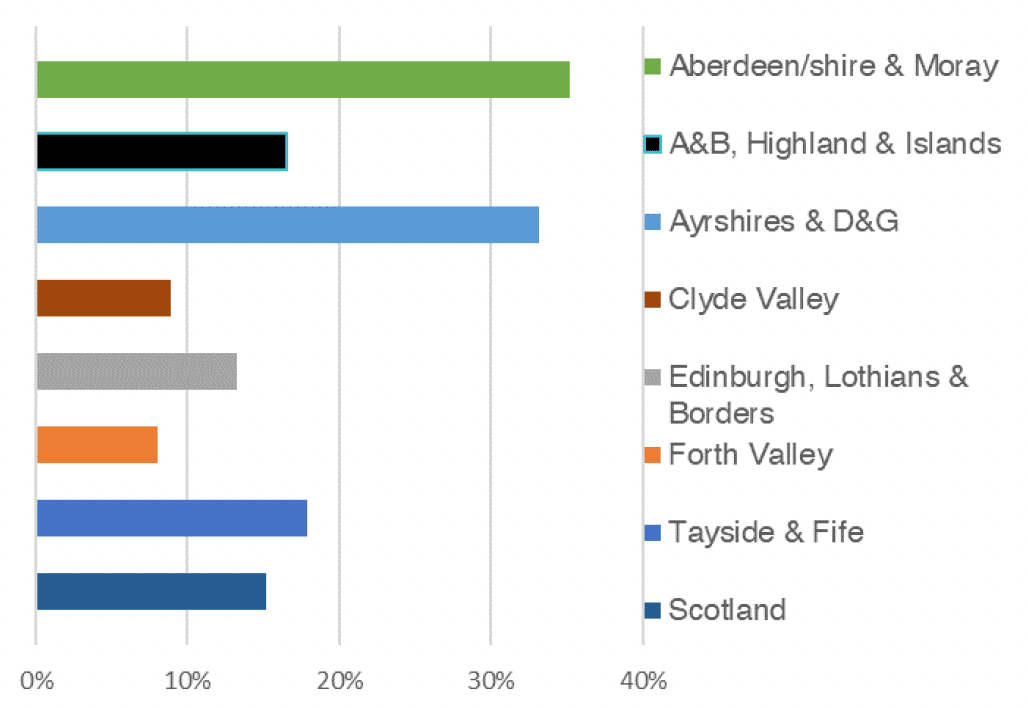
Source: UK HPI (Scotland)
Affordable Housing Supply Programme
Chart 6.3 shows that the supply of affordable housing has increased since the restrictions on non-essential construction activity were eased in Q3 2020, although supply remains below the Q1 2020 level. 2,094 affordable housing completions were recorded in Q3 2021, an increase of 917 on Q3 2020. In addition, the number of homes delivered in the 12 months to Q3 2021 increased by 20.0% (1,464 homes) to 8,792 completions, compared with the previous year. Over the last year, approvals have dropped by 23.4% to 8,581 whilst starts decreased by 3.4% to 10,023. (Source: SG).
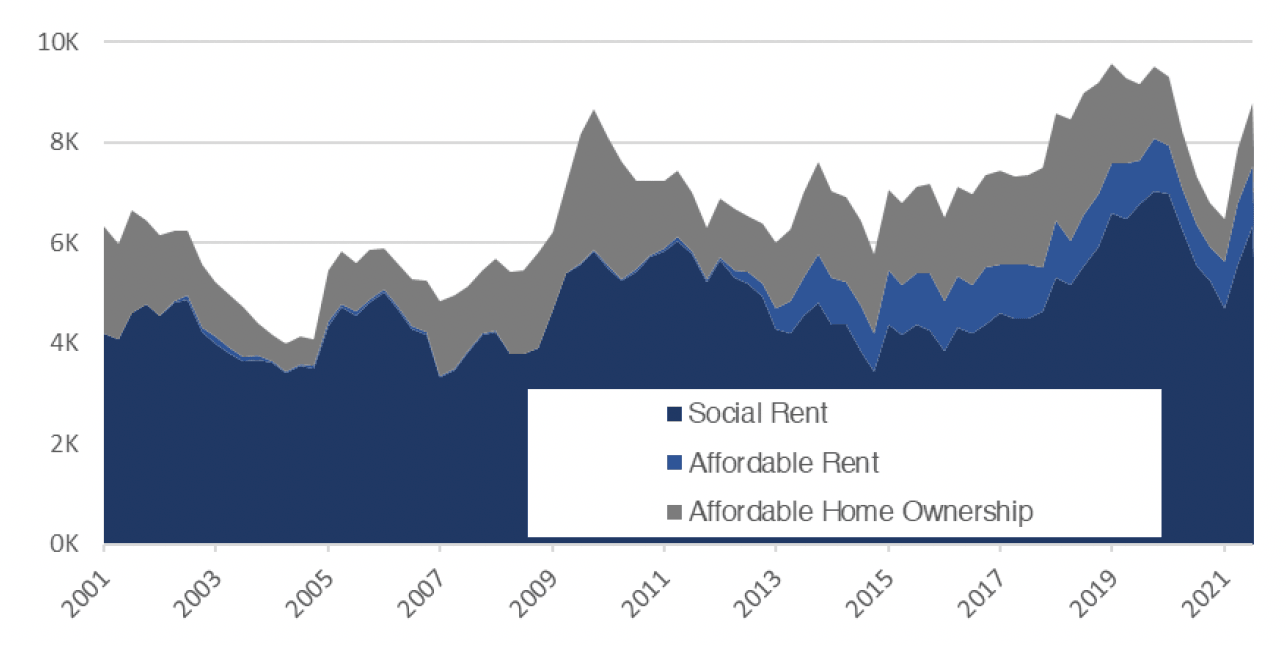
Source: Scottish Government
Contact
Email: William.Ellison@gov.scot