Scottish Housing Market Review – Q4 2021
Scottish housing market bulletins collating a range of statistics on house prices, housing market activity, cost and availability of finance and repossessions.
Lending To Homebuyers: Interest Rates
Mortgage Interest Rates
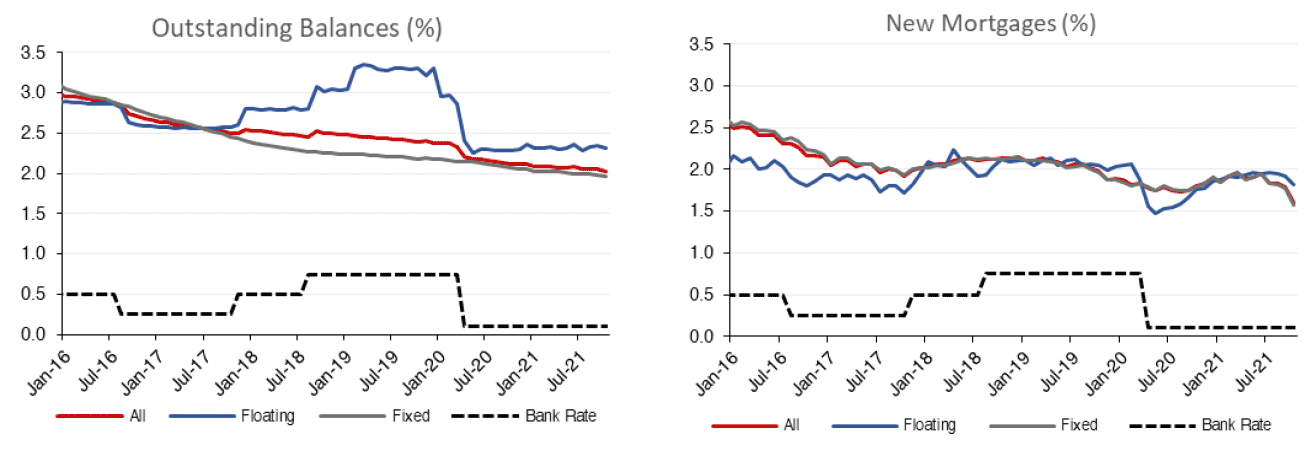
Charts 4.5 & 4.6 show the effective (or average) interest rate on outstanding mortgage balances and new mortgage advances.
In March 2020, Bank Rate was cut by a total of 65 basis points, leaving it at 0.1%. The reduction in Bank Rate fed through to outstanding variable rate mortgages, with the average interest rate falling from 2.97% in February 2020 to 2.26% in May, before stabilising, with the level at 2.32% in October 2021. The average interest rate on new variable rate mortgages fell from 2.06% in February 2020 to 1.48% in May 2020, although it subsequently increased to 1.82% in October 2021. The average fixed rate on new mortgages has been relatively stable throughout the period of Covid-19 but fell sharply over the month, from 1.78% in September 2021 to 1.58% in October 2021. Note: the latest data on average mortgage rates is for October 2021, and thus does not cover the period since the Bank of England increased the base rate by 15 basis points to 0.25% on 16 December 2021. (Source: BoE)
Source: Bank of England
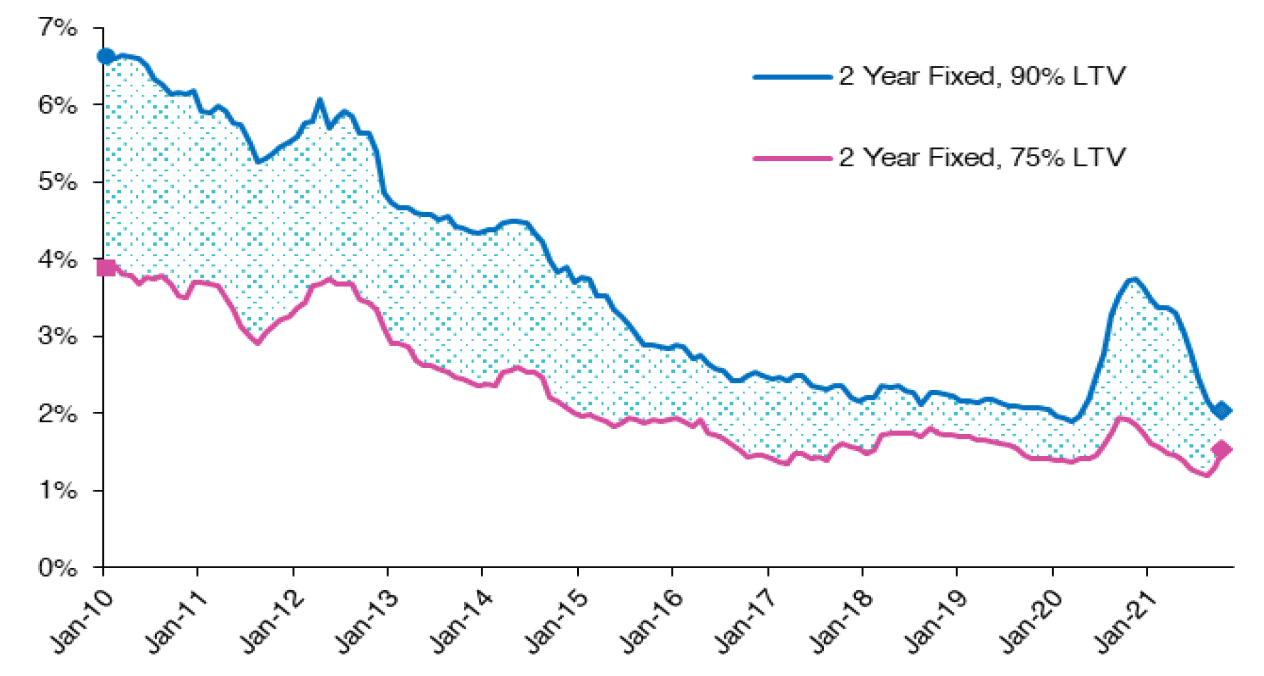
The spread between the average advertised rate on 2 year fixed 90% and 75% LTV mortgages increased during the pandemic from 54 basis points in May 2020 to 189 basis points in December 2020, as shown in Chart 4.7. However, since April 2021 the spread has fallen from 189 basis points to 50 basis points in October 2021, potentially reflecting a return to normal market conditions. (Source: BoE)
Source: Bank of England
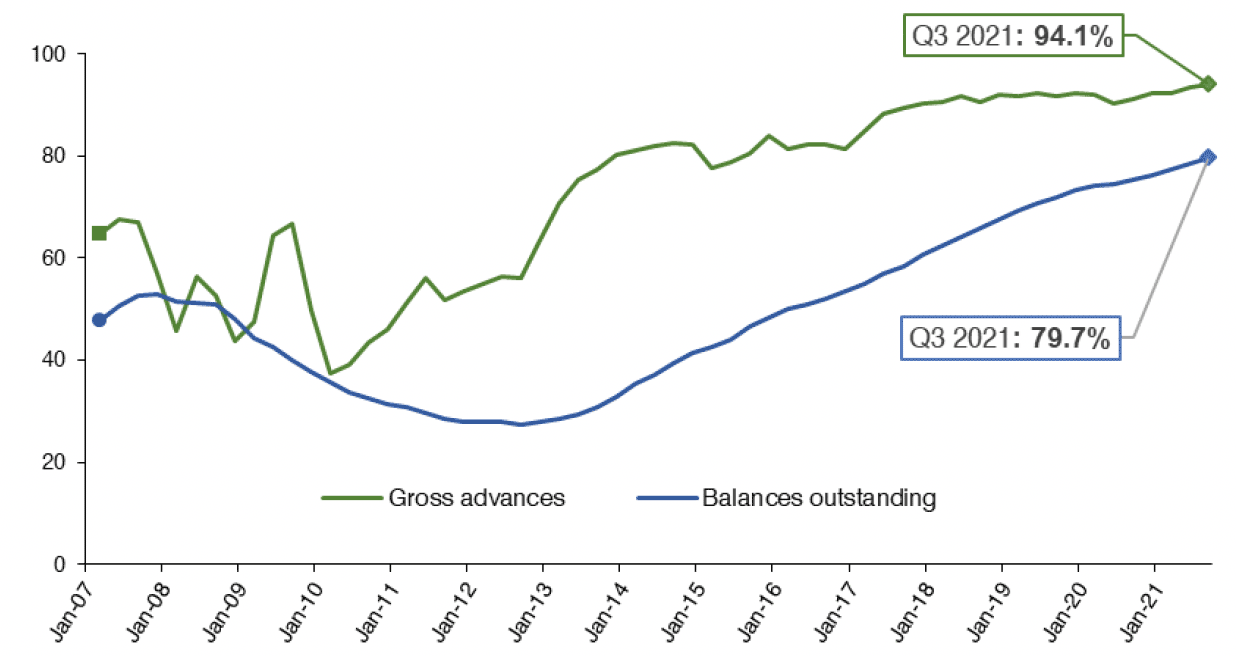
Chart 4.8 shows that the majority of new mortgages (94.1%), as well as most outstanding mortgages (79.7%), are on fixed rates, as of Q3 2021. (Source: FCA)
Source: FCA
Contact
Email: William.Ellison@gov.scot