Scottish Housing Market Review – Q4 2021
Scottish housing market bulletins collating a range of statistics on house prices, housing market activity, cost and availability of finance and repossessions.
Rental Prices
Private Housing Rental Prices
Private housing rental prices in Scotland increased by 2.0% annually to November 2021. This continues a period of relative stability in nominal private rental price growth, although annual price growth has increased since late 2020. Since June 2017, rental price growth has ranged between 0% and 2%, with an average of 0.7%. In real terms (adjusting for inflation, using CPI), the annual change in November 2021 was -3.0%. Chart 3.1 shows that the annual change in real private housing rental prices rose towards positive territory as CPI inflation fell due to the impact of Covid-19, but it has returned to negative territory with the recent increase in CPI inflation, which reached 5.1% in November 2021. The heightened level of CPI inflation can be partly explained by a base effect, with relatively low prices for some items during lockdowns for COVID-19 influencing current inflation rates, coupled with increases in energy prices across the global economy as lockdowns were lifted, leading to significant increases in petrol, gas and electricity prices faced by households.
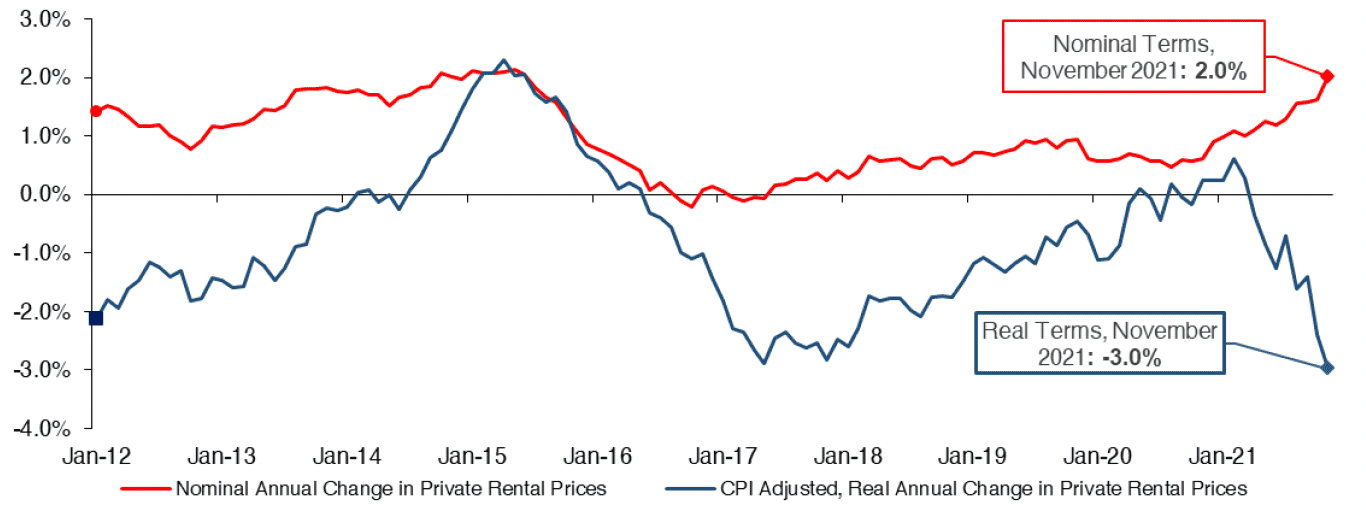
Source: ONS Rental Price Index, Consumer Price Inflation (CPI)
Scottish Government statistics show that from 2010 to 2021 (years to end September), four broad market rental areas ("BRMAs") have seen average rents for 2 bedroom properties increase, on an average annualised basis, above the average level of CPI inflation (2.0%): these are the Lothian (3.2%), Greater Glasgow (3.2%), Fife (2.6%) and the Forth Valley (2.4%) BRMAs. Therefore, the annualised average rate of change was equal to or below that of inflation (CPI) in 14/18 BRMAs, with the lowest annualised rate of change seen in Aberdeen and Shire of just 0.1%.
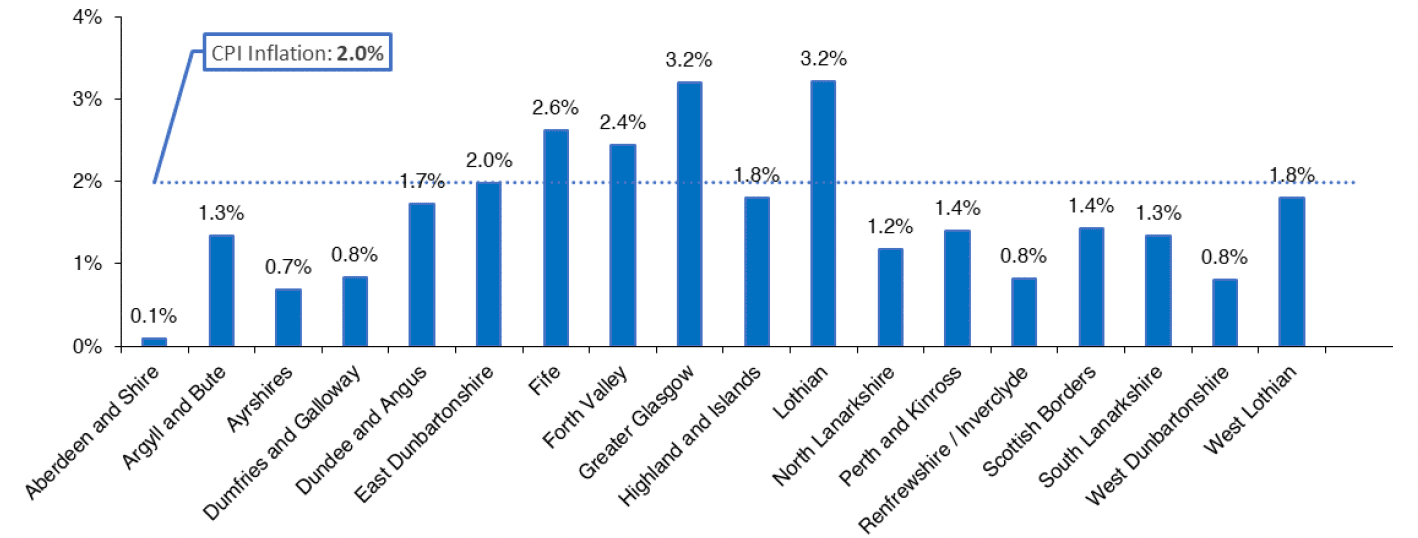
Source: SG/ONS CPI
* Note: Scottish Government statistics are based almost entirely on advertised rents at point of new let, and thus will tend to be higher than the ONS data which makes an allowance for rent changes in existing lets. In addition, chart 3.2 looks solely at 2 bedroom properties, whilst 3.1 looks at the entire market
Contact
Email: William.Ellison@gov.scot