Scottish Housing Market Review – Q4 2021
Scottish housing market bulletins collating a range of statistics on house prices, housing market activity, cost and availability of finance and repossessions.
Lending To Homebuyers: Mortgage Approvals & LTVs
New Mortgage Advances
Chart 4.1 plots the monthly number of new mortgages advanced to first-time buyers and home movers in Scotland. There were 10,290 new mortgages advanced to first-time buyers in Scotland in Q3 2021, an annual increase of 42.3% (+3,060). Meanwhile, there were 9,950 new mortgages advanced to home movers in Scotland in Q3 2021, an annual increase of 45.0% (+3,090). Whilst the annual increases for first-time buyers and home movers are large, this can be explained a low base in Q3 2020 (see discussion in Sales section). Relative to the 4 year average for Q3 (2016 – 2019), new mortgages advanced to first-time buyers were up 17.3%, whilst for home movers they increased by 11.0%. For the one year period to Q3 2021 relative to the year prior, the increase in the number of new mortgages advanced was higher for first-time-buyers (56.5%) than for home movers (54.1%) (Source: UK Finance).
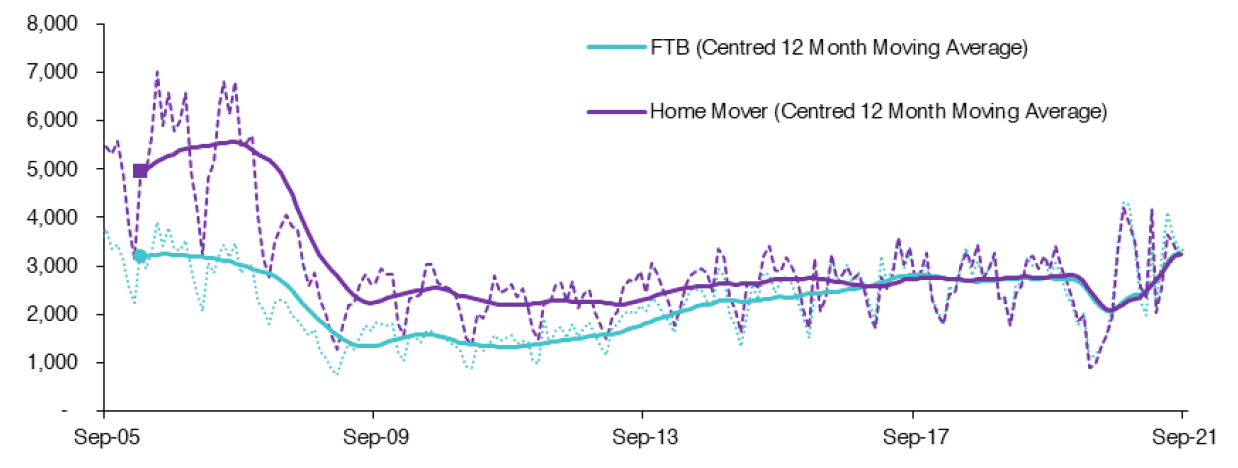
Source: UK Finance
Mortgage Approvals
Chart 4.2 plots the monthly number of mortgage approvals across the UK for house purchase (Source: BoE). Mortgage approvals for house purchase are the firm offers of lenders to advance credit fully secured on dwellings by a first charge mortgage. This data is a leading indicator of mortgage sales as it reflects activity early in the buying process.
Mortgage approvals for house purchase across the UK rebounded strongly in the second half of 2020, with mortgage approvals increasing from 9,922 in May 2020 to 104,806 in October 2020 (see Chart 4.2). Mortgage approvals have now returned to more normal levels, with mortgage approvals for house purchase 4.8% higher in November 2021 relative to the average for November (2017 – 2019). However, this is also 32.7% below the level in November 2020, which can be explained by the unusually high level of housing market activity towards the end of 2020.
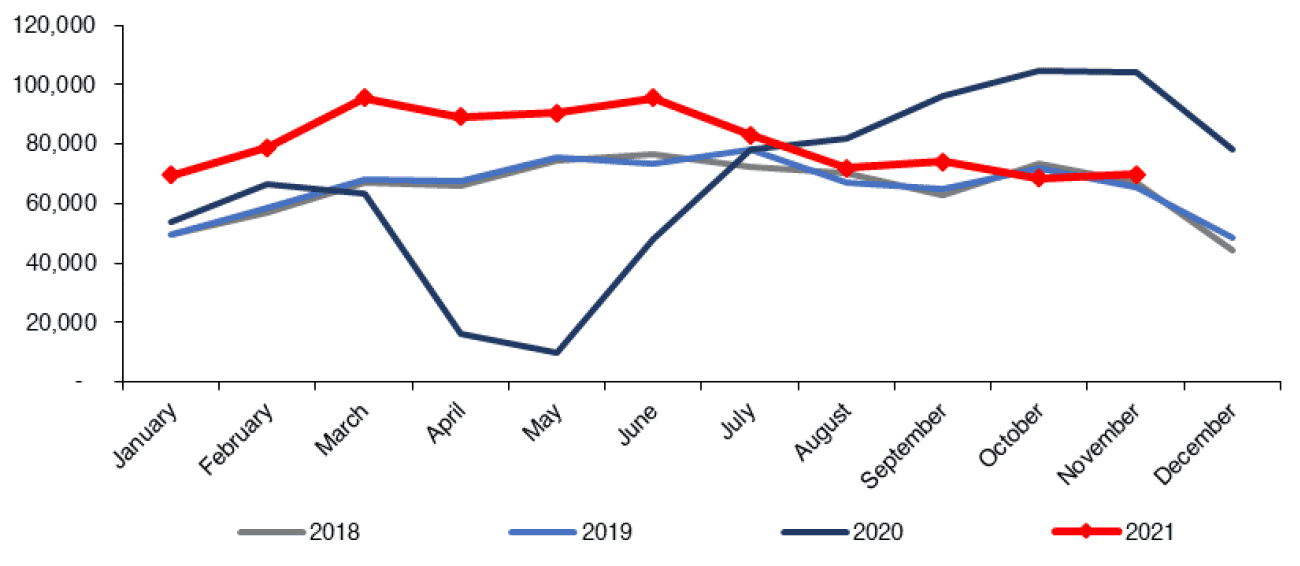
Source: Bank of England
Loan-to-Value (LTV) Ratios
In Q3 2021, the mean Loan-to-Value (LTV) ratio on new mortgages advanced to first-time buyers in Scotland stood at 81.8%, an annual increase of 3.4 percentage points. This likely reflects the return of high LTV ratio mortgages, whose availability fell substantially during the beginning of the coronavirus pandemic. Meanwhile, the mean LTV ratio for home movers in Scotland stood at 71.3% in Q3 2021, up 0.4 percentage points over the one year period. This is shown in Chart 4.3 (Source: UK Finance).
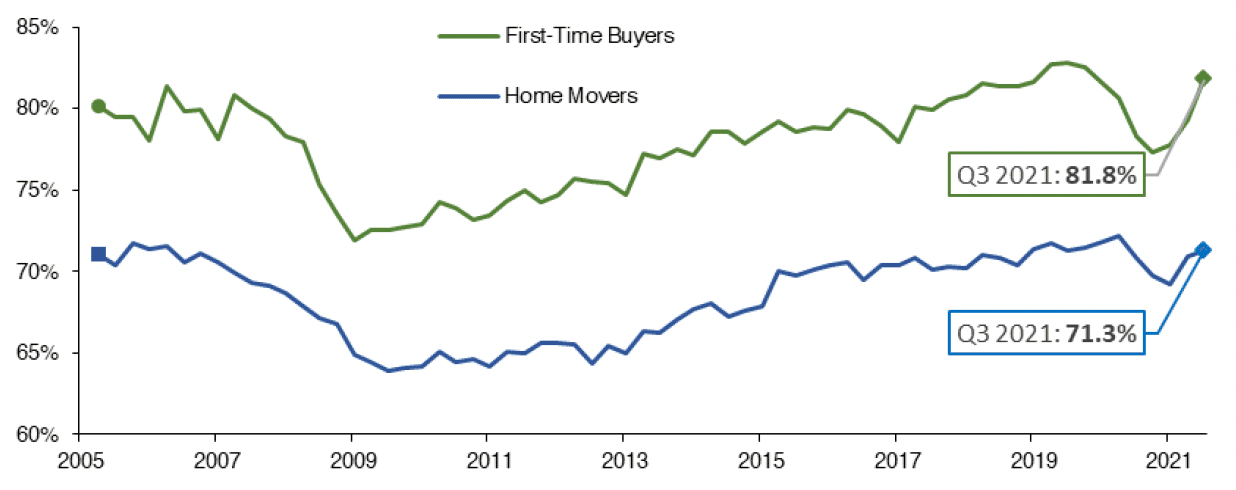
Source: UK Finance
Chart 4.4 shows that there was a reduction in new lending at high LTV mortgage ratios across the UK since March 2020. The share of gross mortgage advances across the UK in Q3 2021 with an LTV ratio greater than 90% was 4.2%, 0.6 percentage points above the share in Q3 2020 and 2.1 percentage points above the share in Q2 2021. There has been a slight recovery in lending which is both high LTV and high LTI (loan-to-income) over the quarter, with the share of gross advances classified as high LTV and LTI increasing to 3.3% in Q3 2021, up by 1.6 percentage points on Q2 2021.
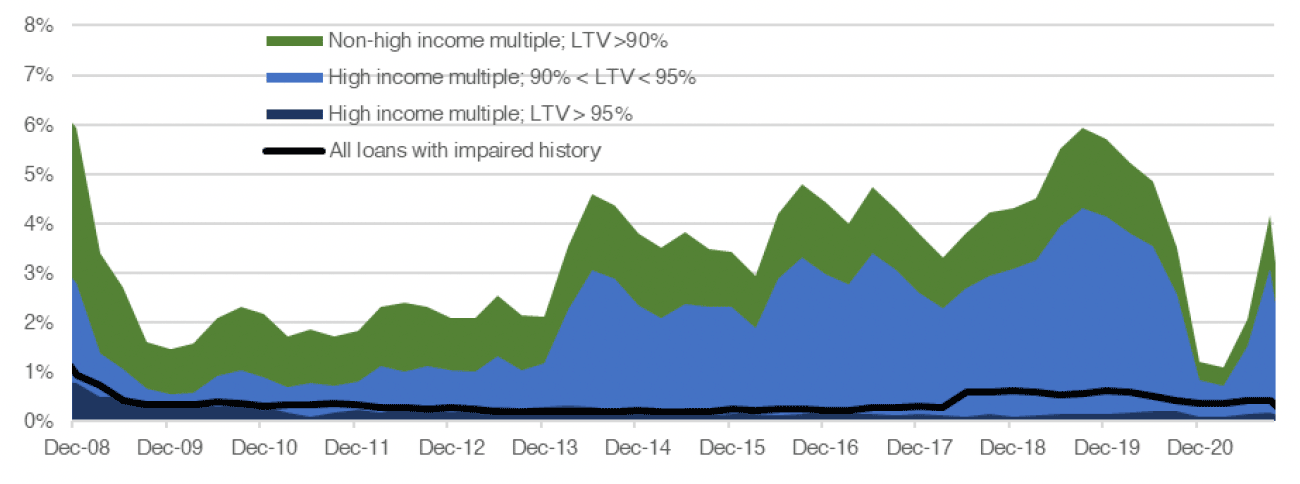
* Higher risk lending is classified by the FCA as an LTV over 90% and an income multiple greater than or equal to 3.5 for single income purchasers, or greater than or equal to 2.75 for joint income purchaser/s
Source: FCA
There has been a substantial increase in the number of high LTV products offered by mortgage lenders, with the number of 95% LTV mortgages products increasing from 8 in January 2021 to 347 in January 2022. While this recovery could in part reflect the UK Government's Mortgage Guarantee scheme, a number of high LTV products have been introduced outside this scheme (Source: Moneyfacts Mortgage Treasury Report).
Contact
Email: William.Ellison@gov.scot