Scottish Housing Market Review: Q1 2025
Quarterly bulletin collating a range of previously published statistics on the latest trends in the Scottish housing market.
Part of
1. Sales
1.1. Scottish Sales Performance: National
Source: Registers of Scotland
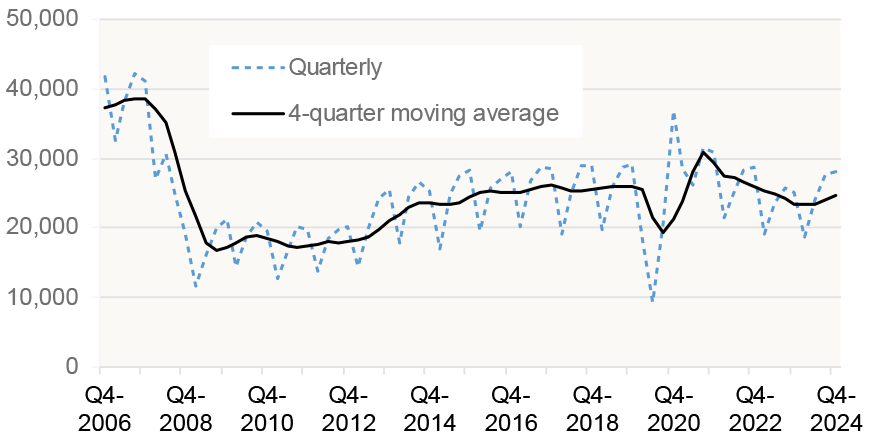
Chart 1.1 shows the volume of transactions for each quarter and the 4-quarter moving average which gives a better indication of the longer-term trend.[1]
Registers of Scotland statistics show that there were 28,099 residential property sales registered across Scotland in Q4 2024, which was an annual increase of 11.5%. This is the third consecutive quarter where the annual change in transactions has been positive, and the highest annual growth rate since Q3 2021.
As a result of the strong pickup in transactions in the second half of 2024, transactions across the whole of 2024 reached 98,674, a 5.4% increase on 2023. Although transactions in 2024 were 15.8% below 2021 (when transactions were boosted by pent-up demand after Covid restrictions were lifted as well as a temporary cut to LBTT), they were 5.7% higher than the post-financial-crisis annual average between 2010 and 2024 of 93,314. The softening of mortgage interest rates during 2024 (see Section 6) is one factor behind this rally in transactions.
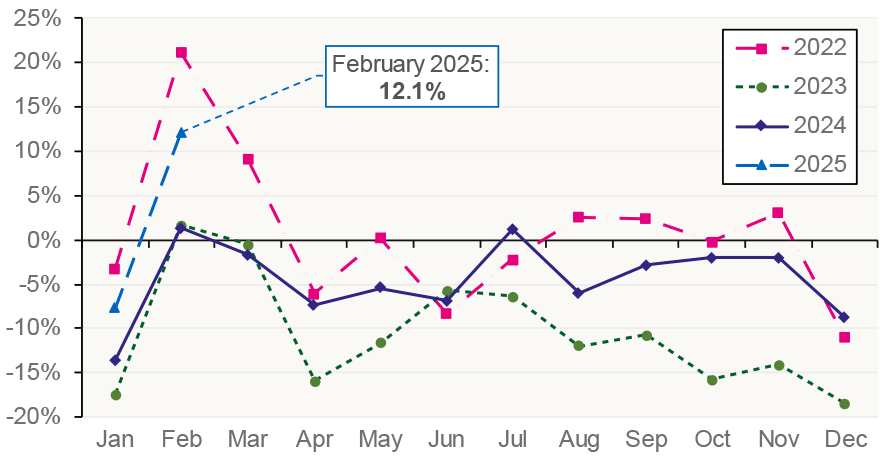
Chart 1.2, which uses Revenue Scotland data to plot the percentage difference between monthly residential LBTT returns relative to the corresponding month in 2019 (with 2019 chosen as the baseline to reflect pre-Covid market conditions), provides a more refined picture on sales trends. Similarly to the Registers of Scotland data, there was a significant increase in 2024, with 100,800 returns in 2024, 7.3% higher than the 93,940 returns in 2023. In the first two months of 2025, returns were 8.6% higher than in the corresponding months of 2024 and 1.2% higher than the corresponding months in 2019.
Source: Revenue Scotland
1.2. Scottish Sales Performance: Local Authorities
Table 1.1 sets out the level and annual change in quarterly transactions by local authority. The volume of transactions at local authority level can fluctuate significantly, particularly in smaller local authorities such as the island local authorities. To remove some of this volatility, the change in transactions in the last 4 quarters compared to the preceding 4 quarters is also presented.
Table 1.1 shows that housing market activity has increased across most areas in Scotland: in the four quarters to Q4 2024 compared to the previous four quarters, 27 out of the 32 Scottish local authorities had an increase in transactions. The local authority with the highest growth rate was Shetland Islands (16.8%), although, as noted, given the small number of transactions in this local authority changes tend to be volatile, followed by Edinburgh (13.0%). The largest fall was in Clackmannanshire (-5.9%) followed by Moray (-4.4%).
| Local Authority | Sales - Q4 2024 | Q4 2024 on Q4 2023 | 4 quarters to Q4 2024 on previous 4 quarters |
|---|---|---|---|
| Aberdeen City | 1,230 | 13.8% | 7.9% |
| Aberdeenshire | 1,157 | 25.2% | 4.4% |
| Angus | 557 | 16.5% | 2.0% |
| Argyll and Bute | 460 | -0.2% | 4.9% |
| City of Edinburgh | 3,283 | 22.0% | 13.0% |
| Clackmannanshire | 196 | -10.5% | -5.9% |
| Dumfries and Galloway | 716 | 18.0% | 6.2% |
| Dundee City | 712 | 13.7% | 10.0% |
| East Ayrshire | 640 | 8.7% | 1.5% |
| East Dunbartonshire | 520 | 19.8% | 9.2% |
| East Lothian | 684 | 8.6% | -1.4% |
| East Renfrewshire | 446 | -3.0% | -3.7% |
| Falkirk | 828 | 21.8% | 5.6% |
| Fife | 1,800 | 8.2% | 4.0% |
| Glasgow City | 2,963 | 4.0% | 4.3% |
| Highland | 1,184 | 7.8% | 4.9% |
| Inverclyde | 366 | 4.0% | 2.7% |
| Midlothian | 498 | 5.5% | 3.6% |
| Moray | 431 | -9.8% | -4.4% |
| Na h-Eileanan Siar | 97 | 4.3% | 6.5% |
| North Ayrshire | 702 | 3.4% | 1.7% |
| North Lanarkshire | 1,519 | 8.3% | 5.5% |
| Orkney Islands | 112 | 19.1% | 10.3% |
| Perth and Kinross | 902 | 16.8% | 7.5% |
| Renfrewshire | 1,067 | 13.6% | 3.4% |
| Scottish Borders | 540 | 8.7% | 6.6% |
| Shetland Islands | 69 | 21.1% | 16.8% |
| South Ayrshire | 697 | 5.0% | 2.6% |
| South Lanarkshire | 1,964 | 17.4% | 5.6% |
| Stirling | 482 | 12.6% | -3.9% |
| West Dunbartonshire | 348 | 0.3% | 5.2% |
| West Lothian | 929 | 23.2% | 11.0% |
| Scotland | 28,099 | 11.5% | 5.4% |
Source: Registers of Scotland
Contact
Email: jake.forsyth@gov.scot