Scottish Housing Market Review Q1 2023
Scottish housing market bulletins collating a range of statistics on house prices, housing market activity, cost and availability of finance and repossessions.
Part of
1. Sales
National
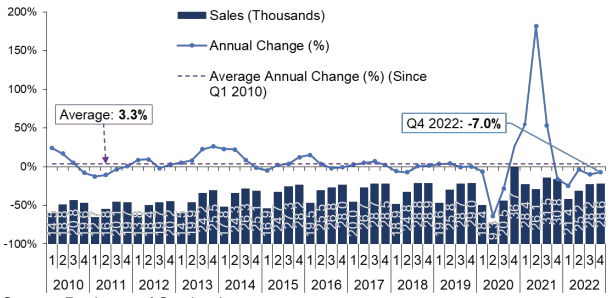
Source: Registers of Scotland
Scottish Sales Performance: National
Following the surge in transactions after home move restrictions were lifted in late June 2020, which was fuelled by pent-up demand as well as the temporary reduction in LBTT (which ended on 31 March 2021), data for Q4 2022 suggests housing market activity had stabilised at pre-pandemic levels, with Registers of Scotland statistics showing that there were 28,641 residential property sales registered across Scotland. Whilst relative to Q4 2021 this was an decrease of 7.0%, relative to the pre-pandemic average for Q4 (2016 - 2019), transactions increased by 0.2%.
More timely statistics from Revenue Scotland on the number of residential LBTT returns suggests that this stability might have changed more recently. Chart 1.2 plots the percentage difference between monthly residential LBTT returns over the period 2020 to 2023 relative to the corresponding month in 2019, with 2019 chosen as the baseline to reflect pre-Covid market conditions. While it can be seen that for much of the latter half of 2022, transactions closely tracked their level in 2019, over the last 3 months (December 2022 to February 2023) transactions were 9.7% lower than in the corresponding months of 2019. This could be due to the upward trend in interest rates, as well as the volatility in mortgage markets which followed the UKG Plan for Growth/mini-Budget on 23 September 2022.
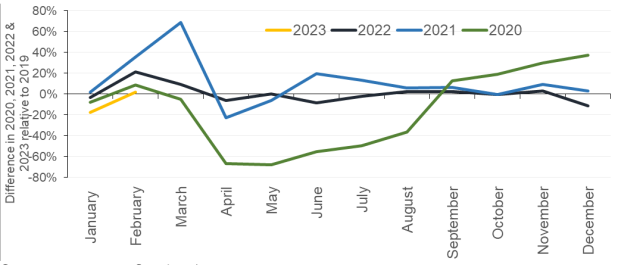
Source: Revenue Scotland
Scottish Sales Performance: Regional
Registers of Scotland data shows that housing market activity in Q4 2022 decreased relative to Q4 2021 across Scotland. The largest annual fall in residential property sales, of 15.3%, took place in Aberdeen/shire and Moray, whilst the smallest decrease, of 2.4%, took place in the Forth Valley. However, the large reductions in residential property sales reflects the high level of transactions in Q4 2021 across Scotland.
Analysing the annual change using a rolling four quarters method, it can be seen that the decrease in transactions at the national level for the one year period to Q4 2022 relative to the year prior has also been experienced across Scotland. The largest fall in residential property sales over this time period (13.6%) took place in Argyll & Bute and Highlands & Islands, whilst the smallest decrease again took place in the Forth Valley, where sales decreased by an annual 7.9%. Once again, the large reductions in residential property sales reflects the high level of transactions in 2021.
A summary of residential property sales activity by Scottish region is outlined in Table 1.1 below. This contains the number of residential property sales registered in Q4 2022, the annual change, as well as the annual change in sales using a rolling four quarter period to Q4 2022. The latter is included to smooth out volatility in quarterly data.
Table 1.1 Regional residential transactions
Aberdeen/shire and Moray
Sales – Q4 2022 2,917
12 Month Change -15.3%
Annual change (rolling 4
quarters) -9.3%
Edinburgh, Lothians and Borders
Sales – Q4 2022 5,618
12 Month Change -9.1%
Annual change (rolling
4 quarters) -12.1%
Argyll & Bute and Highland & Islands
Sales – Q4 2022 2,113
12 Month Change -3.2%
Annual change (rolling
4 quarters) -13.6%
Forth Valley
Sales – Q4 2022 1,582
12 Month Change -2.4%
Annual change (rolling 4
quarters) -7.9%
Ayrshires and Dumfries & Galloway
Sales – Q4 2022 2,625
12 Month Change -6.9%
Annual change (rolling
4 quarters) -10.7%
Tayside & Fife
Sales – Q4 2022 4,112
12 Month Change -6.4%
Annual change (rolling
4 quarters) -13.2%
Clyde Valley
Sales – Q4 2022 9,674
12 Month Change -4.9%
Annual change (rolling
4 quarters) -11.2%
Scotland
Sales – Q4 2022 28,641
12 Month Change -7.0%
Annual change (rolling
4 quarters) -11.4%
Source: Registers of Scotland
Contact
Email: William.Ellison@gov.scot