Scottish Household Survey 2021: methodology and fieldwork outcomes
Methodology of the 2021 Scottish Household Survey and information on fieldwork targets and outcomes.
Weighting
Introduction
Weighting aims to ensure that the Scottish Household Survey results represent the population of Scotland as a whole. The procedures for the implementation of the weighting methodology were developed by the Scottish Government working with the Methodology Advisory Service at the Office for National Statistics. The weighting procedures for the SHS incorporate:
- Selection weighting to address unequal selection probabilities resulting from the sampling methods.
- Calibration weighting to correct for non-response bias. Calibration weighting derives weights such that the weighted survey totals match known population totals. For the 2021 SHS, the population totals used were the National Records of Scotland's (NRS) Mid-2021 Population Estimates Scotland. For households, the NRS Households and Dwellings in Scotland, 2021 estimates were used and these were also used for the physical survey. The NRS Mid-2021 Small Area Population Estimates for 2011 Data Zones and the 2021 Small Area Statistics on Households and Dwellings were used for population and household totals by SIMD quintile and Urban Rural Classification.
- To undertake the calibration weighting the ReGenesees Package for R was used. Within this, to execute the calibration, a linear distance function was implemented.
Changes to weighting approach for 2020 and 2021
Up to and including the 2019 SHS, results had been weighted in broadly the same way. However, the shift from face-to-face to remote interviewing in 2020 was associated with changes in the profile of the achieved sample that were unlikely to reflect real changes in Scotland's population. These included:
- Tenure type – increase in owner-occupation and a decrease in rented housing, particularly social rented housing.
- Length of time at property – increase in the proportion of respondents who had lived at their address for over 15 years.
- Property type – increase in houses, decrease in flats.
- Age – increase in household and random adult respondents aged 60+.
- Highest educational attainment – increase in random adults with a degree or professional qualification, decrease in adults with Level 1 qualifications or no educational qualifications.
- SIMD quintile – skew towards lower deprivation, with an increase in respondents from the two least-deprived quintiles.
As a result, alternative weighting methods to those used pre-2020 were developed. The changes to the weighting methodology for the 2020 SHS, and the rationale behind these, are described in detail in the 2020 methodology report. The main change was to add the proportion of the population living in each SIMD quintile and 6-fold rural-urban classification as calibration targets, to address the more pronounced under-representation of households from urban and deprived areas than in previous years. A separate weight for use with the housing data was also created, which added calibration targets for tenure based on the SSCQ 2019 data. This gave more feasible results for a range of housing related measures including dwelling type, number of bedrooms, housing views and aspirations, and households on a housing list.
Due to the methodology used to collect the 2021 SHS data, the profile of the achieved sample differed from 2019 and earlier in a similar way to the 2020 SHS data. When weighting the 2021 data, two primary approaches were considered. One was to use the 2019 (and earlier) calibration models, while the second was to use the 2020 calibration models. Both approaches produced similar results. For all of the key measures that would be expected to remain broadly stable in the population, there were no statistically significant differences between the 2020 results and the 2021 results when weighting using either approach. However, the differences between the 2020 and 2021 achieved samples were least when the 2020 approach was used. Therefore, to maximise comparability with the 2020 results, the 2021 results were weighted using the 2020 approach.
The weight for use with the 2021 housing data includes calibration targets for tenure based on the SSCQ 2019 data. There are two issues associated with this. First, to a degree this effectively calibrates the SHS data against itself, as a large proportion of the SSCQ data is comprised of that collected through the SHS. Second, tenure data from the 2019 SSCQ are now two years older than the SHS data. However, due to the lack of complete administrative data or data from a recent census on household tenure, there was no ideal alternative if we wished to consider a calibration model that included household tenure.
Household weights
This weight is for use with variables that relate to the household. There were three steps to creating the household weight:
1) Selection weights
The address selection weights were calculated to compensate for unequal probabilities of selection of addresses in different survey strata. For the SHS there were 32 strata – one for each local authority. The address selection weight for each stratum was calculated as the proportion of Scottish households (from NRS estimates) in the stratum, divided by the proportion of all responding addresses in the stratum. Though the SHS sample was drawn in two halves, with telephone matching used for the first half of the sample but not the second, results for 2021 are being presented by combining the two halves of the sample. Therefore, the selection probabilities have been averaged across the two halves of the sample.
2) Calibrated household weight
The stratum selection weight was applied to the survey data to act as entry weights for the calibration. The execution of the calibration step then modified the entry weights so that the weighted total of all members of responding households matched NRS population totals for age bands and sex within each local authority. Similar to the weighting of the 2020 survey, SIMD quintiles and Urban-Rural Classification were also included in the calibration at local authority level.
As with the 2020 survey, an alternative method was used to produce weights for housing related questions. A constraint was added to ensure that households matched percentage estimates by household tenure (owner occupied households and all other tenures combined) within each local authority based on estimates from the Scottish Survey Core Questions (SSCQ) 2019.
3) Households adjustment
The calibration step ensured that survey totals matched the population totals for local authorities but not the household totals. To make the sample representative of households at local authority level, a scaling factor was applied so that the weighted number of households from the sample matched the NRS local authority household estimates.
Random adult weights
Within responding households a random adult was selected to answer individual questions. There were three stages to creating the random adult weights:
1) Stratum selection weight
A new stratum selection weight is required for the random adults as the reference population is all adults within the stratum. Also, not all random adults in households that completed the household section responded to the survey. The stratum selection weight was calculated as the proportion of Scottish adults in the stratum (from NRS estimates) divided by the proportion of all responding adults in the stratum.
2) Adult selection weight
The probability of an adult within a household being selected for the random adult interview was inversely proportional to the number of adults within a household – i.e. in a single adult household the only adult resident must be sampled but in a three adult household each adult only has a one in three chance of being selected. To correct for this unequal probability of selection an adult selection weight equal to the number of adults in the household was applied.
3) Calibrated weight
The stratum selection weight and adult selection weight were multiplied together and applied to the survey data. The execution of the calibration step then modified these combined entry weights so that the weighted total of responding random adults matched NRS adult population totals for age bands and sex within each local authority. Similar to the household weights, SIMD quintiles, Urban-Rural Classification and household tenure (housing related questions) were also included in the calibration at local authority level.
Random schoolchild weights
A separate weight was required for information collected about a random schoolchild within responding households. The weighting procedures for the random schoolchild were similar to those for the random adult:
1) Stratum selection weights
Stratum selection weights were calculated as the proportion of Scottish school age children in the stratum (from NRS estimates), divided by the proportion of all responding school children in the stratum.
2) Random schoolchild selection weight
As with the random adult weight, only one child was selected within each household so a selection weight equal to the number of eligible children in the household was required.
3) Calibration weight
Population estimates for the number of schoolchildren resident in each local authority are not available. Available population estimates are for child age, and the school census gives the local authority totals for place of schooling rather than residence. Therefore, the population of schoolchildren was estimated using the survey data by applying the household grossing weight to calculate the total number of pupils in each local authority by age group. The selection weights were then combined and applied to the data before the calibration was run to match the random schoolchild totals to the target populations by age group and local authority. Similar to the household and random adult weights, SIMD quintiles, Urban-Rural Classification and household tenure (housing related questions) were also included in the calibration at Scotland level.
Travel diary weight
The travel diary questions were asked as part of the random adult interview. The travel diary collects information on all travel undertaken on the day prior to interview. Over the fieldwork period significantly fewer interviews took place on Fridays, Saturdays and Sundays when compared to other days.
The working status of respondents was also found to vary across day of response, with disproportionately more adults in full-time employment interviewed at the weekend.
These factors resulted in two stages of rescaling the random adult weights for travel diary analysis:
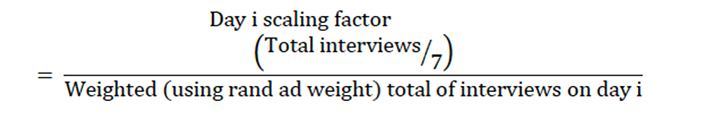
1) To ensure the travel diary was representative of travel patterns for the week as a whole, the random adult weights were rescaled so that the weighted number of interviews was equal for each day of the week. The scaling factor was given by dividing the total number of interviews by 7, and then dividing by the weighted (using the random adult weight) total interviews on that day:
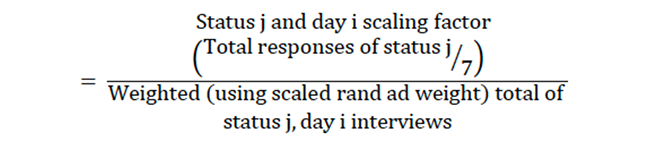
To ensure the travel diary was representative of working status across each day, a second scaling factor was derived such that the working status breakdown for each day was equal.
The scaling factor was given by dividing the total number of responses for each working status by 7, and then dividing by the weighted (using the random adult weight) total interviews for that working status on that day:
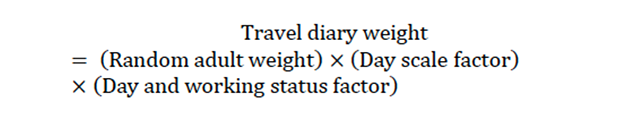
The final travel diary weight was then calculated as the random adult weight multiplied by the day scale factor multiplied by the day and working status factor:
Physical survey weight
A subsample of the total SHS sample was allocated to the physical survey. This subsample completed a specific module of the SHS in the main interview. The physical survey usually involves a visual inspection of the inside and outside of the property. However, due to Covid-19 restrictions the 2021 physical survey was carried out by an external-only inspection, supplemented with alternative sources of data, e.g. from the Energy Performance Certificate (EPC), and the householder providing information to surveyors via telephone:
1) Selection weights
The address selection weights were calculated to compensate for unequal probabilities of selection of addresses in different survey strata. Usually, for the physical survey there were 32 strata – one for each local authority. The address selection weight for each stratum is calculated as the proportion of Scottish households (from NRS estimates) in the stratum divided by the proportion of eligible selected addresses in the stratum. For 2021, the selection probability depended on the local authority and household tenure, the latter obtained as part of the social survey interview. The approach was adapted with a different selection weight applied for owner occupiers and renters within each local authority to account for the unequal probabilities of selection based on household tenure.
Though the SHS sample was drawn in two halves, with telephone matching used for the first half of the sample but not the second, results for 2021 are being presented by combining the two halves of the sample. Therefore, the selection probabilities have been averaged across the two halves of the sample.
2) Calibration
The stratum selection weight was applied to the survey data to act as entry weights for the calibration. The execution of the calibration step then modified the entry weights so that the weighted total of responding households matched:
a) The number of households in each local authority
b) Dwelling age at Scotland level
c) Dwelling type at Scotland level
d) Urban-rural classification at Scotland level
e) SIMD quintile at Scotland level
f) Household tenure at Scotland level
In previous years, the totals for targets (b) and (c) were generated from the sample itself. This was possible because for almost all of the addresses in the physical survey sample, even where an interview or physical survey were not completed, a visual inspection of the selected address was conducted to record information on dwelling type and age. The Scotland-level targets were then generated from the frequencies for dwelling age and type from the sample weighted with the selection weight. A similar process is normally used to set calibration targets for (d), which can be determined from the address information in the sample. Since it was not possible to gather this summary information in 2021, the targets based on the 2019 survey were re-scaled to the updated household estimates to produce the targets for (b), (c) and (d). As with the weighting of the social survey, SIMD quintiles and household tenure were also included in the calibration of the physical survey weights.
| Dwelling type | Calibration target |
|---|---|
| Detached | 583,535 |
| Semi | 500,334 |
| Terrace/corner | 531,583 |
| Tenement | 594,586 |
| Other flat | 318,787 |
| Total | 2,528,824 |
| Dwelling age | Calibration target |
|---|---|
| Pre-1919 | 485,695 |
| 1919-1944 | 276,804 |
| 1945-1964 | 525,319 |
| 1965-1982 | 555,560 |
| 1983-2002 | 386,072 |
| Post 2002 | 299,373 |
| Total | 2,528,824 |
Contact
Email: shs@gov.scot