Scottish house condition survey: 2019 key findings
Figures from the 2019 survey, including updated fuel poverty rates, energy efficiency ratings, the condition of housing and the Scottish Housing Quality Standard.
2 Key Attributes of the Scottish Housing Stock
10. The Scottish House Condition Survey provides a snapshot of the Scottish housing stock in each survey year. This chapter sets out information on the basic attributes of occupied Scottish dwellings as captured in 2019. Subsequent chapters build on this and provide more details on energy efficiency, fuel poverty, housing quality and disrepair.
11. The following topics are included:
- the construction age and built form of Scottish domestic buildings;
- the dwellings' location in relation to the gas network and the type of fuel used to heat them;
- the relationship between the dwellings' attributes and household tenure; and
- the composition of the households who occupy them.
2.1 Dwelling Age and Type
12. The age of construction and the built form of a dwelling has consequences for energy performance, running costs and living conditions. For example, older dwellings built with solid stone walls are typically less effective at preventing heat transmittance between the inside and the outside of a building than properties that have been built using modern construction materials and that, since 1982, have been subject to increasingly rigorous minimum standards of energy efficiency and airtightness.
13. More information on the main dwelling types used in the SHCS is provided in section 7.8.1.
14. At the same time, types of dwellings can differ in terms of the size of the external surface area; dwellings with a smaller area of exposed wall, for example those that are shielded by adjacent properties, typically have lower levels of heat loss than in buildings with fewer sheltered sides.
15. The Scottish housing stock is diverse and varies across the country and between rural and urban areas. However, some common types can be recognised in Figure 1:
- Old (pre-1919) detached houses (5%; around 122,000) and tenement flats (7%; 184,000)
- More modern post-1982 detached houses (10%; 255,000) and tenements (7%; 177,000)
- Post-war terraced houses (14%; 353,000 built between 1945 and 1982)
- Semi-detached houses, common across all age bands and accounting for around 20% of the stock alone.
16. These six broad categories account for 63% of the overall housing stock however there is also variability within these groups. For example, among pre-1919 tenement flats, of the type common in Edinburgh and Glasgow, there is a wide range of sizes, layouts and areas of exposure (for example in top floor flats the roof is exposed) which affects their energy efficiency and the living conditions experienced by the household.
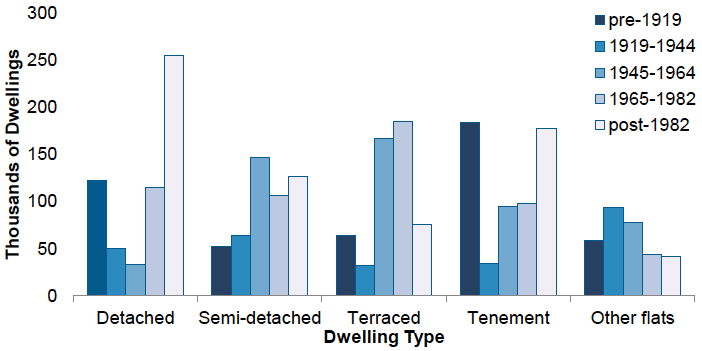
17. The proportion of the stock in each dwelling age band and type is provided in Table 1. Numbers of dwellings of each age group and type are shown in Table 2.
| Age of dwelling | Type of Dwelling | |||||
|---|---|---|---|---|---|---|
| Detached | Semi-detached | Terraced | Tenement | Other flats | Total | |
| pre-1919 | 5% | 2% | 3% | 7% | 2% | 19% |
| 1919-1944 | 2% | 3% | 1% | 1% | 4% | 11% |
| 1945-1964 | 1% | 6% | 7% | 4% | 3% | 21% |
| 1965-1982 | 5% | 4% | 7% | 4% | 2% | 22% |
| post-1982 | 10% | 5% | 3% | 7% | 2% | 27% |
| Total | 23% | 20% | 21% | 24% | 13% | 100% |
| Sample size | 2,997 | |||||
| Age of dwelling | Type of Dwelling | |||||
|---|---|---|---|---|---|---|
| Detached | Semi-detached | Terraced | Tenement | Other flats | Total | |
| pre-1919 | 122 | 52 | 64 | 184 | 58 | 479 |
| 1919-1944 | 50 | 64 | 32 | 34 | 93 | 273 |
| 1945-1964 | 33 | 146 | 167 | 95 | 78 | 518 |
| 1965-1982 | 115 | 106 | 185 | 98 | 44 | 548 |
| post-1982 | 255 | 126 | 76 | 177 | 42 | 677 |
| Total | 576 | 494 | 525 | 587 | 315 | 2,496 |
| Sample size | 2,997 | |||||
18. The category 'other flats' includes houses that have been converted to flats (34,000), towers / slabs (57,000) and so-called "4-in-a-block" flats (223,000).
- "4-in-a-block" flats were commonly built as social housing between 1919 and 1965 (70% of "4-in-a-block" flats fall in that age category).
- 78% of towers / slabs were built in the 1945 to 1982 period, again often as social housing.
- Converted flats are almost exclusively pre-1919 structures (99.7%), where a house has been divided into multiple residences.
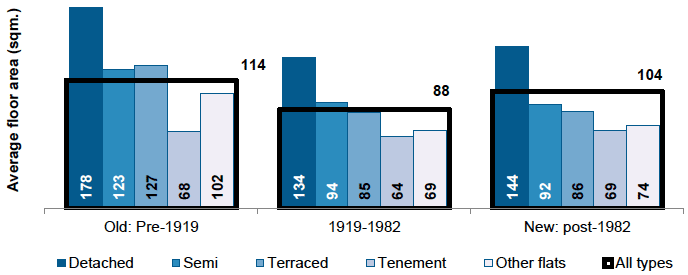
2.1.1 Dwelling Size (Floor Area)
19. The size of the internal floor area has implications for the heating requirements of a dwelling. Larger dwellings require greater heat inputs and therefore cost more to heat. This has a direct impact on fuel poverty (see Chapter 4).
20. Pre-1919 dwellings tend to be larger than the other two age categories across dwelling types with the exception of tenements which on average are comparable in size to more recently built ones (Figure 2). Semi-detached houses built after 1919 are on average around three-quarters of the size of those built pre-1919. Terraced houses built after 1919 are around two thirds the size those built pre-1919.
21. The overall average for post-1982 dwellings is somewhat higher compared to those built between 1919 and 1982. This is largely driven by differences in detached houses, which are both larger in size and more common in the post-1982 stock (see Table 2).
22. Rural dwellings are, on average, 31% larger than urban dwellings based on internal floor area, as shown in Table 3. The difference is smallest for dwellings built between 1919 and 1982 at 16%. Among pre-1919 and post-1982 dwellings, rural properties are around 34% larger.
| Dwelling Age | Location | Rural % larger | ||
|---|---|---|---|---|
| Urban | Rural | All | ||
| Pre-1919 | 105 | 141 | 114 | 34% |
| Sample size | 345 | 201 | 546 | |
| 1919-1982 | 86 | 100 | 88 | 16% |
| Sample size | 1347 | 305 | 1652 | |
| Post-1982 | 97 | 131 | 104 | 34% |
| Sample size | 588 | 211 | 799 | |
| All Age Bands | 93 | 121 | 97 | 31% |
| Sample size | 2280 | 717 | 2997 | |
Urban/rural categories are based on the 2013/14 Scottish Government Urban/Rural classification to be consistent with survey weighting as described in Section 7.8.3.
2.2 Gas Grid Coverage and Rural/Urban Location
23. Approximately 17% of dwellings in Scotland are estimated to be outside the coverage of the gas grid.[1] As shown in Table 4, the majority (93%) of urban dwellings are within the coverage of the gas grid, whereas almost two-thirds (65%) of those in rural areas are not.
| Location | |||||||||
|---|---|---|---|---|---|---|---|---|---|
| Gas Grid Coverage | Urban | Rural | |||||||
| 000s | row % | col % | 000s | row % | col % | 000s | row % | col % | |
| On Gas Grid | 2,079 | 100% | 83% | 1,928 | 93% | 93% | 150 | 7% | 35% |
| Off Gas Grid | 417 | 100% | 17% | 143 | 34% | 7% | 274 | 66% | 65% |
| Total | 2,496 | 100% | 2,071 | 83% | 100% | 425 | 17% | 100% | |
| Sample size | 2,997 | 2,280 | 717 | ||||||
Urban/rural categories are based on the 2013/14 Scottish Government Urban/Rural classification to be consistent with survey weighting as described in Section 7.8.3.
24. Connection to the gas grid allows households to use gas for heating and hot water. As gas is currently the cheapest of the major commercial fuels, gas grid access can be a significant determinant in the required cost of heating a home to a satisfactory temperature.
25. Figure 3 shows the number of dwellings in rural and urban areas by property type.
26. Half (50%; 214,000 households) of all rural dwellings are detached, and 24% (102,000) are semi-detached. Only 11% of rural dwellings are flats; 45,000 in total.
27. The most common dwelling type in urban areas is the tenement flat (573,000), accounting for around 28% of urban housing. Around 59% of urban stock are detached, semi-detached and terraced houses, in total accounting for 1.2 million of the 2.1 million urban dwellings.
Figure 3: Dwelling Types in Rural and Urban Areas (000s), 2019

Urban/rural categories are based on the 2013/14 Scottish Government Urban/Rural classification to be consistent with survey weighting as described in Section 7.8.3.
2.3 Heating Fuel
28. This section examines the distribution of dwellings in terms of the primary heating fuel used and a range of other characteristics, such as age and type of dwelling. The relationship between the type of fuel used, the energy efficiency rating and fuel poverty will be explored further in later chapters.
29. Overwhelmingly the most common heating fuel is mains gas: 81% of Scottish households (around 2.0 million) use mains gas for heating, 11% use electricity and 5% use oil (Table 5), these are similar to 2018.
| Primary Heating Fuel | All Stock | Owner Occupied | Private Rented | Social | ||||
|---|---|---|---|---|---|---|---|---|
| 000s | % | 000s | % | 000s | % | 000s | % | |
| Mains gas | 2,016 | 81% | 1,277 | 82% | 230 | 74% | 509 | 80% |
| Electricity | 262 | 11% | 121 | 8% | 53 | 17% | 88 | 14% |
| Oil | 129 | 5% | 111 | 7% | 15 | 5% | 2 | 0% |
| Communal Heating | 34 | 1% | * | * | * | * | 28 | 4% |
| LPG bulk or bottled | 18 | 1% | * | * | * | * | - | - |
| Solid mineral fuel | 20 | 1% | 10 | 1% | 4 | 1% | 6 | 1% |
| Biomass | 16 | 1% | 11 | 1% | 4 | 1% | - | - |
| Sample size | 2,997 | 1,965 | 317 | 715 | ||||
"*" denotes cases where attributes appear too rarely to provide an adequate basis for reporting. "-"denotes no sampled cases. See section 7.1.6 for table conventions.
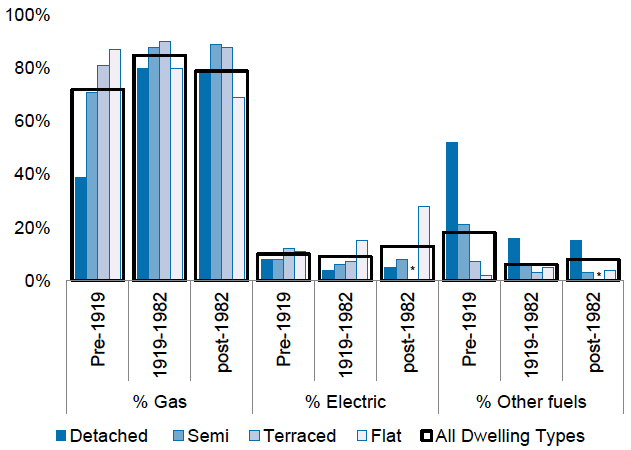
30. Mains gas and electricity are the primary fuel types present in 94% of social housing with a further 4% (28,000 households) using some form of communal heating. Conversely, oil is rarely used to heat social housing, but is the primary heating fuel in 7% of owner occupied dwellings and 5% of private rented dwellings.
31. Mains gas use is less prevalent in private rented households at 74% compared to 82% in owner occupied dwellings and 80% in social housing.
32. Owner occupier households were less likely to use electricity as their primary fuel type at 8% compared to 17% of private rented dwellings and 14% of social sector dwellings.
33. 85% of dwellings built between 1919 and 1982 use gas as their primary heating fuel (Table 6). In comparison, 79% of dwellings built after 1982 and 72% of dwellings built pre-1919 use gas. Older dwellings more commonly (18%) use other fuel types aside from gas or electricity than newer dwellings.
| Dwelling Type | Dwelling Age | Primary Heating Fuel | Sample size | ||
|---|---|---|---|---|---|
| Gas | Electric | Other | |||
| All Dwelling types | All age bands | 81% | 11% | 9% | 2,997 |
| pre-1919 | 72% | 10% | 18% | 546 | |
| 1919-1982 | 85% | 9% | 6% | 1652 | |
| post-1982 | 79% | 13% | 8% | 799 | |
| Detached | All age bands | 71% | 6% | 23% | 852 |
| pre-1919 | 39% | 8% | 52% | 186 | |
| 1919-1982 | 80% | 4% | 16% | 316 | |
| post-1982 | 79% | 5% | 15% | 350 | |
| Semi | All age bands | 87% | 6% | 7% | 685 |
| pre-1919 | 71% | 8% | 21% | 74 | |
| 1919-1982 | 88% | 6% | 6% | 446 | |
| post-1982 | 89% | 8% | 3% | 165 | |
| Terraced | All age bands | 89% | 8% | 3% | 589 |
| pre-1919 | 81% | 12% | 7% | 74 | |
| 1919-1982 | 90% | 7% | 3% | 438 | |
| post-1982 | 88% | * | * | 77 | |
| Flat | All age bands | 79% | 17% | 4% | 871 |
| pre-1919 | 87% | 11% | 2% | 212 | |
| 1919-1982 | 80% | 15% | 5% | 452 | |
| post-1982 | 69% | 28% | 4% | 207 | |
34. Primary heating fuel also varies by type of dwelling (Table 6). Households living in detached houses are least likely to use mains gas for heating; 71% of them do, compared to 81% of households for Scotland as a whole and 89% of those households living in terraced houses. This is due to the greater prevalence of alternative heating fuels amongst pre-1919 detached houses. 39% of pre-1919 detached houses use gas as their primary heating fuel, 8% use electricity, and more than half (52%) are reliant on an alternative fuel source for space heating and hot water. As shown in Figure 3 this is largely due to the higher proportion of detached dwellings in rural areas and Table 4 demonstrates that dwellings in rural areas are less likely to be within the coverage of the gas grid.
35. "Other" fuels (than gas or electricity) are most commonly used in detached houses. Flats have the highest levels of electricity (17%) as main heating fuel.
36. Primary heating fuel varies by geographic location. 89% of dwellings in urban locations use mains gas as their primary heating fuel compared to 40% of those in rural locations. By contrast, there are higher rates of electricity and oil as primary heating fuel in rural locations, 20% and 28%, respectively, compared to urban locations where electricity is used in 9% and oil in less than 1% of dwellings (Table 7).
| Primary Heating Fuel | All Stock | Urban | Rural | |||
|---|---|---|---|---|---|---|
| 000s | % | 000s | % | 000s | % | |
| Mains gas | 2,016 | 81% | 1,845 | 89% | 171 | 40% |
| Electricity | 262 | 11% | 177 | 9% | 85 | 20% |
| Oil | 129 | 5% | 10 | 0% | 119 | 28% |
| Communal Heating | 34 | 1% | 32 | 2% | 2 | 1% |
| LPG bulk or bottled | 18 | 1% | * | * | * | * |
| Solid mineral fuel | 20 | 1% | 3 | 0% | 17 | 4% |
| Biomass | 16 | 1% | * | * | * | * |
| Sample size | 2,997 | 2,280 | 717 | |||
Urban/rural categories are based on the 2013/14 Scottish Government Urban/Rural classification to be consistent with survey weighting as described in Section 7.8.3.
2.4 Household Type
37. In this report we describe households in terms of three main types which are derived from the more detailed classification used in the Scottish Household Survey:
- Families. These are households which contain at least one child aged under 16. The resident adult(s) may be of any age.
- Older households. One- or two-member households which include at least one resident aged 65 or older.
- Other households. These are all other household types which are made up of adults only and have no resident children.
38. More details about the definitions are provided in section 7.8.2. This grouping was introduced in the 2015 Key Findings report and is different from the one used in previous reports, where the pensionable age for women was 60 and 65 for men. From 2015 onwards, 65 is adopted as the common age threshold for both men and women for older households reflecting the gradual increase in the state pension age for women.
39. There is a broad association between household types and the type of dwellings they occupy, as shown in Figure 5 and Table 8. While families and older households are more likely to live in houses (both 71%), other households are more evenly split between houses and flats (55% and 45% respectively).
40. Families have the highest proportional occupancy of post-1982 houses: 28% of households with children live in post-1982 houses, compared with 13% of older households and 17% of other types of households. The highest occupancy of pre-1919 flats is observed among other types of households, 16%, compared to 3% for families and 6% for older households.
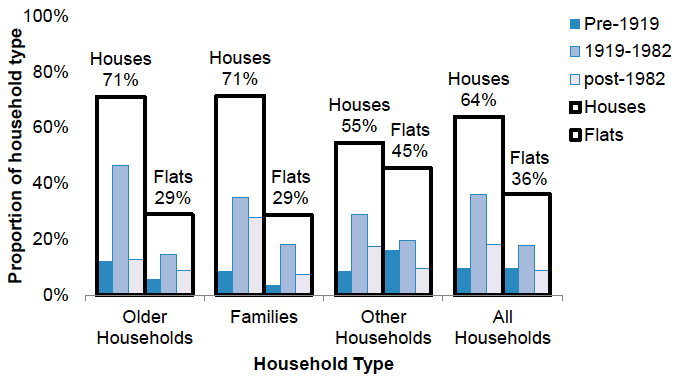
| Dwelling Type and Age Band | Older Households | Families | Other Households | All Household Types | |
|---|---|---|---|---|---|
| Houses | Pre-1919 | 12% | 8% | 8% | 10% |
| 1919-1982 | 46% | 35% | 29% | 36% | |
| Post-1982 | 13% | 28% | 17% | 18% | |
| Subtotal | 71% | 71% | 55% | 64% | |
| Flats | Pre-1919 | 6% | 3% | 16% | 10% |
| 1919-1982 | 15% | 18% | 20% | 18% | |
| Post-1982 | 9% | 7% | 10% | 9% | |
| Subtotal | 29% | 29% | 45% | 36% | |
| Total | 100% | 100% | 100% | 100% | |
| Sample size | 1,039 | 706 | 1,252 | 2,997 | |
2.5 Tenure
41. Statistics on tenure in the SHCS are based on the achieved sample of dwellings in the physical survey and are not calibrated against figures produced as part of the Scottish Government Housing Statistics for Scotland publication or the Scottish Household Survey publication (which is based on a larger sample and different weighting methodology). For estimates of the total number of dwellings by tenure, readers are referred to the Housing Statistics for Scotland publication which uses information from social landlords' returns which comprehensively cover the social housing sector and therefore provides more accurate estimates of the total stock.
42. In this section we explore data from the SHCS sample which provides more detailed information on the composition of each tenure type.
2.5.1 Household Type and Tenure
43. There are some clear differences in household type across tenure, as shown in Figure 6.
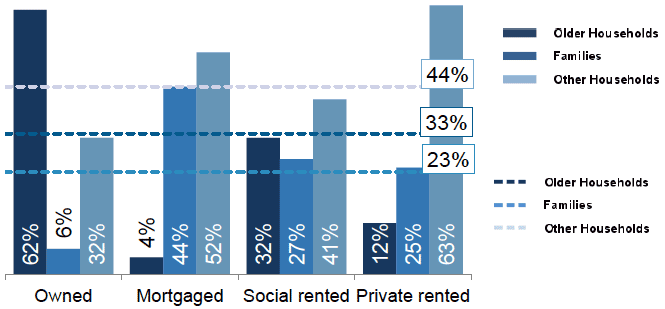
Note: Dashed lines represent the proportion of household type in Scotland as a whole.
44. Owner occupiers with mortgages are predominantly families (44%) and other households (52%). The majority of those who own their properties outright are older households (62%) and other types of households (32%).
45. The majority of those who live in the private rented sector (PRS) belong to other households (63%) and only 12% are older households. Around a quarter of renters in both the private (25%) and the social sector (27%) are households with children, which reflects their share in the national population.
2.5.2 Dwelling Type and Tenure
46. Figure 7 shows that rented properties in the Housing Association (HA) and private rented sectors are more likely to be flats. Flats account for 66% of Housing Association (HA) stock and 67% of dwellings rented from private sector landlords.
47. Owner-occupied dwellings are more likely to be houses: 81% of dwellings owned outright and 75% of those with a mortgage, compared to 52% of dwellings owned by Local Authorities, 34% of Housing Association stock and 33% of private rented properties.
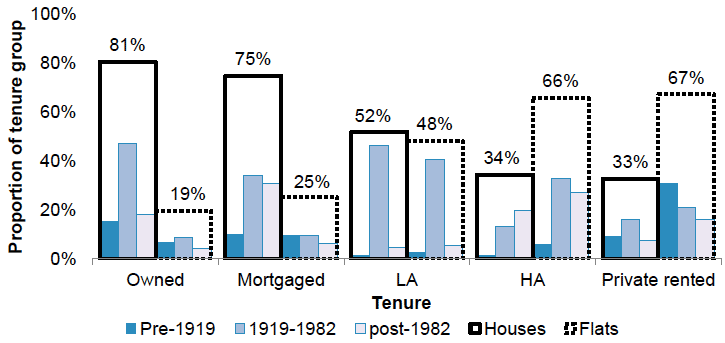
48. Almost all properties (87%) owned by Local Authorities were built between 1919 and 1982, while less than half (46%) of the Housing Associations stock was built in this period. Private rented sector dwellings are older, with 40% built before 1919, compared with 37% built between 1919 and 1982 (Table 9).
| Dwelling Age and Type | Owned | Mortgaged | LA | HA | Private rented | |
|---|---|---|---|---|---|---|
| Houses | Pre-1919 | 15% | 10% | 1% | 1% | 9% |
| 1919-1982 | 47% | 34% | 46% | 13% | 16% | |
| Post-1982 | 18% | 31% | 4% | 20% | 7% | |
| Subtotal | 81% | 75% | 52% | 34% | 33% | |
| Flats | Pre-1919 | 7% | 9% | 2% | 6% | 31% |
| 1919-1982 | 9% | 10% | 41% | 33% | 21% | |
| Post-1982 | 4% | 6% | 5% | 27% | 16% | |
| Subtotal | 19% | 25% | 48% | 66% | 67% | |
| Total | 100% | 100% | 100% | 100% | 100% | |
| Sample size | 1159 | 806 | 425 | 290 | 317 | |
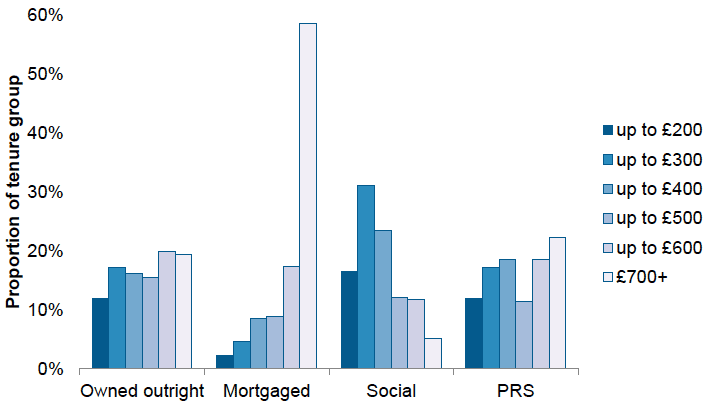
2.6 Household Income Band
49. As we might expect, income and tenure are closely correlated. For social sector residents the distribution is skewed towards lower income groups, as shown in Figure 8, while households with mortgages have the largest share of higher income groups.
50. The distribution of households by income in the PRS is broadly similar to that for outright owner occupiers. It is generally wider than the social housing sector, including significant shares of both higher and lower income band households.