Scottish Greenhouse Gas Statistics 2021
Official statistics showing emissions of greenhouse gases in Scotland over the period 1990 to 2021.
Section D. Revisions to the Inventory and Methodology
This section examines key revisions in estimated source emissions between the latest inventory (1990-2021) and the previous inventory (1990-2020). It also provides a summary of the cumulative impact of revisions since the 1990-2008 inventory. In October 2015, the Scottish Government published a paper Scottish Greenhouse Gas Emissions 2013. Key Revisions Since 2008, which provides a breakdown of the key revisions to the data within the Scottish Greenhouse Gas Emissions Official Statistics publication over successive years from the 1990-2008 inventory to the 1990-2013 inventory. This section of the publication is intended to build on this revisions paper.
Compilation of the Greenhouse Gas Inventory
The greenhouse gas inventory covers a wide variety of anthropogenic sources of greenhouse gas emissions. There is therefore a wide variety of emissions sources which require different approaches to their estimation. There are a large number of data sources used in its compilation, obtained from Government statistics, regulatory agencies, trade associations, individual companies, surveys and censuses. The methods used to compile the greenhouse gas inventory are consistent with international guidance on national inventory reporting from the Intergovernmental Panel on Climate Change.
Most emission estimates are compiled by combining activity data (such as fuel use) with a suitable emission factor (such as amount of CO2 emitted per unit of fuel used). Estimates of emissions from the industrial sector are often compiled based on plant-specific emissions data. Emissions from some sectors are based on more complicated models - such as the model used to estimate emissions from landfill, and the model used to estimate the carbon dynamics in soils when trees are planted. Much of the data on net emissions from ‘agriculture’ and ‘land use, land use change and forestry emissions’ are based on modelled data for Scotland, which are consistent with, but not constrained to, the UK totals and thus are known as “bottom up” estimates.
Many of the remaining emissions sources within the inventory have been collated on a “top down” approach where estimates of emissions have been apportioned to Scotland using proportions of energy use in the Department of Business, Energy and Industrial Strategy (BEIS) Publication “Digest of UK Energy Statistics (DUKES)”. This approach is prompted by data availability on emissions being more limited at the sub-UK level.
Impact of Revisions
Revisions between the 1990-2020 and 1990-2021 inventories
Charts 15 to 17 illustrate the impacts of revisions between the 1990-2020 and 1990-2021 inventories. This is followed by a discussion of the reasons for the key revisions.
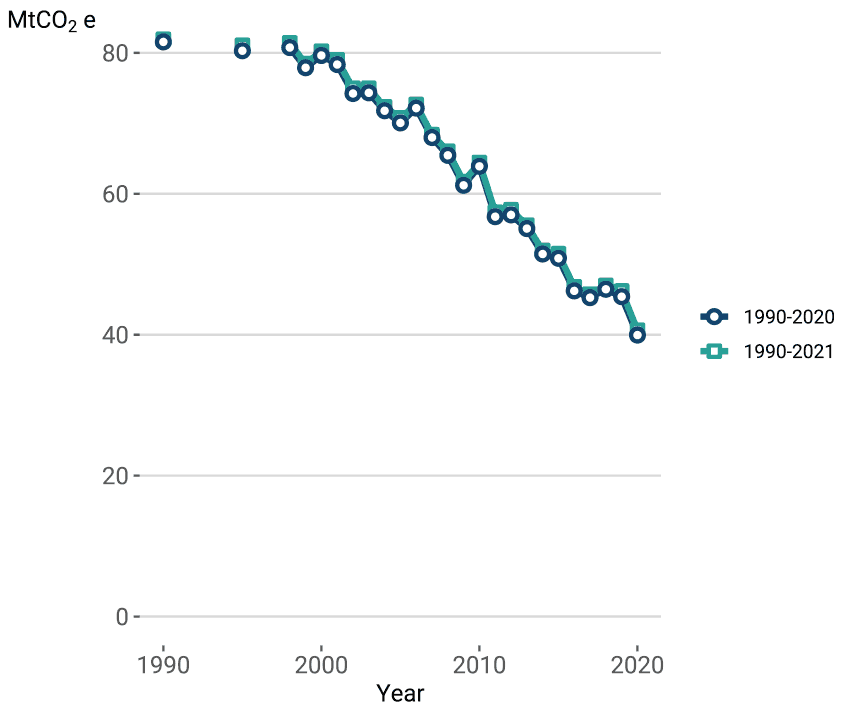
Chart 16 shows revisions to the baseline period, between the two most recent inventories.
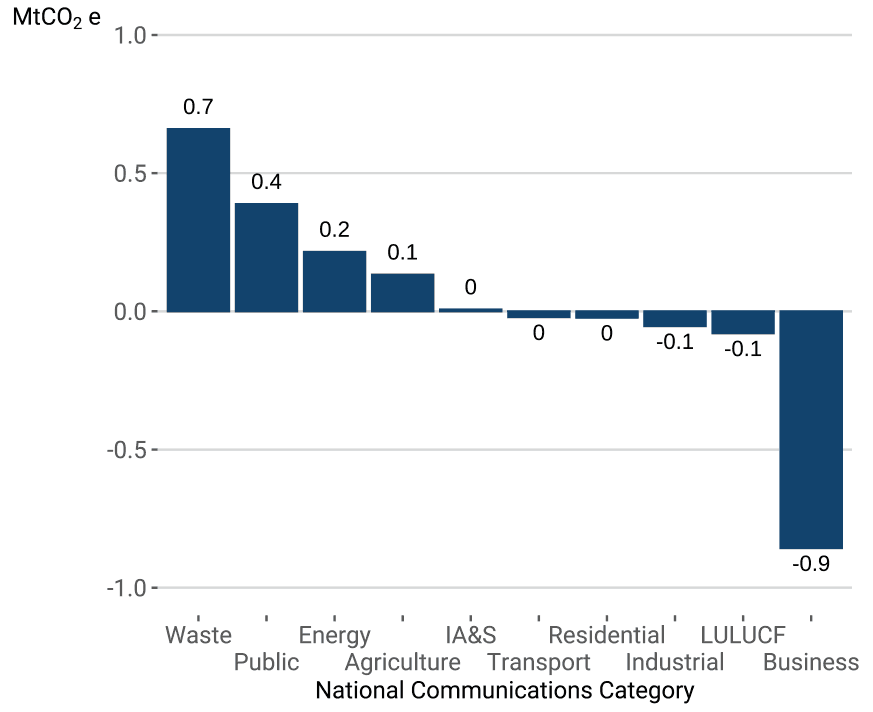
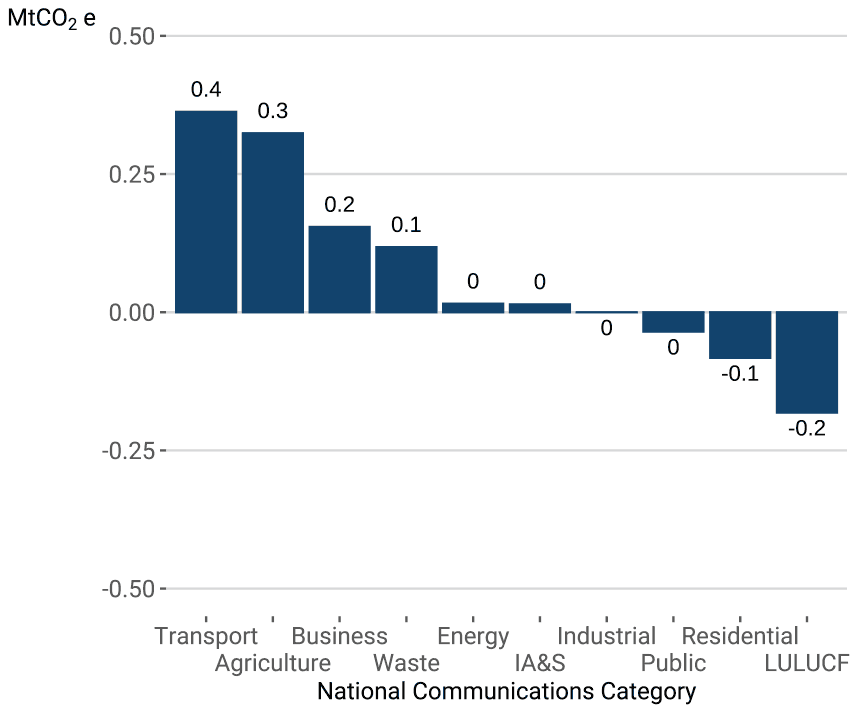
Chart 17 shows revisions to the data for the year 2020, between the two most recent inventories.
Details of Main Revisions and Interpretation of Revisions to the Inventory
Revisions to emission inventory estimates reflect the continuous development of scientific understanding of emissive processes, and the improvement to underlying data and methods to generate accurate emission estimates; few revisions to the Greenhouse Gas Inventories arise as a result of 'errors' in the popular sense of the word. The compilation of the inventory is governed by a rigorous quality assurance process and is subject to a great deal of third party scrutiny, such as annual reviews by the UNFCCC of the UK inventory.
The latest published Scotland greenhouse gas inventory (currently 1990-2021) represents the best available data at the time and these supersede any previous data, which should be disregarded.
A complete list of the revisions between the previous and latest inventories can be found in the National Atmospheric Emissions Inventory report Greenhouse Gas Inventories for England, Scotland, Wales and Northern Ireland: 1990 - 2021. Details of the most notable revisions are listed below:
Revised global warming potentials
Emissions are reported for the seven direct greenhouse gases, and these are listed in Table 1 alongside their Global Warming Potential (GWP). Depending on their molecular weights, radiative properties, and residence times in the atmosphere, each GHG has a different capacity to impact global warming. The GWP is an attempt to encapsulate these parameters and provide a consistent measure of the relative effects of the emissions of the relevant GHGs, through the units CO2 equivalent (CO2e). As gases have varying residence times in the atmosphere, the respective GWPs differ over different time-horizons are considered; GWPs of gases with shorter residence times than CO2 would increase if a shorter time-horizon is considered.
All figures are now reported using the Fifth Assessment Report (IPCC, 2014). The combined impact of this change has been a slight increase in emissions estimates.
LULUCF
Recalculations due to implementation of updated activity data used in LULUCF soils and non-biomass models.
Agriculture
There has been an increase in emissions from the agriculture sector across much of the time-series, with reasons for these recalculations including;
- Updated farm yard manure storage proportions for Scotland and proportion of cattle stored on slurry systems updated. Revisions to slaughter weight timeseries from 2018 and milk yield data in recent years which impacts the timeseries from 2011 due to interpolation. Revision to the methodology used to estimate fertiliser application rates. Revision to land use areas and crop yield.
- Integration of a new non-road mobile machinery model that causes major revisions to estimated emissions from agricultural machinery.
Energy supply
Recalculations are primarily due to revisions to DUKES data in later years and change in activity data for petroleum refining.
Business
There were large revisions to the UK inventory due to new bottom-up estimates of off-road machinery fuel use by machinery type, resulting in the reallocation of residual fuel use in other sectors.
Integration of new mapping grids for the use of fuels at industrial sites, particularly for gas oil, coal, fuel oil and natural gas use impacts emissions across the time-series.
Emissions for later years of the time-series were affected by recalculations in the DUKES activity data.
Transport
There were recalculations due to a revised DfT minor road data for 2000-2019 and a revision to the total gas use in road transport for later years.
Residential
Large recalculations in 2019 and 2020 due to revisions to the DUKES activity data.
Domestic combustion of natural gas was revised for 2019 and 2020 due to updates to the Carbon Emission Factors in the Local Distribution Zone (LDZ) data.
Minor recalculations throughout the time series due to revisions to the calorific values in the domestic combustion model.
Waste Management
Revisions to the UK total for municipal wastewater which is the scaled across all DAs as there has been no change to the methodology used to split emissions between DAs.
A decrease due to the removal of methane emissions associated with disposal to land, landfill, or incineration, to prevent double counting.
A decrease due to the revision to the approach of uplifting of wastewater to sea to be region-specific, and uplift to reach only 90% of the 'stable' level of sludge generation per capita.
Interpretation of uncertainties in the inventory
All estimates, by definition, are subject to a degree of statistical 'error' but in this context it relates to the uncertainty inherent in any process or calculation that uses sampling, estimation or modelling.
Estimates of greenhouse gases are compiled by a consortium of contractors. The source emissions are based upon a range of data sources, ranging from model based estimates to point source emission data. As a result, the estimates are subject to a degree of uncertainty. Full analyses of these uncertainties are provided on the National Atmospheric Emissions Inventory website[7].
The Scottish Government previously commissioned research to overhaul and update the uncertainties model used for the Scottish greenhouse gas inventory. A detailed study was carried out in parallel with the compilation with the 1990-2014 Scottish greenhouse gas inventory to review and improve the uncertainty calculations. A link to this project and to the full report can be found in the Scottish Greenhouse Gas Inventory Uncertainties Project.
Contact
Email: CCStatsModelling@gov.scot