Scottish Government bonds programme: outline business case summary
Summary of the outline business case we developed to assess the case for issuing Scottish Government bonds.
Annex
Capital Borrowing Policy
For capital expenditure the Scottish Government can borrow up to £450 million annually, and £3 billion cumulatively, in 2023-24 prices. This means for the purposes of the 2025-26 Scottish Budget the limits are calculated as £471.7 million and £3,144.5 million respectively.
Following the Fiscal Framework Review, the Scottish Government reviewed its capital borrowing policy to ensure the facility could continue to support the capital budget over the medium term in a fiscally sustainable way. In the Scottish Government Borrowing memorandum, published alongside the 2025-26 Scottish Budget, the following guidelines were adopted to assess any capital borrowing decision:
- Use £300 million of capital borrowing per annum as the default assumption;
- This will be amended as necessary to meet budget specific or in-year requirements; and
- Ensure, by way of a fiscal test, that at least £1.5 billion of capital borrowing headroom remains available for the subsequent parliamentary term.
Terms of borrowing, such as the tenor (the duration of the repayment period), will be determined when annual borrowing decisions are finalised and adjusted as necessary to ensure there remains sufficient headroom, as set out in the policy. This policy is reflected in funding assumptions for the forecast period as presented in Table 2.01. This capital borrowing policy will apply to all Scottish Government decisions on borrowing, irrespective of the source of borrowing.
Borrowing Forecasts
- The latest Scottish Government capital borrowing forecast (see Table A1) – published in the Fiscal Framework Outturn Report 2025[10] – assumes continued use of the existing National Loans Fund structures as the source of borrowing, this will continue to be the case until any changes to borrowing sources or structures are certain to occur.
- For these reasons, regular repayment of principal repayments will continue to be included in the resource cost of borrowing and reflected in budget and spending review forecasts.
- Inflationary uplifts are calculated on the basis of UK GDP deflators published by the OBR (March 2025) and applied to the 2023-24 baseline limits in line with the revised Fiscal Framework Agreement.
- Interest rate assumptions use Gilt curves (09/09/2025) adjusted for National Loans Fund annuity structures. A further premium of 50 basis points is added for prudence to reflect the volatility in both forward rates, and the feasible differential between date of request of funds and date of receipt when interest rates are applied.
| £ million | 2020-21 | 2021-22 | 2022-23 | 2023-24 | 2024-25 | 2025-26 | 2026-27 | 2027-28 | 2028-29 | 2029-30 | 2030-31 |
|---|---|---|---|---|---|---|---|---|---|---|---|
| Debt Stock at start of Year | 1,617 | 1,744 | 1,814 | 2,026 | 2,227 | 2,245 | 2,576 | 2,716 | 2,835 | 2,937 | 3,033 |
| New Borrowing in year (incurred) | 200 | 150 | 300 | 300 | 139 | - | - | - | - | - | - |
| New Borrowing in year (forecast) | - | - | - | - | - | 472 | 300 | 300 | 300 | 300 | 300 |
| Principal Repayments | 52 | 60 | 67 | 79 | 100 | 120 | 129 | 132 | 135 | 125 | 115 |
| Interest Repayments | 13 | 14 | 16 | 24 | 34 | 39 | 37 | 34 | 31 | 28 | 25 |
| Resource Cost of Borrowing Incurred | 64 | 74 | 83 | 103 | 135 | 160 | 166 | 166 | 166 | 153 | 140 |
| Principal Repayments | - | - | - | - | - | - | 11 | 28 | 43 | 58 | 74 |
| Interest Repayments | - | - | - | - | - | - | 22 | 38 | 54 | 70 | 85 |
| Resource Cost of Forecast Borrowing | - | - | - | - | - | - | 32 | 67 | 97 | 128 | 159 |
| Projected Total Resource Cost | 64 | 74 | 83 | 103 | 135 | 160 | 198 | 233 | 263 | 281 | 299 |
| Notional Borrowing Repayments | 21 | 21 | 21 | 21 | 21 | 21 | 21 | 21 | 21 | 21 | 21 |
| Debt Stock at end of Year | 1,744 | 1,814 | 2,026 | 2,227 | 2,245 | 2,576 | 2,716 | 2,835 | 2,937 | 3,033 | 3,123 |
| Debt Cap | 3,000 | 3,000 | 3,000 | 3,000 | 3,050 | 3,145 | 3,249 | 3,316 | 3,380 | 3,444 | 3,513 |
| Percentage of Debt Cap | 58% | 60% | 68% | 74% | 74% | 82% | 84% | 86% | 87% | 88% | 89% |
| Headroom | 1,256 | 1,186 | 974 | 773 | 805 | 569 | 533 | 480 | 443 | 411 | 389 |
Business Case Scenarios - Headroom and Cost Profile
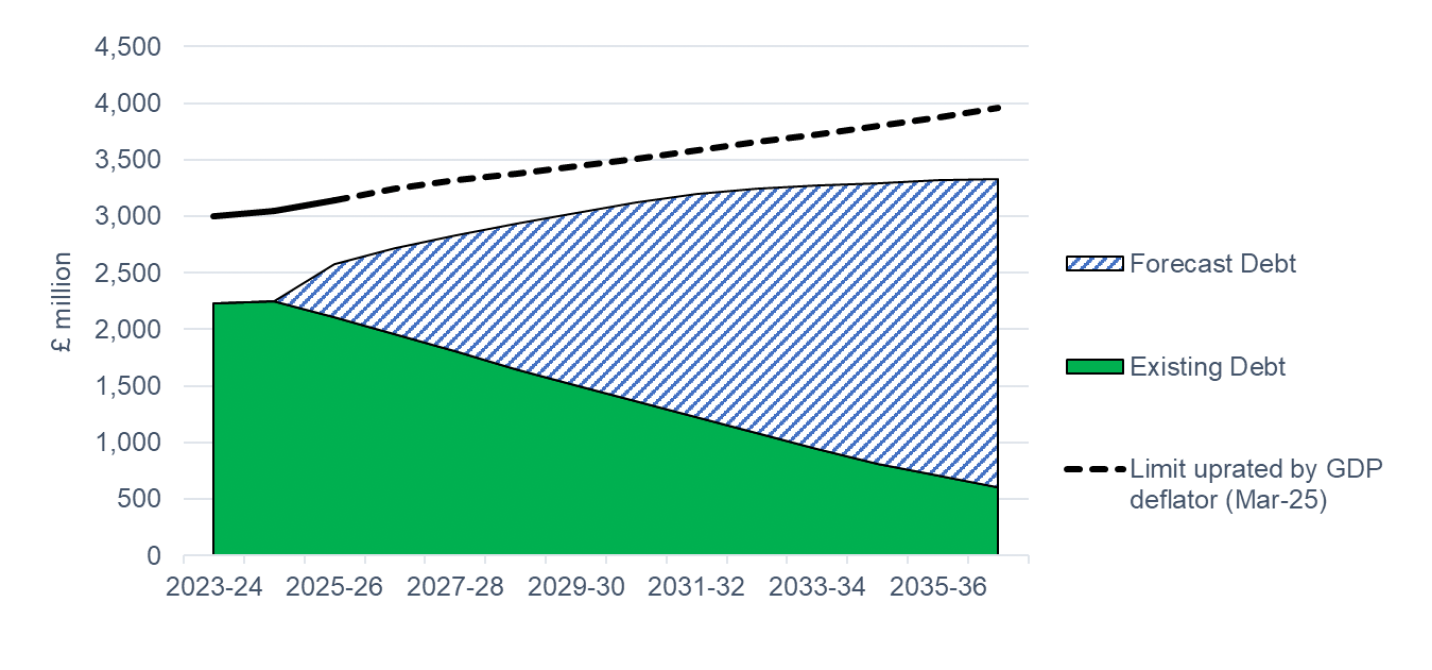
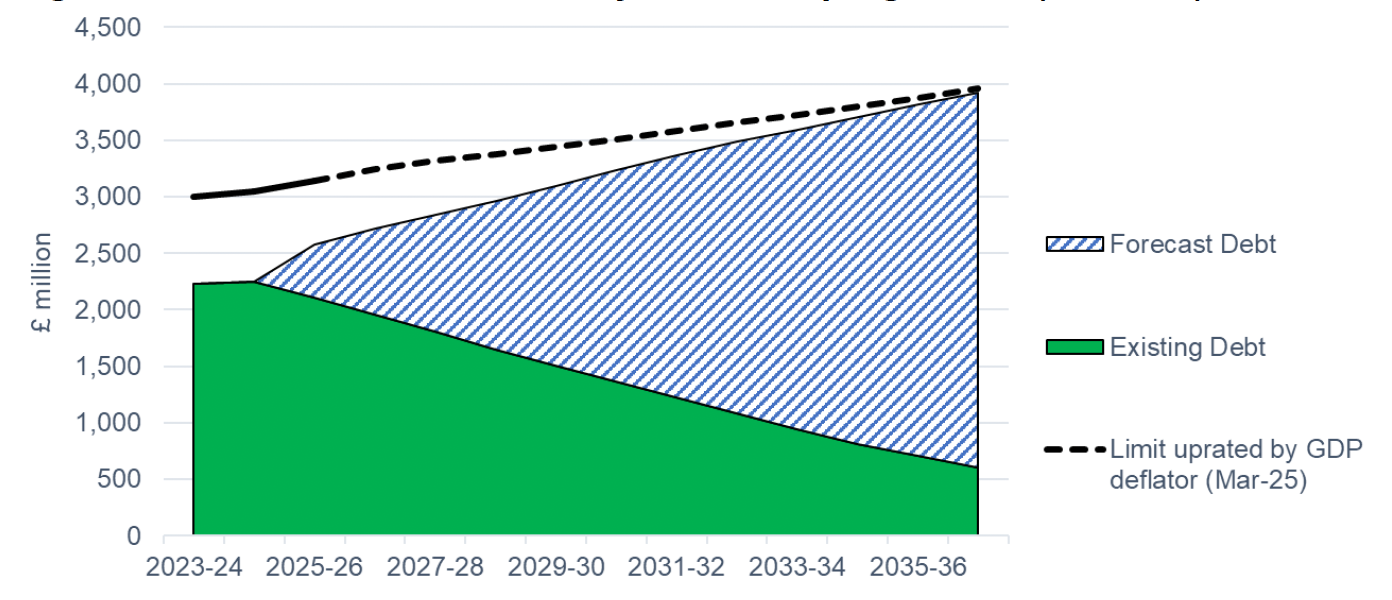
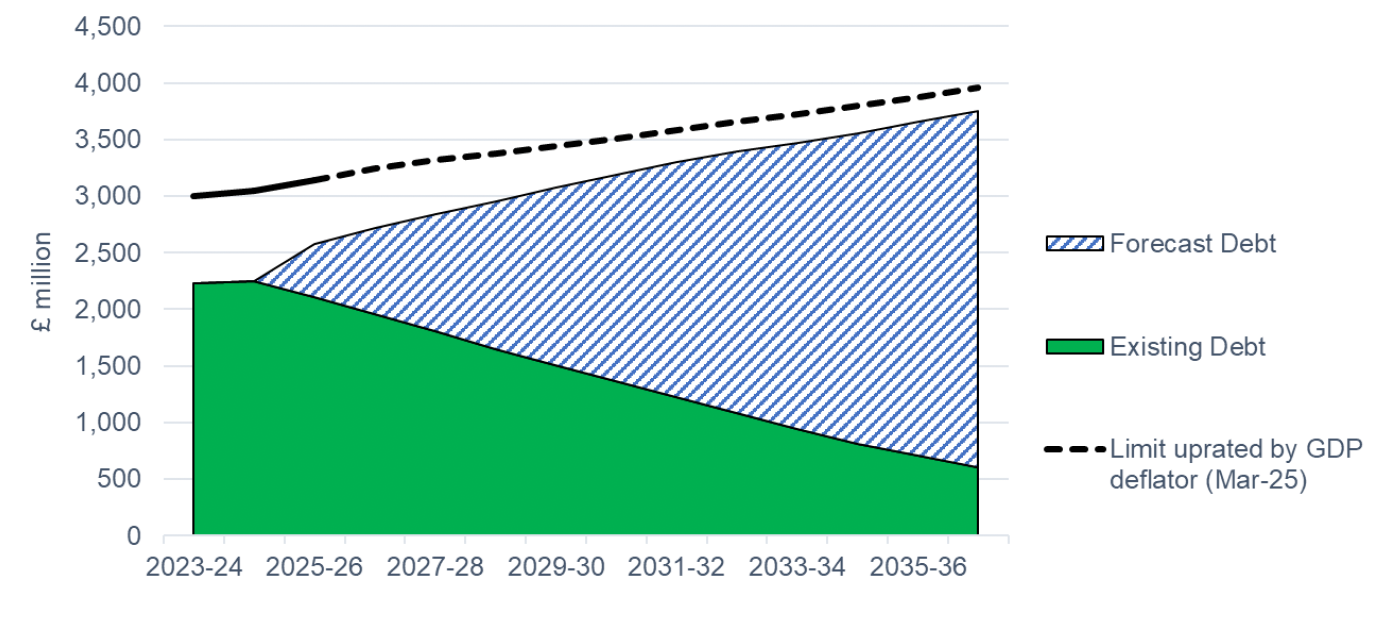
- Figures A2, A4, and A6 show the profile of existing borrowing and the forecast for new borrowing under the capital headroom limit, which is calculated using GDP deflators published by HM Treasury (30/06/2025). The forecast for new borrowing aligns with the values in Table A1 and assumes £300 million of borrowing per annum in all future years with a 15-year tenor. For Figures A4 and A6, bond issuances are aligned with scenarios C and D in the OBC.
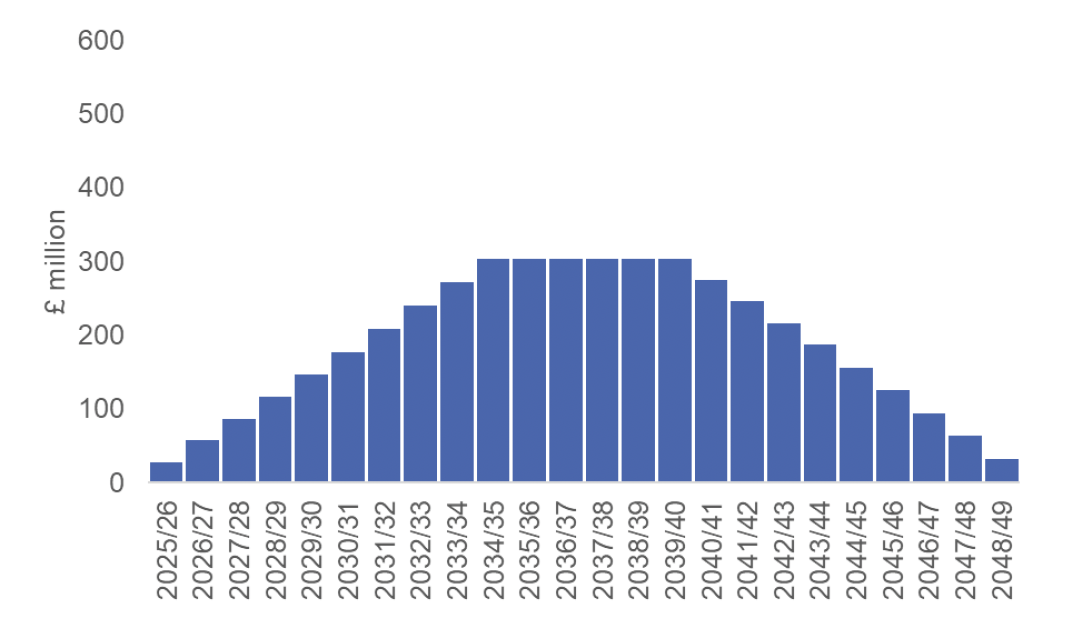
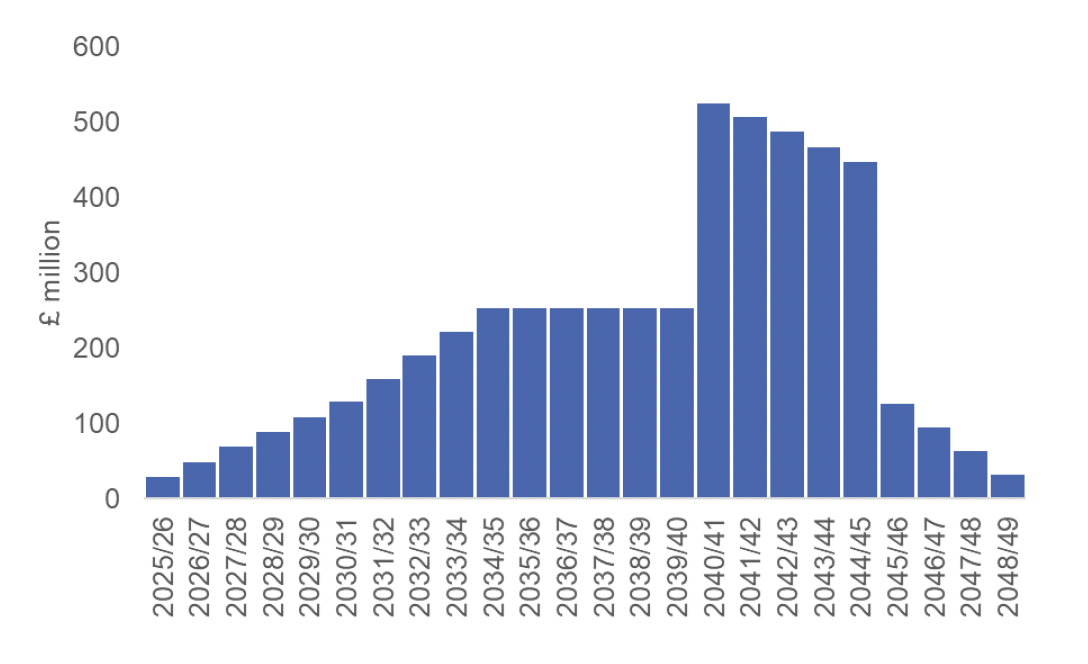
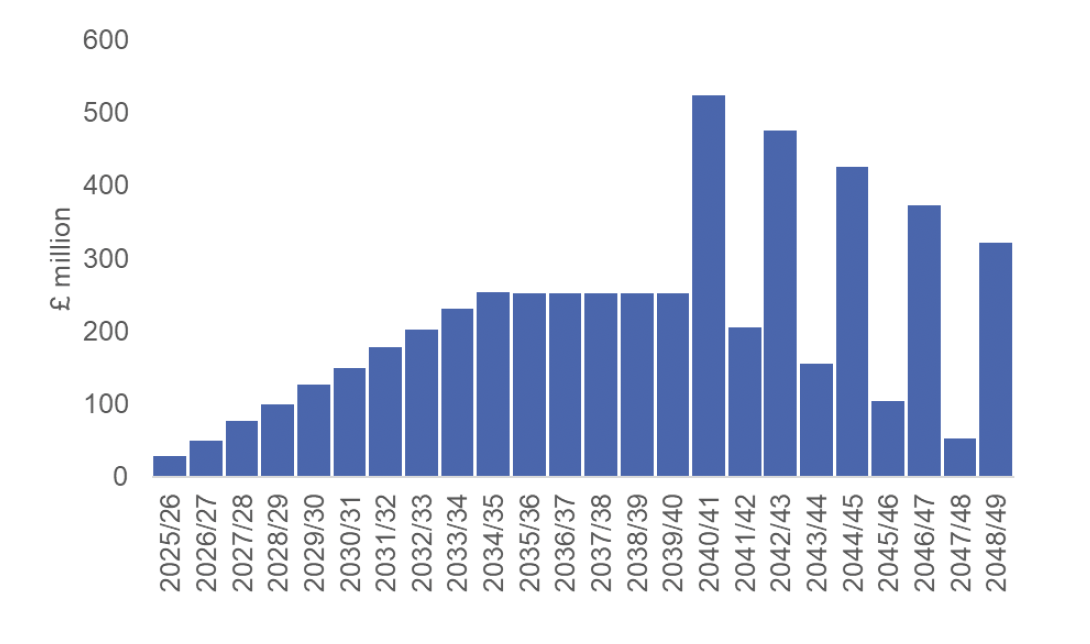
- Figures A3, A5 and A7 are informed by the analysis of costs associated with future borrowing and cover only the period of bond issuances and NLF loans over a ten-year period, as selected for the OBC. The costs presented in these figures reflect one of the scenarios from the range presented in Figures 2 and 3 of the summary document and do not provide an indication of expected costs.
- While the OBC analysis focuses on evaluating scenarios for future borrowing to assess trade-offs between different options, the broader fiscal headroom analysis must also consider the existing stock of debt and how it will evolve over longer horizons.
- The terms of borrowing such as tenors, amounts and timing, can be determined each year, within the Government’s Borrowing Policy, whereas options and costs presented in the OBC are kept relatively simple to provide an illustration of potential costs and benefits.
Contact
Email: OCEABusiness@gov.scot