Health screening: equity in screening strategy 2023 to 2026
The Scottish equity in screening strategy tackles inequalities within the screening programmes.
Understanding inequalities in screening
Health inequalities
Health inequalities are the observable differences in the health of individuals or groups within a population. Some people use 'inequalities' to signify differences between groups and 'inequities' to signify unjust differences between groups. 'Inequality' is the more commonly used term and has been adopted throughout the strategy to mean unfair, and avoidable, systematic differences in health or health access between groups.
In the Scottish screening programmes, we want to achieve equity of opportunity to access screening, and equal benefit from screening for all eligible individuals.
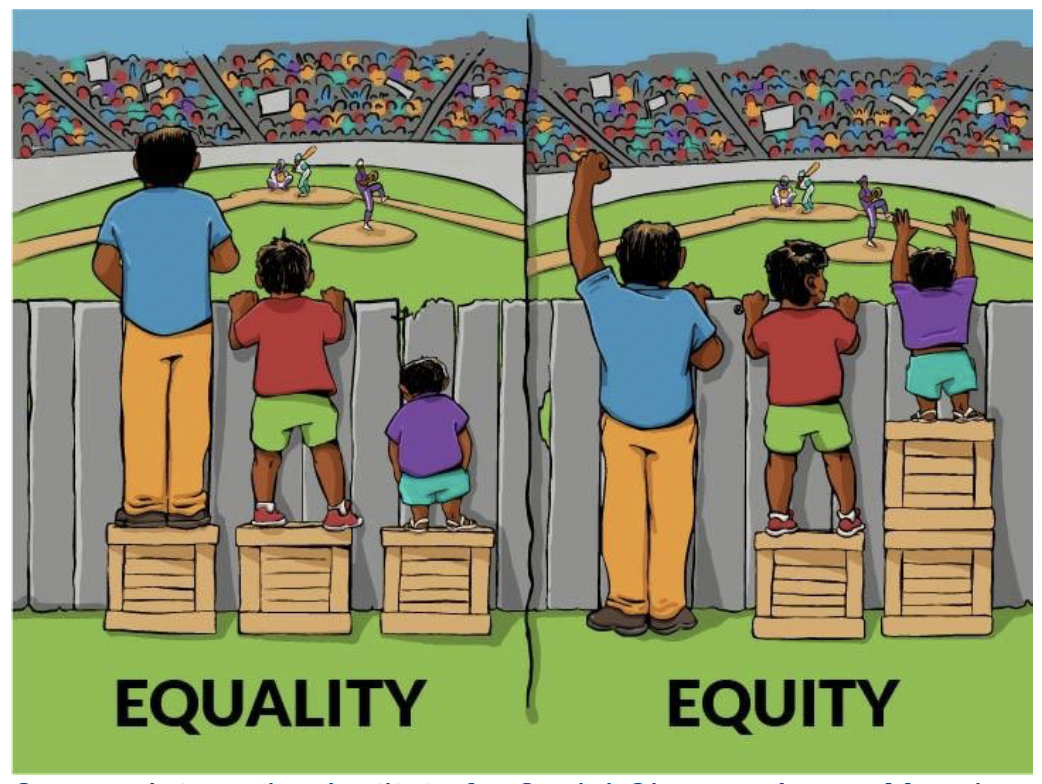
Source: Interaction Institute for Social Change: Angus Maguire
The existence of health inequalities in Scotland means that not everyone enjoys an equally high standard of physical and mental health. This is clearly demonstrated by differences in life expectancy for example. People's physical and mental health is influenced by factors such as housing, education, employment, and income. Systematic variation in these factors forms social inequalities, which are drivers of health inequalities. These factors are largely beyond an individual's control, yet they can lead to disadvantage, and limit some people's chance to live longer and healthier lives. Health inequalities are unfair and avoidable.
A 2022 review by The Health Foundation[2] reported improvements in life expectancy, and inequality, in Scotland through the 2000s. A period of stagnation then follows through the 2010s, and inequality in life expectancy widens.
Average life expectancy in Scotland is significantly lower compared to other parts of the UK and Western Europe[3]. Furthermore, people in the most affluent areas in Scotland experience more years of good health than those in the poorest areas. Men in the most affluent areas experience 23.8 more years of good health, and women experience 22.6 more years[3]
Health inequalities are complex, persistent, and deeply entrenched in our society. They are not inevitable and can be addressed through societal and political actions across all the social factors that shape health and wellbeing. Addressing the fundamental causes of health inequalities – the unequal distribution in society of income, wealth, and power[4] - is outwith the scope of the strategy. We can however address inequalities in access to and experience of the screening pathway.
Under-served groups
Health inequalities are experienced by a range of groups. Throughout the strategy we refer to 'under-served'[5] groups of people. By this, we mean people who experience social inequality, stigma, discrimination, or a lack of opportunity, which makes it difficult for them to make an informed choice or to access screening. Often, people fall into more than one under-served group at the same time.
Under-served groups may find that communication of the benefits and harms of screening do not meet their individual needs. They may experience barriers which make it more difficult to access screening and diagnostic services or to benefit from the later treatment pathway.
Examples of those groups identified as under-served include those living with severe mental illness, people with learning disabilities, those experiencing homelessness, in prison or institutions, asylum seekers and refugees or those from gypsy and traveller groups. And, more broadly, people living in socioeconomic deprivation. The more disadvantaged an individual's social position, the worse their health. This is known as the social gradient in health[6].
Under-served groups also include people who share one or more of the nine protected characteristics of the Equality Act 2010[7].
- Age
- Disability
- Gender reassignment
- Pregnancy and maternity
- Race
- Religion or belief
- Sex
- Sexual orientation
- Marriage and civil partnership.
Lower uptake of screening by a population sub-group, including those listed above, may increase inequalities. If any one sub-group is less likely to engage with the full screening pathway, this could lead to differences in health status between different groups.
Public bodies have a legal requirement to protect individuals from discrimination and unfair treatment and promote fair and equal access and opportunities. We must minimise the barriers and ease access for under-served groups in screening.
Inequalities in the Scottish screening programmes
National screening programmes aim to identify and invite all eligible people to engage in the same high-quality pathway. Screening standards outline a national minimum level of service to deliver person-centred, safe, and effective care. Some aspects of the current screening standards incorporate addressing inequalities. We know however, that some individuals and groups may still experience additional barriers, which can result in inequalities in access and outcomes.
There are complex reasons why people do not engage in screening. These can also vary between and within different individuals and groups. People can experience barriers at any point in the pathway and may do so more than once.
Research provides some insight into the barriers to screening[8]. Where and how screening is delivered can be a barrier. Service level barriers include resource and capacity issues and the knowledge and skills of the screening workforce. The way screening is delivered can also create barriers for people with different needs, where the system does not meet these. Individual level barriers include limited fluency in English, cultural beliefs, anxiety surrounding the process and result, perceptions about eligibility, previous experience of the health system, and transport costs. Physical and learning disabilities, age and severe mental illness are other examples of barriers people may face.
Data shows that the offer of screening is not taken up equally by all people in Scotland. Those with a higher chance of developing a condition are often less likely to engage in screening[9]. For example, those living in more deprived areas, those living with a physical or learning disability, those from Black, Asian, or other minority ethnic groups, and men are less likely to take up an offer of screening. The uptake of screening varies both within and between each screening programme. We also know that some people are less likely to complete the screening pathway or engage in treatment after the initial screening test, but we do not understand why. These gaps in the data and research need to be addressed to help us better understand who is most at risk of experiencing inequalities in screening and how to implement evidence-based interventions and actions to best address these.
Our knowledge of inequalities in screening continues to develop. The more we understand, the better we can improve access across the pathway for everyone.
The COVID-19 pandemic will likely have exacerbated existing screening inequalities[10]. Due to limited collection of screening inequalities data however, the impact of the pandemic on inequalities in the Scottish screening programmes is largely unknown at this point. More broadly, the effect of the pandemic on inequalities was significant and the impact was unevenly spread across society[11]. Delivery of the Scottish screening programmes was significantly impacted. As, in response to the pandemic, Scottish Government paused all screening programmes, except for Pregnancy and Newborn, on the 30th of March 2020. Service delivery resumed between June and October 2020 and varied between programmes.
Data gaps
At a national level, there is a significant gap with regards to inequalities data for the pregnancy and Newborn screening programmes. Data is not available at a national level for all components of the programme and therefore no national reports are produced to identify and monitor inequalities. Some inequalities data is available at NHS Board level, although there is a lack of clarity regarding what data is available across all NHS Boards.
For DES, key performance indicator (KPI) reports have not been available since 2019, due to IT system challenges. This has resulted in a gap in knowledge of recent inequalities data and trends. Provisional data is now available for 2021-2022, although the report is still being refined to reflect the change in screening interval from 1 to 2 years for low-risk participants. In the absence of validated data this has not included in the Strategy. The Diabetic Eye Screening (DES) IT system has a live feed from the clinical management system SCI Diabetes where information such as ethnicity is recorded. This allows uptake by ethnicity to be examined, although consistency and accuracy of capturing and reporting ethnicity data can be problematic.
For the remaining screening programmes, analysis of screening uptake at a national level is only possible for age, sex, and deprivation. Although some NHS Boards have managed to obtain richer data, data intelligence on other characteristics, e.g., ethnicity, language, disability, or homelessness, this is limited and is mostly unavailable.
Inequalities can occur at any point along the screening pathway. There is a significant gap in analysing data for inequalities beyond initial uptake, with very limited knowledge of data collection, access or reporting at these later points.
These data gaps mean we are unable to quantify the full extent of screening inequalities that exist across the Scottish screening programmes.
Inequalities in uptake of screening
Uptake of screening is one indicator of performance of the national screening programmes. Differences in uptake are observed across the programmes[12],[13],[14],[15].
Uptake by deprivation
People living in the more deprived areas in Scotland are less likely to participate in screening (Figure 2), which can contribute to board-level differences in uptake. The inequality gap in uptake from the least deprived areas to the most deprived areas is 16.5% in AAA screening, 20.9% in bowel screening, 18.8% in breast screening and 10.6% in cervical screening[12],[13],[14],[15].
In cervical screening, women aged 50-64 years have a greater difference in uptake by deprivation than any other age group (15.7% between the least and most deprived compared with 6.8% in women aged 25–49-years).
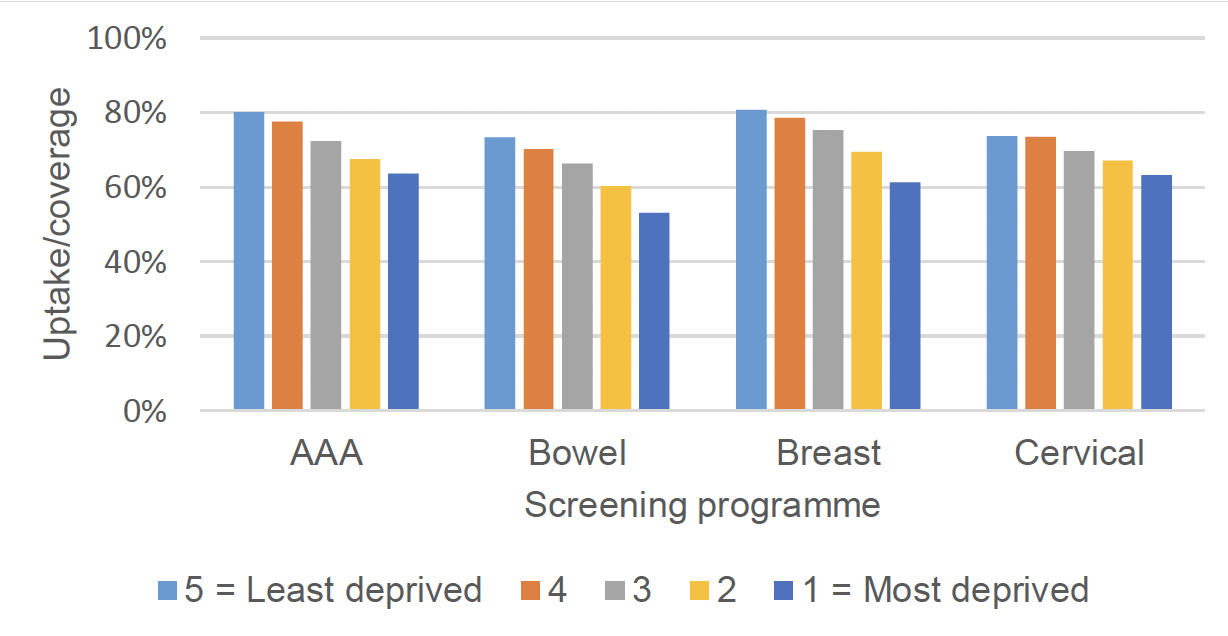
Source: Public Health Scotland, latest publication
Screening test positivity by deprivation
Differences in positive screen results are observed by deprivation. For example, in AAA screening, men from the most deprived areas have a higher rate of positive results (1.8%) compared to men from the least deprived areas (0.9%), although they are less likely to participate in screening. Bowel screening exhibits a similar trend, with analysis undertaken at the introduction of FIT screening showing a positivity of 4.3% in the most deprived and 2.4% in the least deprived quintile[16].
Following a positive screen result, individuals will be offered diagnostic tests to confirm if they have the condition for which they are being screened. Our understanding of inequalities at later points in the screening and treatment pathways is more limited than for uptake. Despite this we know that inequalities exist. For example, in bowel screening, analysis of programme data shows that, in those with a positive test, those from the most deprived quintile are 8 percentage points less likely than those from the least deprived to attend for colonoscopy[13]
Uptake by sex [17]
Bowel screening invites both men and women participants. Differences in uptake are observed between sexes, with men having a lower uptake of bowel screening (64.3%) compared with women (69.1%)[13].
Differences in sex also exist later in the bowel screening pathway[13], with women slightly less likely to attend for colonoscopy than men despite being more likely to return a test kit initially (73.9% in women vs. 75.0% in men). Women are also less likely to have their screening colonoscopy completed according to programme data (91.9% vs. 95.7% in men). Published evidence from England[18] also shows that women are more likely to have a cancer detected following a negative colonoscopy (a post-colonoscopy cancer) across all referral pathways.
Uptake by age
The eligible population is invited for breast-, bowel-, cervical-, and diabetic eye-screening repeatedly over a defined time period and interval. Uptake of each programme is observed to vary by age group, with younger age groups less likely to participate in screening than older age groups.
Uptake of cervical screening is lowest in women aged 25-29 years (55.4%) and highest in 50–54-year-olds (78.8%)[15]. Uptake of breast screening also increases with age and previous engagement, with those in their first screening round (aged 50-52) having uptake of 76.2%, and those in a subsequent screening round having uptake of 89.2%[19]. Bowel screening exhibits a similar trend, with analysis undertaken at the introduction of FIT screening showing uptake of 57.5% in the 50-54 age group and 71.3% in those aged 65-69[16].
Recent, validated uptake data for the Scottish diabetic eye screening programme is not currently available. UK evidence, however, shows attendance of diabetic eye screening is consistently low in young adults aged 18 to 34 years[20].
Uptake by other groups
We know from the literature that numerous other groups are more likely to experience inequalities in screening. These include:
- certain ethnic groups[21]
- People with physical disabilities
- People with learning disabilities[23]
- transgender people
- people with severe mental illness[24]
- people in long term care[25].
National data within the Scottish screening programmes is limited mainly to uptake by age, sex, and socioeconomic status. Data on the above under-served groups is not currently collected at a national screening level. UK evidence and data from England's population screening programmes provide some insight on screening inequalities for certain under-served groups, as shown by the following examples.
- Ethnic minority women are more likely to book late for antenatal care and engage less with screening[22]
- Uptake of breast screening is lower in women with a learning disability compared to the general population[23]
- People with severe mental illness (SMI) are 20% more likely not to have participated in cervical screening[24]
- Women in prison are less likely to have had cervical screening[25].
Inequalities in cancer incidence and mortality
A deprivation gradient exists for bowel, breast and cervical cancer incidence and mortality. When adjusting for age and sex (where appropriate):
For bowel cancer, incidence[26] is 14% higher and mortality[27] 36% higher in the most deprived vs. the least deprived quintile. Similarly, for cervical cancer, incidence is more than double and mortality more than three times higher in the most deprived vs. the least deprived quintile. Conversely, breast cancer incidence is 7% lower in the most deprived group, though mortality is 14% higher[26],[27].
Bowel cancer incidence in men is also around 45% higher than women and mortality is around 50% higher.
Contact
Email: screening@gov.scot