Scottish Civil Estate: efficiency and sustainability report 2020 to 2021
Scottish Ministers are required to lay before the Scottish Parliament this annual report which uses key performance indicators to assess progress in improving the efficiency and sustainability of the Scottish Civil Estate.
4. Efficiency and Sustainability 2020-21
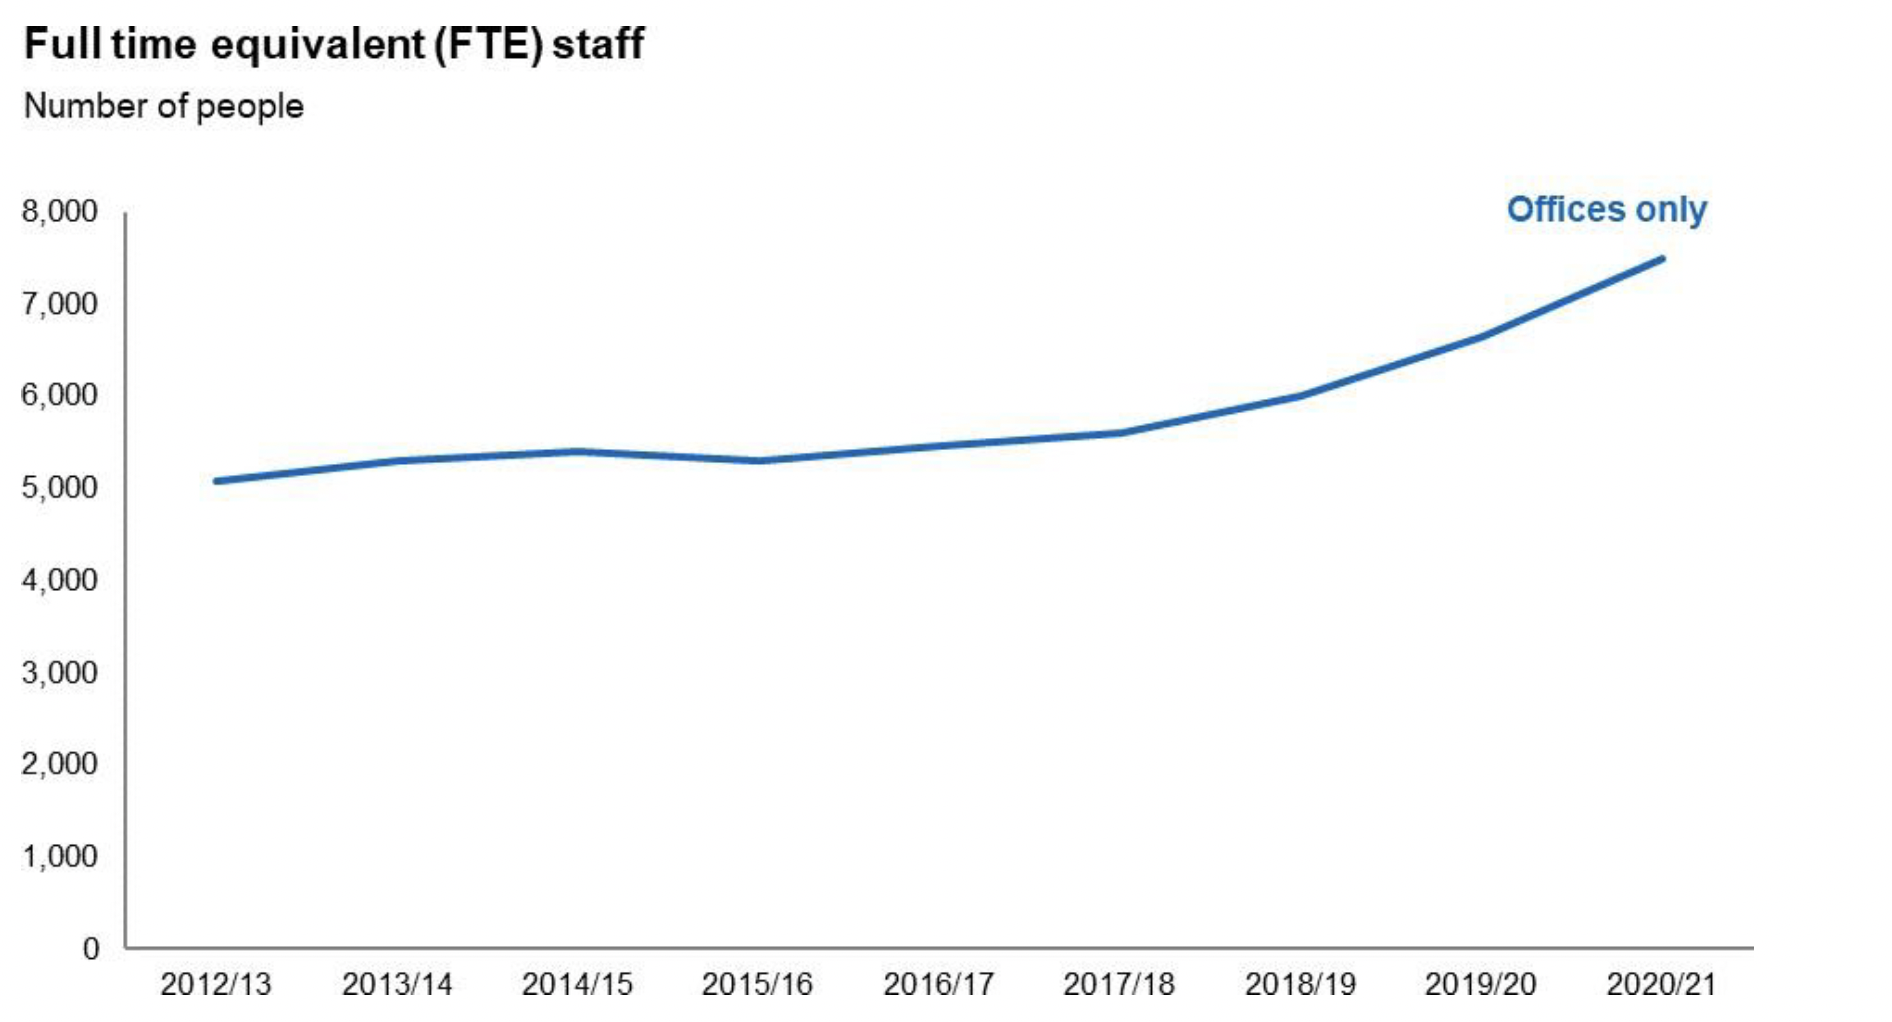
The basis of the full time equivalent count has been revised from 2014-15 onwards which affects comparisons with previous years' data. The increase shown over 2020-21 is a result of the addition of Social Security Scotland staff numbers in their property in High Street, Glasgow, as well as a slight growth in Scottish Government core numbers.
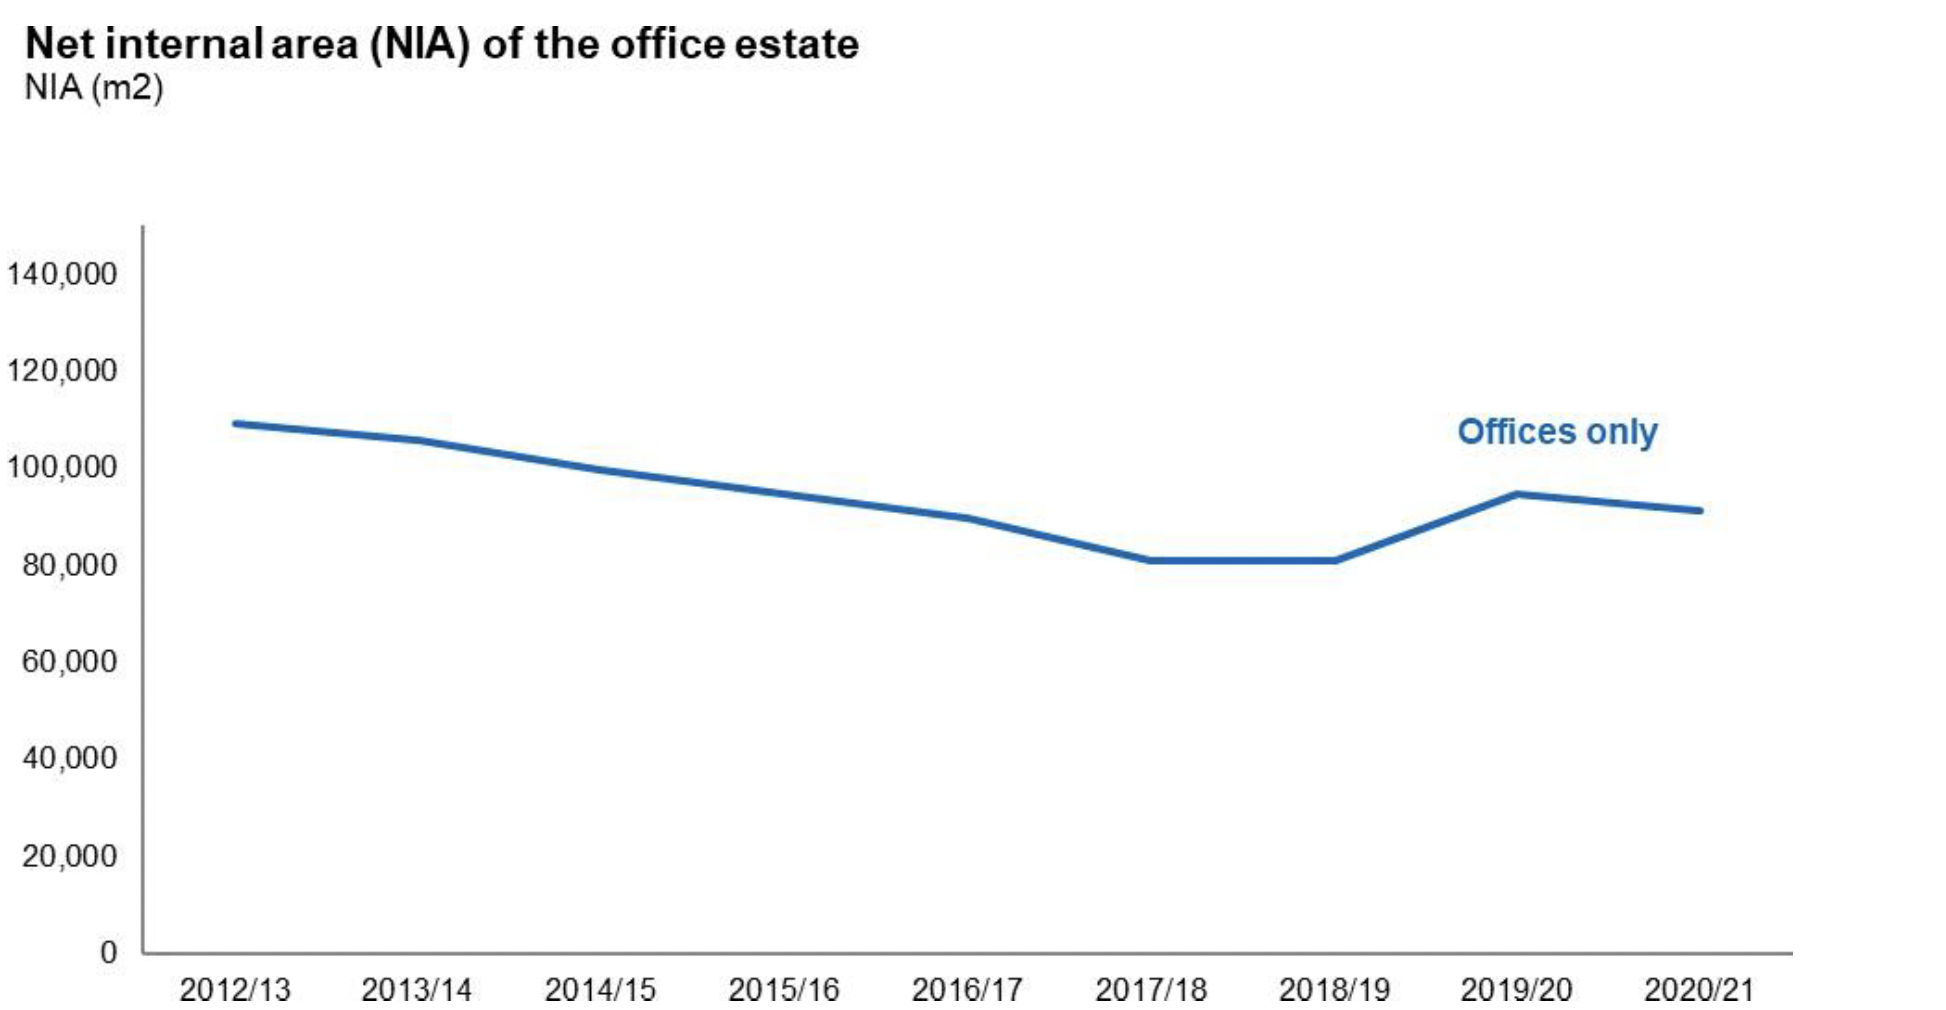
There has been little change in the underlying total net internal area in this reporting period3.
3 See section 3.5 'The Organisation Context' on page 6.
4.1 Property Costs of the Office Estate
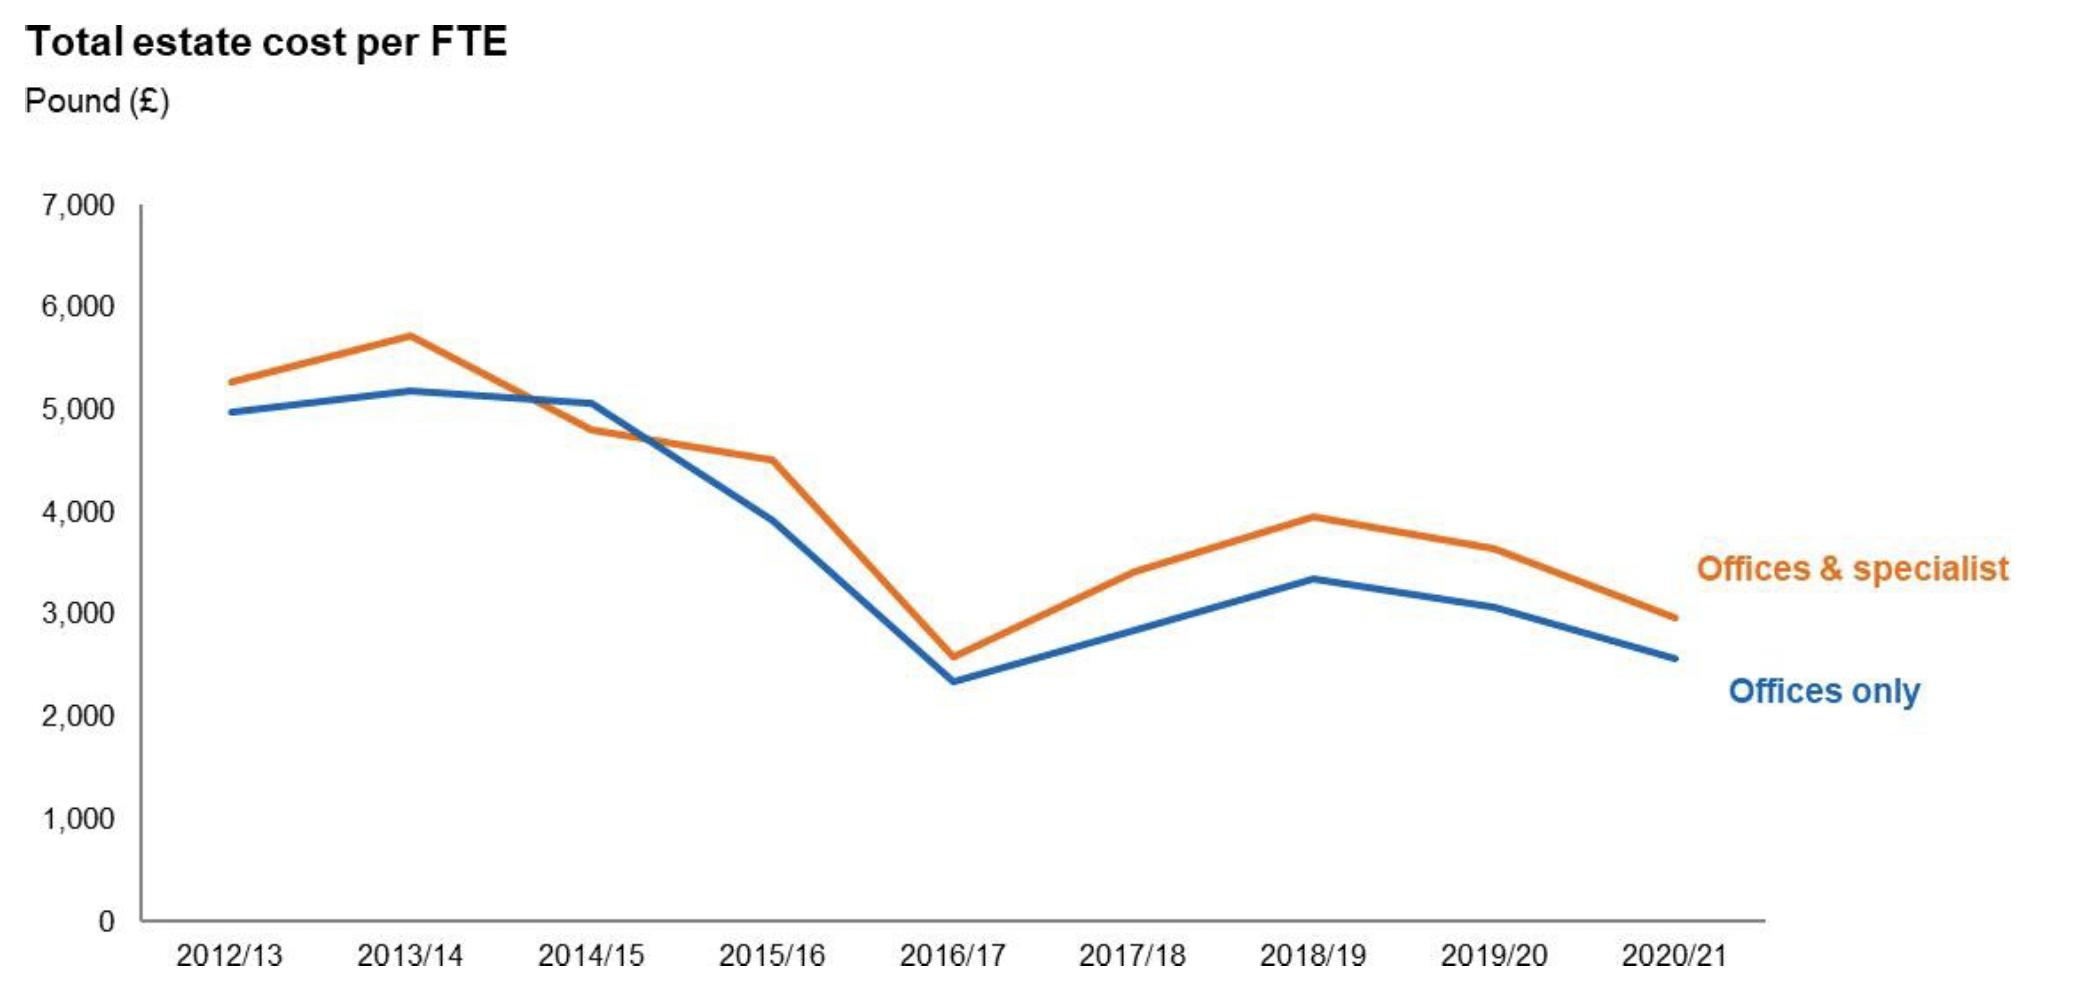
Total Estate Cost includes rent, rates and a wide range of other costs of occupation including repairs and maintenance, service charges, water and sewerage, security and cleaning.
There was a significant reduction in total cost per FTE between 2014-15 and 2016-17, which is a reflection of the reduction in floor space retained overall. The increases in total costs in 2017-18 and 2018-19 reflect investment in modernising current offices to optimise use of space.
The data this year shows a decrease due to reduced costs while offices were mostly closed during covid-19 restrictions.
4.2 Property Costs on the Combined Office and Non-Office Specialist Estate
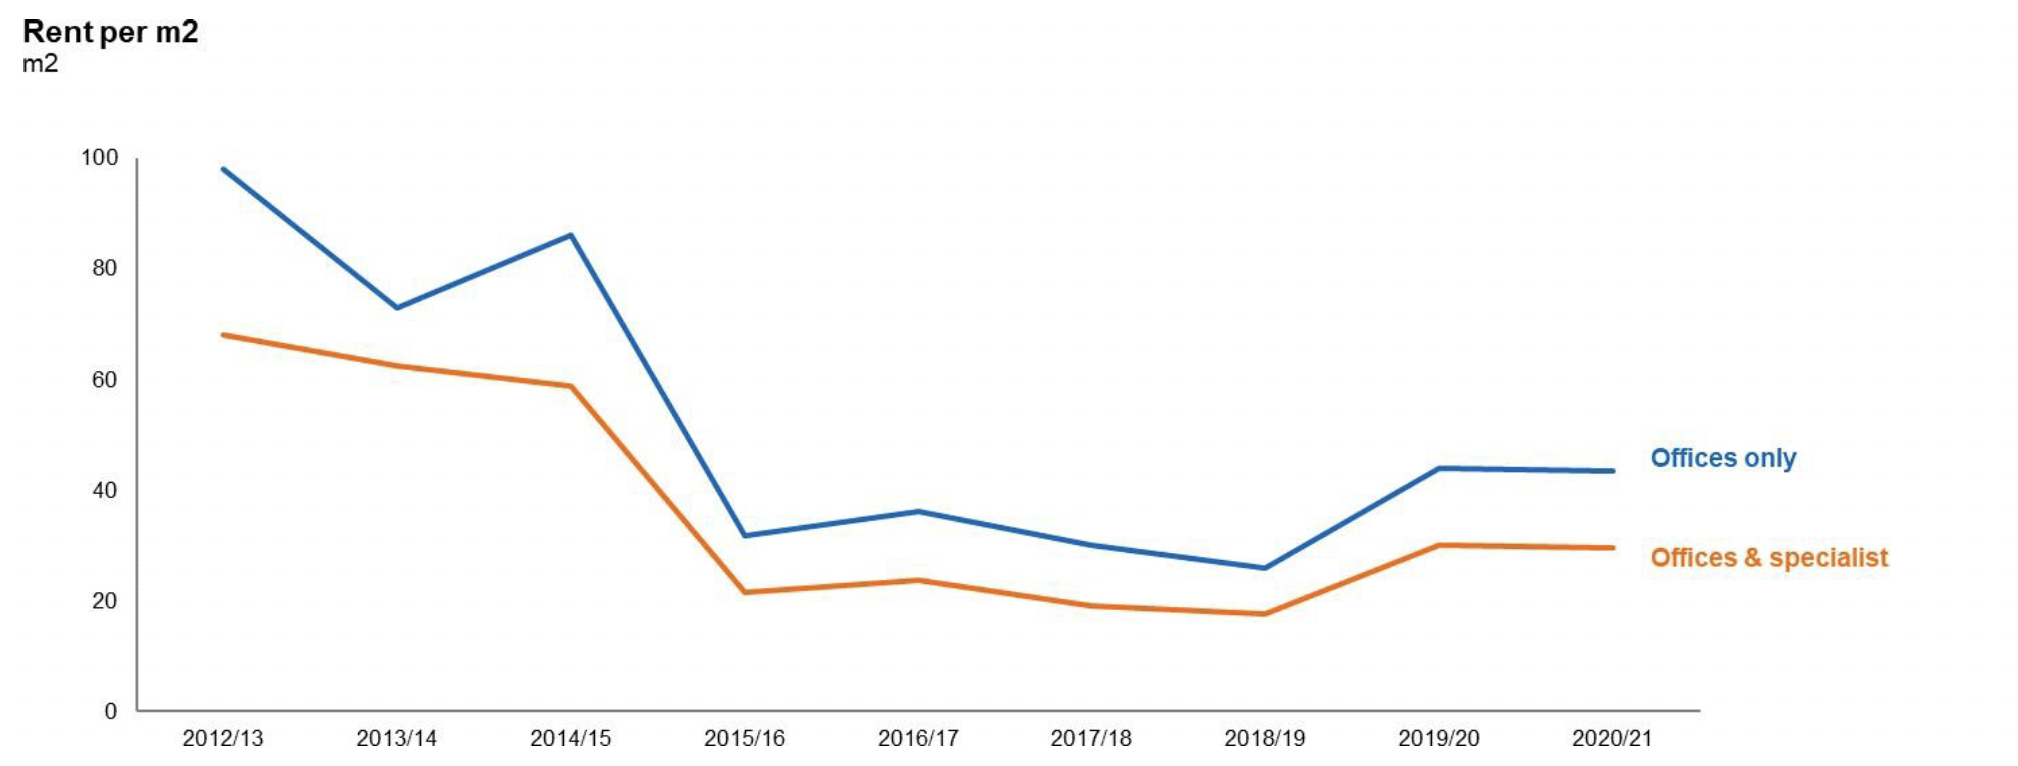
One of the factors affecting the total estate cost is rental levels. Property managers in the civil estate negotiate robustly with landlords at rent review, but some managers are faced with a lease that has either upwards only reviews of rent, or has index-linked increases built in, all of which preclude the ability to make reductions. As the market for offices is reinvigorated, demand has risen and the supply of vacant space fallen, so asset managers, including those in the public sector, have increasingly been working in an environment of declining incentives and rising rents.
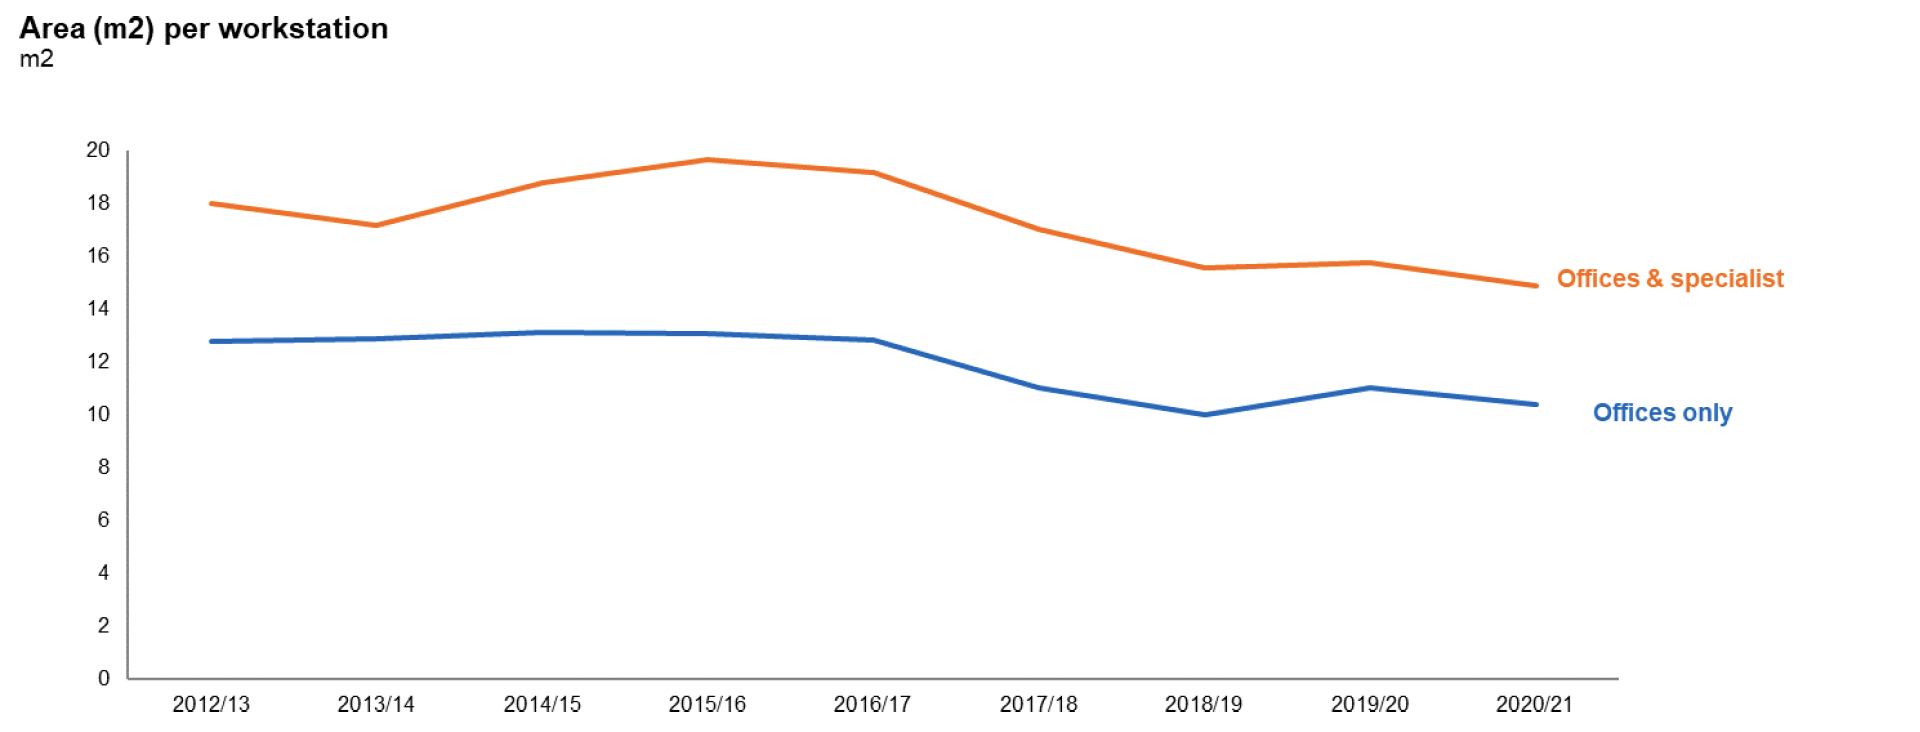
4.3 Use of Occupied Space
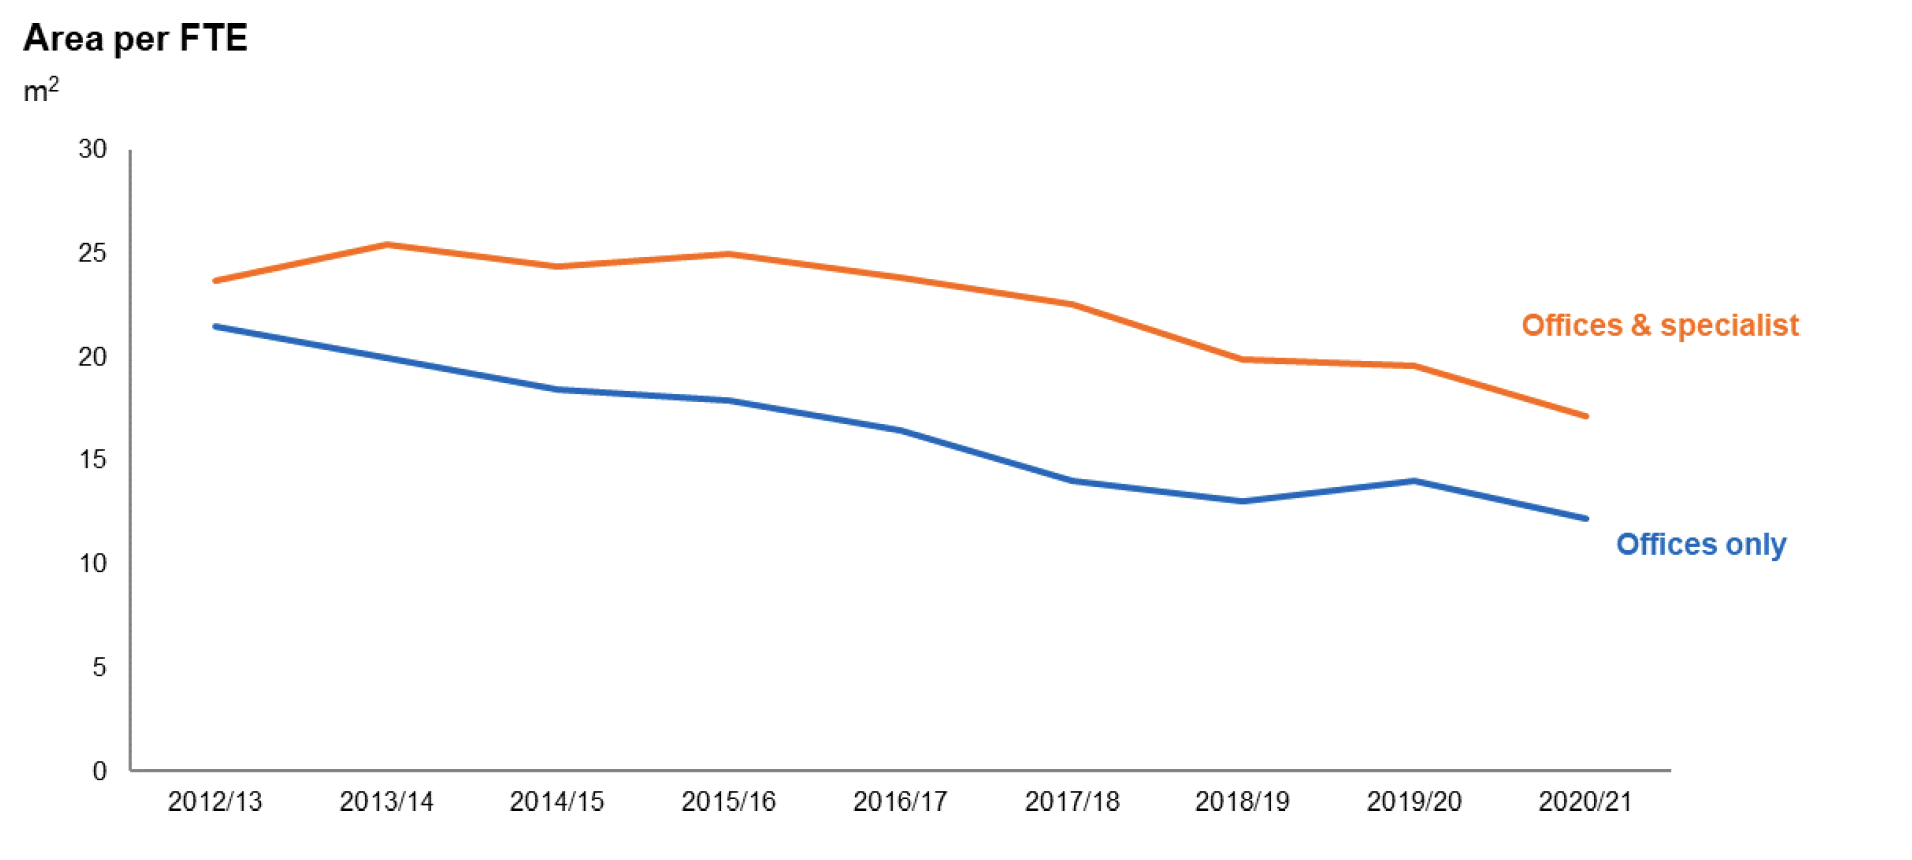
The part of the Scottish Civil Estate occupied by the core Scottish Government has embedded smarter working principles to make more efficient use of many offices. Many Executive Agencies are being supported to develop their estate strategy in this way also. By December 2016 these disposals at lease expiry and co-locations enabled a reduction of both 25% in cost and size of the estate with efficiency gains of at least £5.5 million per annum. Application of the same principles across the wider estate yielded efficiency gains of £29.1 million per annum by March 2018, and carbon savings of over 2,500 tonnes per annum.
Scottish Government introduced a Central Estate Strategy in April 2019. This strategy builds on the changes already achieved in preceding years to reduce the total estate size, its running costs and a transition by many organisations to 'smarter working' practices. The strategy promotes a more corporate and collaborative approach across organisations to ensure an efficient, sustainable and well-managed estate.
The part of the Scottish Civil Estate occupied by the core Scottish Government continued a programme of adaption, rolling out further refurbishment to its corporate buildings in Glasgow and Edinburgh to increase capacity. For example, in Glasgow where 1,750 staff work flexibly from 1,400 workstations and have access to more collaborative working spaces. Similarly in Edinburgh, the strategy for its largest building, Victoria Quay, is close to achieving its planned increase in capacity from 2,000 to 3,000 FTE.
4.4 Waste Recycling
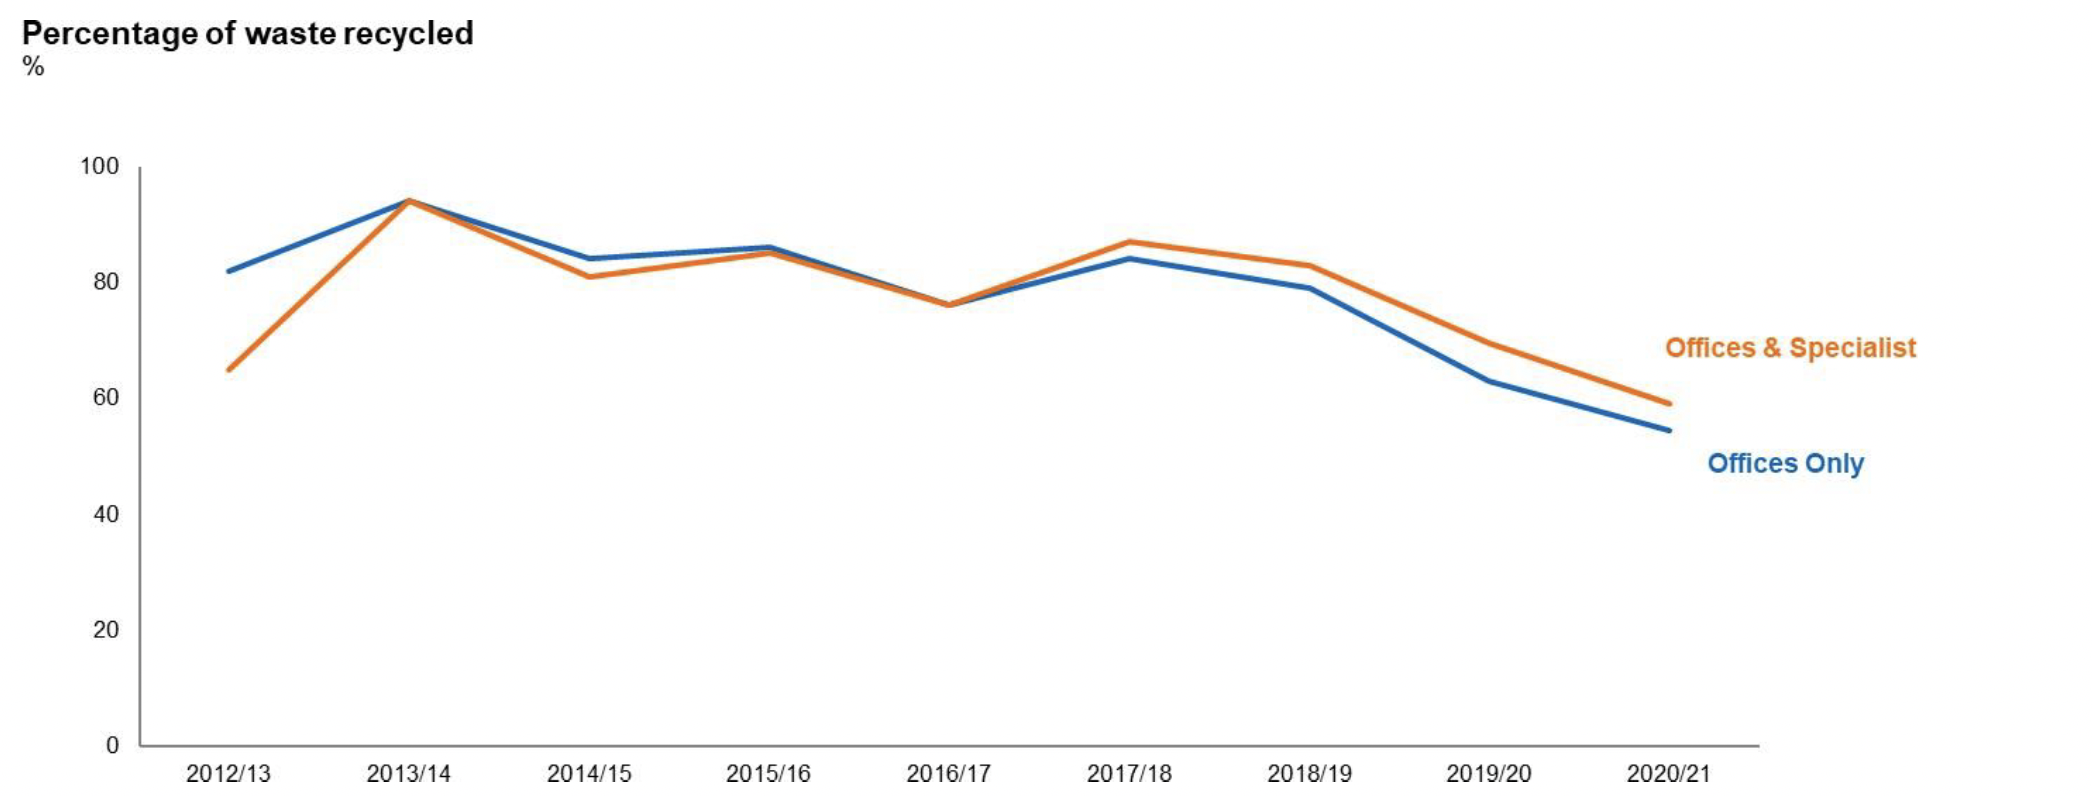
Within Scottish Government, the overall recycling rate has been decreasing since 2017-18, although the overall landfill avoidance rate remains high. The decline in recycling is a result of the general waste stream from the majority of buildings going directly to incineration with energy recovery (EFW), rather than being hand separated in a Materials Recovery Facility for recycling and incineration with energy recovery. Food waste was previously sent for anaerobic digestion.
Since 2019, it has instead (along with the commercially compostable takeaway packaging used in the staff canteens) been sent for composting, which is classed as a type of recycling.
Changes in how waste is disposed of such as using incineration with energy recovery produce an apparent downward trend in the headline recycling figures. This use of technology to recover energy is not classed as recycling but contributes to making the SG estate more sustainable.
Alongside that, Scottish Government is committed to reducing waste production, and to removing single use consumer plastics entirely from its waste streams. Again, these initiatives do not boost headline recycling rates in the graph above but do deliver reductions in waste production in the first place, thereby improving sustainability. Single use hot drinks cups have not been available from staff canteens or coffee outlets since June 2018. Ceramic cups are available for sitting in and staff can bring or buy a reusable cup for takeaway. When offices were fully open, this saved an estimated 450,000 single use cups a year. A number of interventions to remove single use plastics have been undertaken: products with plastic straws have been removed from staff canteens and plastic cutlery has been replaced with reusable metal cutlery. Plastic food takeaway boxes have been replaced with compostable alternatives, which are composted with the food waste in a closed loop system.
One of the last significant remaining sources of single use consumer plastics on the SG estate are cold drinks cups, located in dispensers in the shared kitchens and adjacent to water coolers. The plan to remove these dispensers and provide staff with reusable drinks bottles has been delayed by the pandemic. This work will take place when it becomes appropriate to do so. The cold drinks cups are compostable.
Utilities
With offices being closed to all but essential staff due to national lockdowns during the entire period of this report, the data this year shows sharp changes which are either due to temporarily reduced occupancy levels, such as water use, or arise from an increase in energy used to address heat loss due to an increased need for ventilation. Subsequent reporting periods will likely reflect a transition back to more typical usage and planned improvements.
4.5 Water Consumption
The coronavirus pandemic necessitated the closure of the majority of SG buildings for much of 2020-21. When access to the buildings was possible, they were opened to a small number of essential staff only: most SG staff worked from home for the year. One exception to this was the science and agriculture buildings, where staff could not feasibly work from home as scientific and research activities continued on site. Accordingly, the water consumption KPI appears to be significantly improved and this is representative of temporarily reduced occupancy levels.
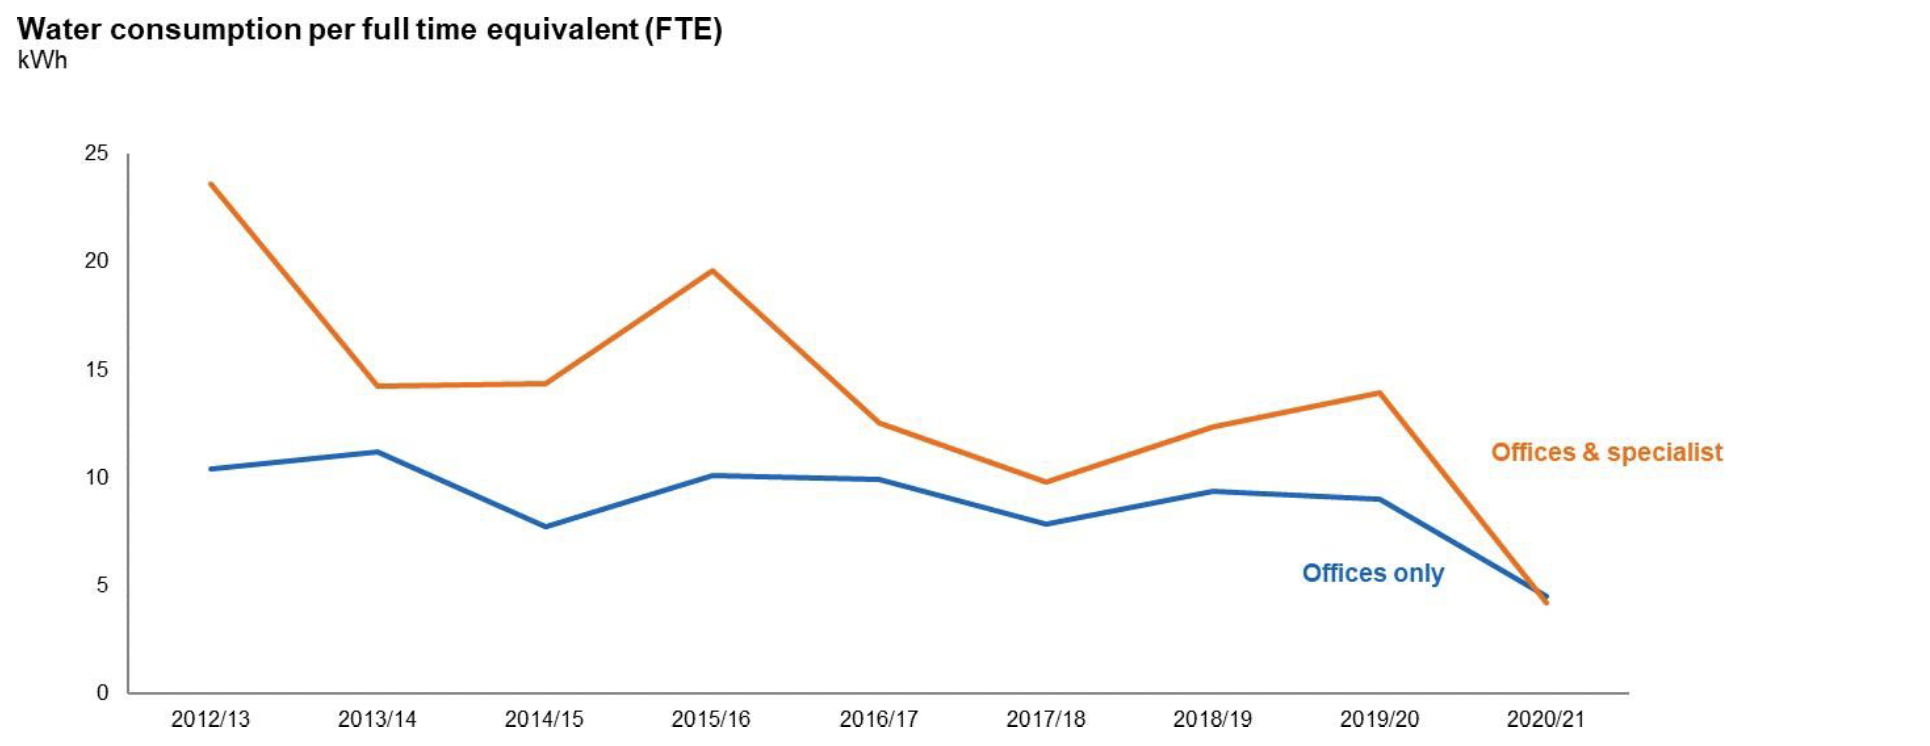
The level of water consumption in the combined 'Offices and Specialist' buildings category is heavily influenced by the programme of experimentation at the SG's Marine Laboratory where the focus is either on sea water-based, or fresh water-based activities. Sea water is extracted and returned directly to the adjacent coastal waters and is not included in the consumption figures.
When the business needs of Marine Scotland require a switch to fresh water, mains water consumption increases.
Water consumption at the non-scientific sites relates directly to occupancy and has reduced significantly this year, reflecting low staff numbers in the buildings. Overall water consumption reduced to almost 50% of 2019-20 levels. Electricity consumption also reduced. However, electricity consumption is driven by baseline load as well as occupancy and overall reductions were less dramatic. At Saughton House, for example, electricity consumption was 14% lower than 2019-20. The building houses the data centre and essential IT and security staff. Across the Scottish Government core estate, electricity consumption was approximately 20% less than in 2019-20.
4.6 Energy Consumption
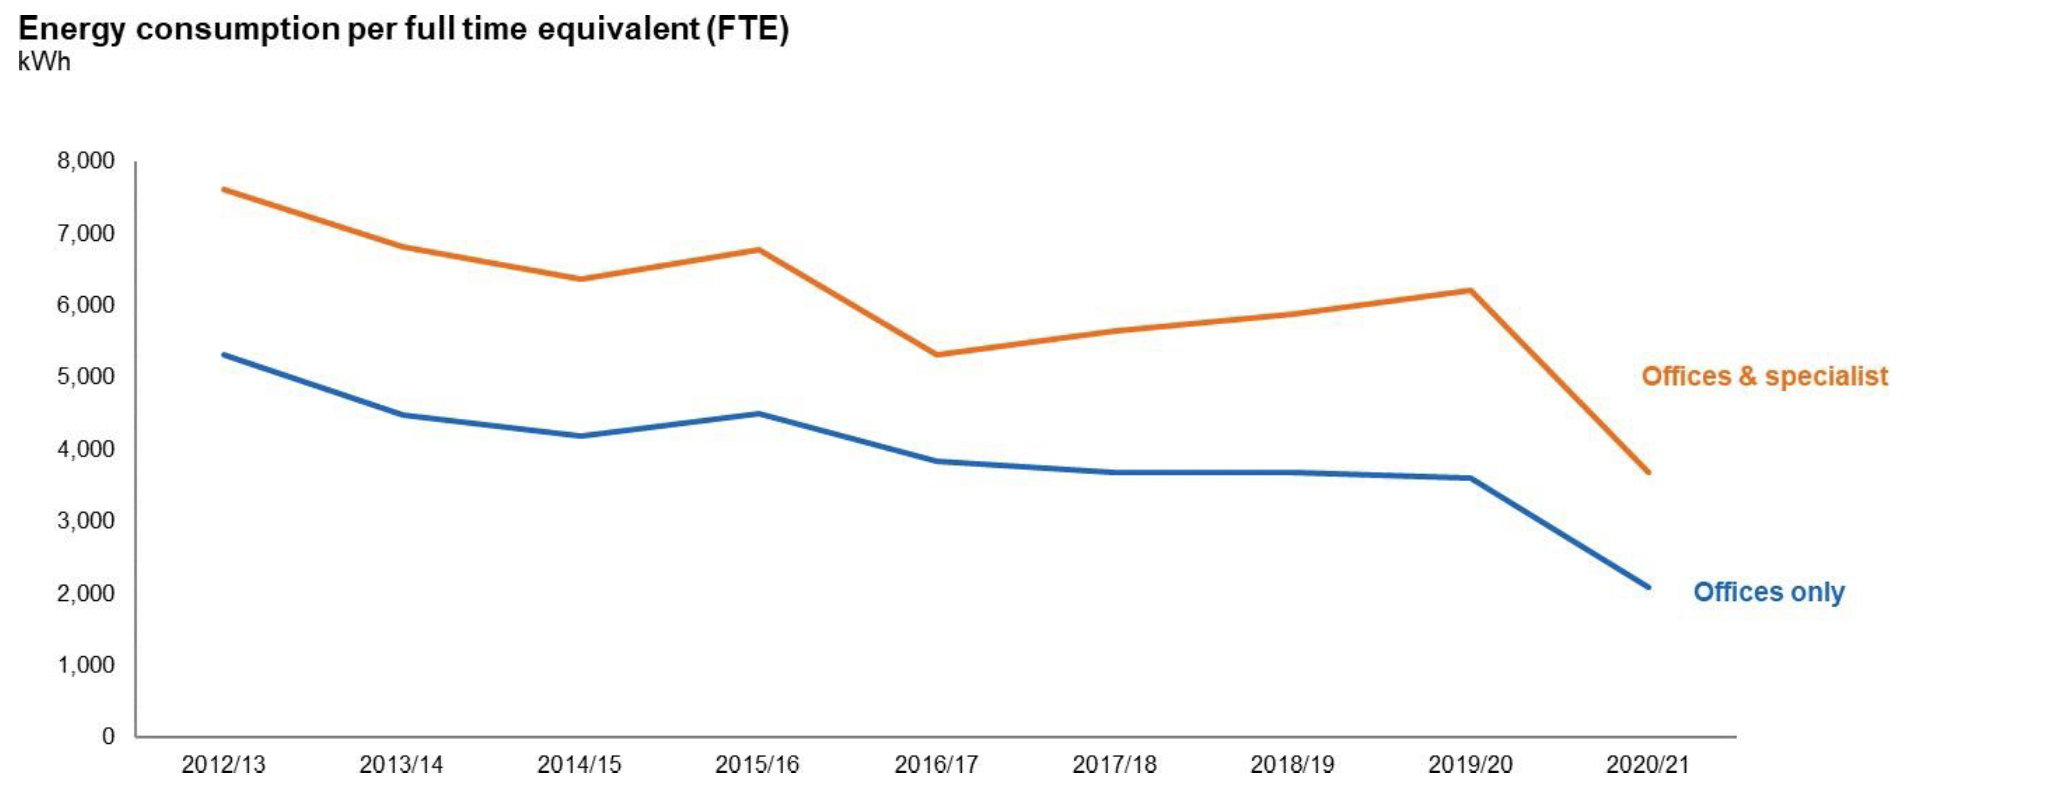
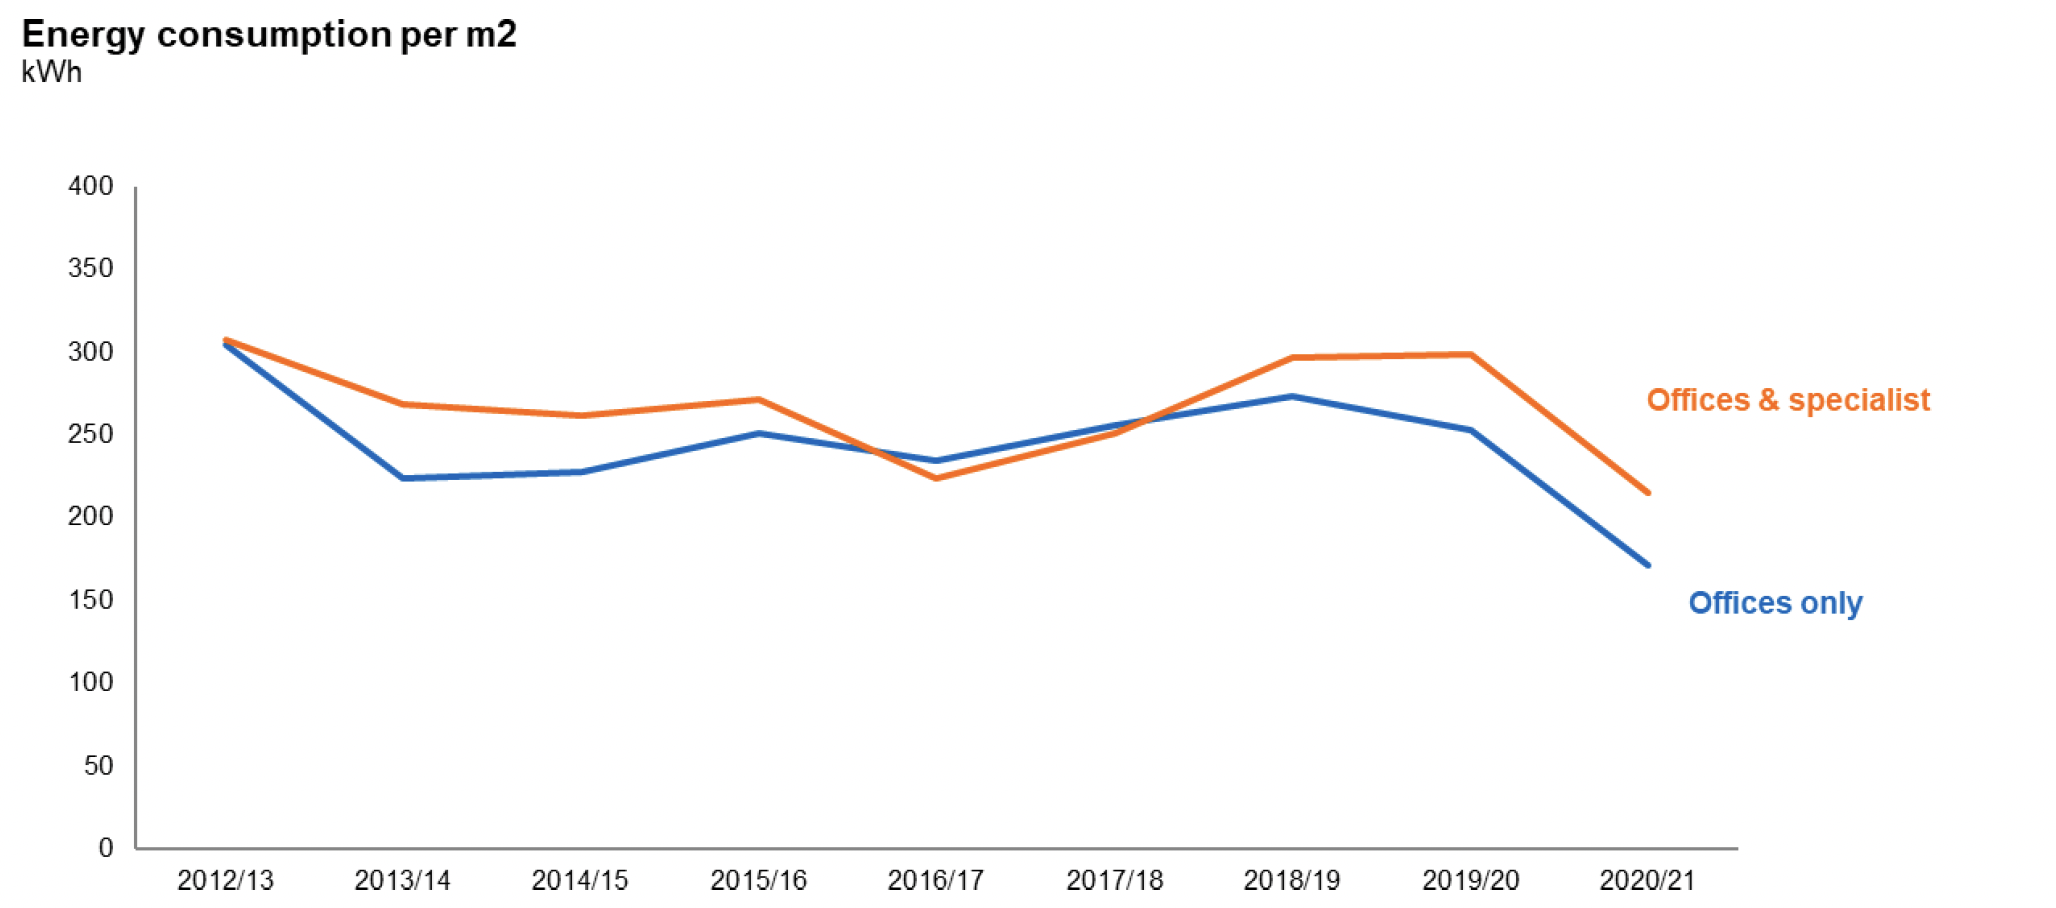
Gas consumption, used primarily for heating, reduced by around 27% compared to the previous year in buildings occupied by SG core. Heating was required in unoccupied buildings at a low level over the winter months for frost protection and to maintain building condition.
When buildings did reopen, although staff occupancy was much lower than standard, heating was typically required to run as usual; and in some cases at an increased level to compensate for heat lost due to increased ventilation.