Scotland's People Annual report: Results from 2009 Scottish Household Survey
A National Statistics publication for Scotland, providing reliable and up-to-date information on the composition, characteristics, behaviour and attitudes of Scottish households and adults.
8 Transport and Travel
Introduction and context
An efficient transport system is essential to Scotland's economy, communities, environment, health and general well-being. Transport is important to everybody in Scotland, allowing them to reach workplaces or schools, have access to shops or services, visit friends and family and enjoy leisure services. Improving transport and the associated transport choices in Scotland will play an important role in achieving the Scottish Government's overall Purpose: 51to focus Government and public services on creating a more successful country, with opportunities for all of Scotland to flourish, through increasing sustainable economic growth.
Two key transport National Indicators that are used to measure Government progress use Scottish Household Survey ( SHS) data:
- Increasing journeys to work made by active or public travel;
- Reducing the proportion of journeys delayed through congestion (uses SHS Travel Diary data which is not presented here). 52
The SHS also provides a range of other transport-related information that can be used to understand travel patterns and choices across Scotland as well as monitoring progress on Scotland's Transport Strategy. 53 This sets out current policy which aims to improve journey times and connections, reduce emissions, and improve the quality, accessibility and affordability of transport.
The first half of the chapter focuses on the main modes of transport used by adults for travelling to work and by children travelling to school, and the second half delves deeper into the reasons behind mode choice, using further analyses.
Cars and Driving
Access to cars
Overall, seventy per cent of households in Scotland have access to at least one car (Table 8.1). However, this varies depending on a number of factors, such as the type of area an individual resides, or their level of income. In rural areas public transport may be less frequent/direct so a higher proportion of households have access to a car. Four-in-ten (41%) households in large urban areas do not have access to a car compared to only 15% of households in remote rural areas and 12% in accessible rural areas. Those households in rural areas are also more likely to have access to a larger number of cars, with 45% of households in accessible rural areas having access to two or more cars.
Table 8.1: Number of cars normally available to the household for private use by Urban Rural Classification
Column percentages, 2009 data
Households |
Large urban areas |
Other urban |
Small accessible towns |
Remote small towns |
Accessible rural |
Remote rural |
All |
|---|---|---|---|---|---|---|---|
No access to cars |
41 |
30 |
23 |
29 |
12 |
15 |
31 |
At least one |
59 |
70 |
77 |
71 |
88 |
85 |
69 |
One |
42 |
44 |
48 |
49 |
43 |
45 |
44 |
Two or more |
18 |
26 |
28 |
22 |
45 |
41 |
26 |
Base |
5,038 |
4,227 |
1,169 |
762 |
1,587 |
1,393 |
14,176 |
Car availability is also strongly associated with income; the higher a household's income the higher the probability it will have access to at least one car. Indeed, in those households with a net annual household income of over £25,000 over nine in ten households have access to at least one car. Ninety eight per cent of households with an income greater than £40,000 have access to at least one car. In contrast, at least half of households with an income of £15,000 or below do not have access to a car at all. This means that fewer households from groups with below average income levels (such as single adults/parents/pensioners) have access to a car.
Table 8.2: Number of cars normally available to the household for private use by net annual household income
Column percentages, 2009 data
Households |
£0 - £6,000 |
£6,001 - £10,000 |
£10,001 - £15,000 |
£15,001 - £20,000 |
£20,001 - £25,000 |
£25,001 - £30,000 |
£30,001 - £40,000 |
£40,001+ |
All |
|---|---|---|---|---|---|---|---|---|---|
No access to cars |
57 |
61 |
52 |
33 |
17 |
11 |
5 |
2 |
30 |
At least one |
43 |
39 |
48 |
67 |
83 |
89 |
95 |
98 |
70 |
One |
35 |
33 |
42 |
55 |
61 |
55 |
44 |
26 |
44 |
Two or more |
8 |
7 |
7 |
12 |
22 |
34 |
51 |
73 |
26 |
Base |
702 |
1,810 |
2,667 |
2,073 |
1,576 |
1,274 |
1,804 |
1,765 |
13,671 |
Household income in the SHS is that of the highest income householder and their partner only. Includes all adults for whom household income is known or has been imputed. Excludes refusals/don't know responses.
There are clear links between access to a car and the level of deprivation of an area which are shown in Figure 8.1. Forty three per cent of households in the 15% most deprived areas of Scotland 54 have at least one car available to them compared with around three-quarters (74%) in the rest of Scotland. This difference becomes more pronounced when looking at households with two or more cars; less than one-in-ten households (8%) in the 15% most deprived areas have two or more cars available to them compared with almost three-in-ten (29%) in the rest of Scotland.
Figure 8.1: Number of cars normally available to the household for private use by Scottish Index of Multiple Deprivation
2009 data, Households (base: 14,176)
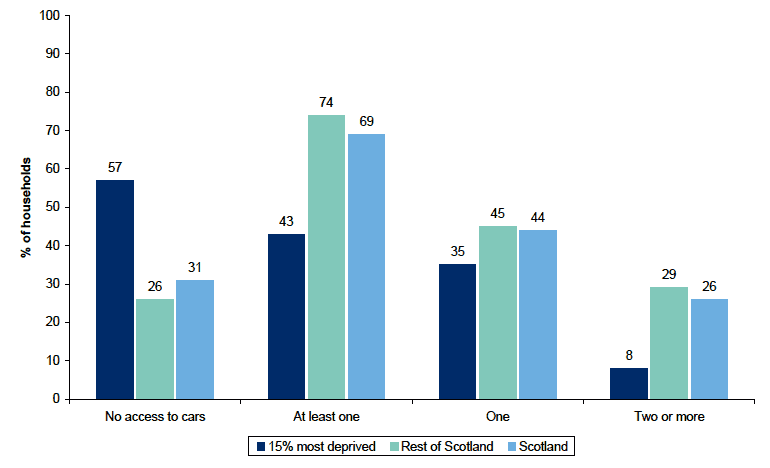
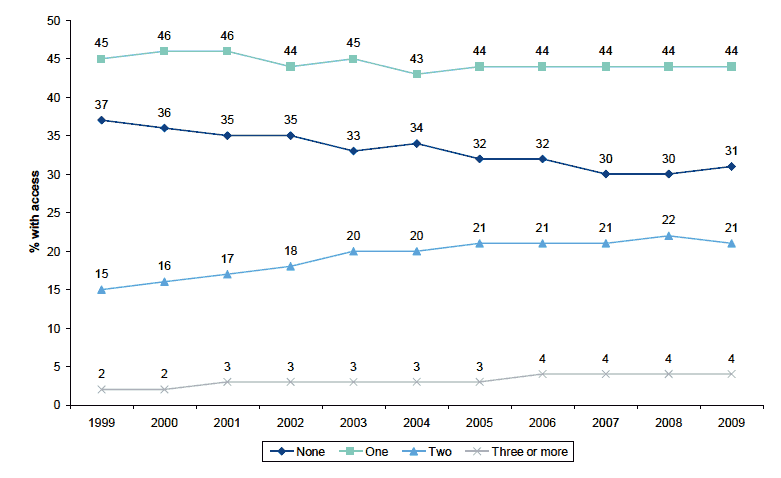
Figure 8.2 shows the changes in car availability over time. Over the period 1999 to 2008 the proportion of households having no access to a car had declined steadily, though there was a one percentage point increase in 2009 (to 31%). Those households with access to just one car has remained relatively stable over the past decade, particularly since 2005 when it has remained at 44%. In contrast there has been a general increasing trend of households with access to a larger number of cars, with those with access to two cars increasing from 15% in 1999 through to 21% in 2009. Those with access to three or more cars has also increased over that period, with current estimates at 4%.
This demonstrates that the overall increase in the number of cars on Scotland's roads has arisen from a widening of availability of access to more households coupled with an increase in multi-car ownership among some households that previously had just one car.
Figure 8.2: Household car access by year
1999-2009 data, Household (2009 base: 14,190)
Driving licences
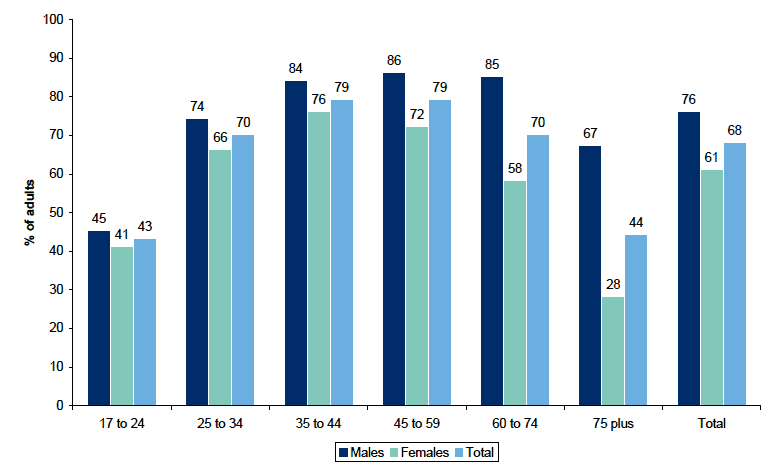
As Figure 8.3 shows, just over two-thirds (68%) of adults hold a full driving licence with a higher proportion of males (76%) holding a licence as compared to females (61%). The percentage with a full licence peaks for females within the 35 and 44 age group (76%) and for males between the ages of 35 and 74 (around 85%). There are significant differences between males and females holding full driving licenses for those aged 60 and over, with only one in four females aged over 75 having a licence.
Figure 8.3: Adults who hold a full driving license by gender within age
2009 data, Adults aged 17 and over (base: 12,447)
Adults Travelling to Work or Education
In this section the modes adults use to travel to work and education and the modes children use to travel to school are analysed to identify relationships and assess change over time.
Adults travelling to work
One of the National Indicators used in the Scottish Government's performance framework is to: Increase the proportion of journeys to work made by public or active transport, the data for which comes from the SHS. 55
The indicator's aims are to reduce car dependency, along with subsequent congestion and harmful emissions, while making it easier to incorporate physical activity into daily routines, thus contributing to a longer and healthier life. Progress may be achieved by increasing choice through increased accessibility to public transport (rail, tram and bus), travel information and infrastructure for cycling and walking.
As Figure 8.4 shows, the proportion of adults usually travelling to work by car 56 has remained relatively stable around 67% since 1999. Following a decrease in 2008 to 66%, the latest figures show a slight increase with 67% of adults travelling to work by car or van in 2009.
Figure 8.4: Percentage of adults usually travelling to work by car
1999-2009 data, Adults in work only (except those working from home) (2009 base: 5,371)
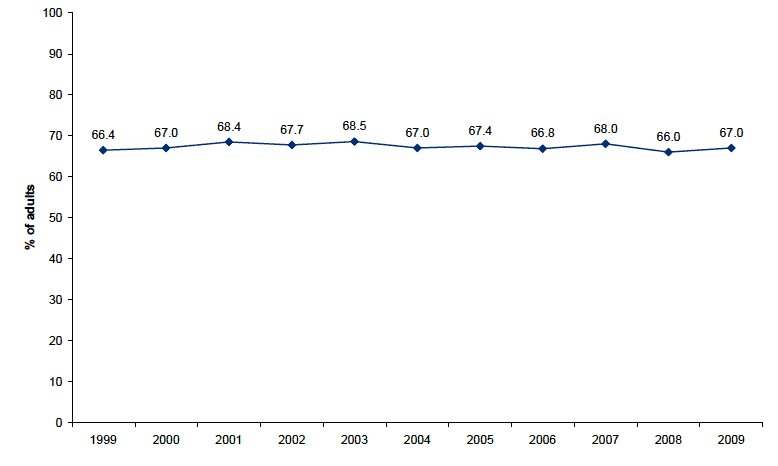
Table 8.3 provides detail on the various modes that adults usually use to travel to work over the past decade. While there have been some small fluctuations, in general there have been no major shifts in the type of transport adults use as a means of travelling to work over time. The biggest changes have actually been within car use. The percentage of adults travelling to work as a driver has increased (54.6% in 1999 to 60.7% in 2009), while the percentage making the journey to work as a passenger in a car has decreased (11.8% in 1999 to 6.4% in 2009). This suggests an increase in single occupancy car journeys. The percentage of people who usually walk to work increased has remained relatively stable, with 12.3% of adults usually walking to work in 2009.
Table 8.3: How adults usually travel to work by year
Column percentages, 1999-2009 data
Adults in employment only, excluding those who work from home |
1999 |
2000 |
2001 |
2002 |
2003 |
2004 |
2005 |
2006 |
2007 |
2008 |
2009 |
|---|---|---|---|---|---|---|---|---|---|---|---|
Walking |
13.7 |
13.7 |
13.1 |
13.1 |
12.6 |
12.7 |
12.7 |
13.8 |
11.9 |
12.5 |
12.3 |
Car/Van |
66.4 |
67.0 |
68.4 |
67.7 |
68.5 |
67.0 |
67.4 |
66.8 |
68.0 |
66.0 |
67.0 |
Driver |
54.6 |
56.5 |
57.9 |
56.6 |
59.8 |
58.9 |
59.8 |
59.8 |
61.3 |
59.9 |
60.7 |
Passenger |
11.8 |
10.5 |
10.4 |
11.0 |
8.7 |
8.1 |
7.5 |
7.0 |
6.7 |
6.1 |
6.4 |
Bicycle |
1.7 |
1.7 |
1.7 |
1.6 |
1.8 |
1.9 |
1.6 |
2.0 |
1.7 |
2.3 |
2.4 |
Bus (ordinary or works) |
12.1 |
12.5 |
12.2 |
12.2 |
11.6 |
12.7 |
12.1 |
11.8 |
12.7 |
12.1 |
12.1 |
Rail |
3.0 |
2.3 |
2.3 |
3.1 |
2.9 |
3.5 |
3.9 |
3.6 |
3.5 |
4.3 |
3.9 |
Other |
3.0 |
2.8 |
2.4 |
2.3 |
2.6 |
2.3 |
2.3 |
2.0 |
2.3 |
2.7 |
2.3 |
All |
100 |
100 |
100 |
100 |
100 |
100 |
100 |
100 |
100 |
100 |
100 |
Base |
6,021 |
6,253 |
6,276 |
5,974 |
6,033 |
6,359 |
6,044 |
6,068 |
5,175 |
5,437 |
5,371 |
Adults travelling to work or education
Looking at travel to education combined with travel to work yields a similar but slightly different picture. As those in education tend to be younger, and younger people are less likely to have a full driving licence, proportions driving a car or van are lower if they are included.
Overall, 55% of respondents in 2009 report driving as their usual mode of transport for travelling to work or education. Public transport is the main mode used by 19% of adults; predominantly this involves bus use (14% bus, 5% rail). Seventeen per cent use active travel modes (15% walking; 2% bicycle).
Figure 8.5: How adults usually travel to work or education
2009 data, Adults (base: 5,869)
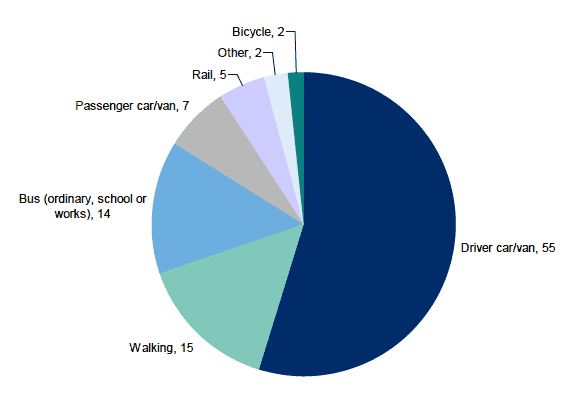
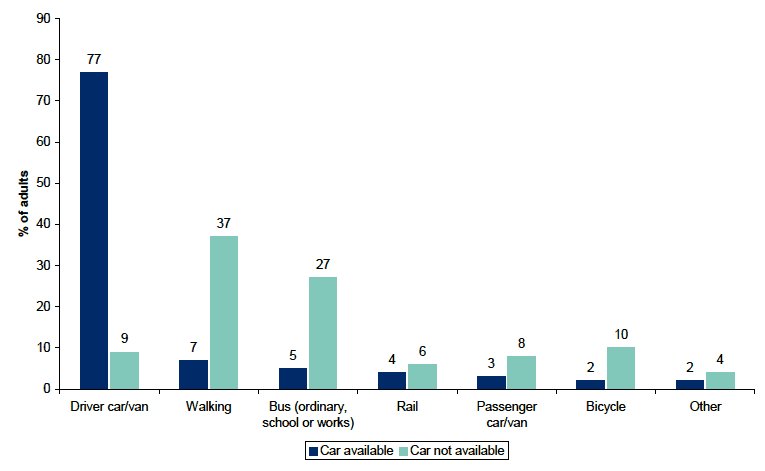
Figure 8.6 shows the difference in modes of transport used between those who have access to a car and those who do not, among adults having a full driving licence. It shows a clear majority (77%) of those who hold a full driving licence, and have access to a car, use it to travel to work/education. When there is no access to a car, most adults who hold a full driving licence would walk to work or education (37%) or go by bus (27%).
Figure 8.6: How adults usually travel to work or education by whether any cars normally available to household for private use
2009 data, Adults holding a full driving licence (base: 4,524)
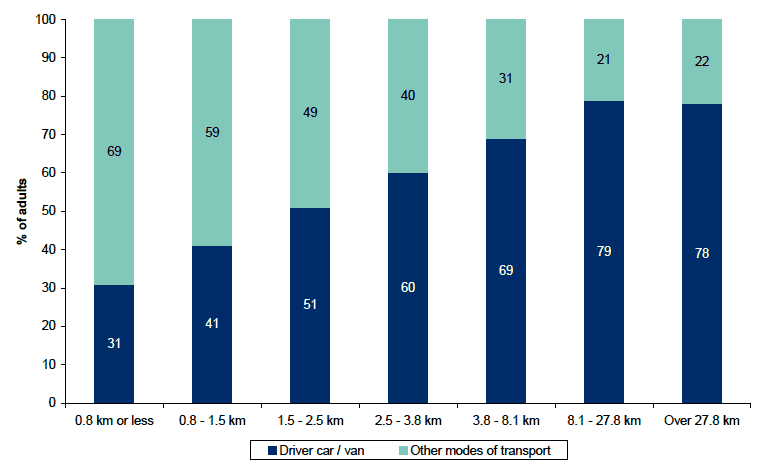
Distance between home and work is the most important factor in determining whether people drive or use other modes of transport to travel to work or education. Generally, the further away an adult lives from work or education, the more likely they are to drive (Figure 8.7). The percentage of people who drive to work or education rises steadily from 31% of those living less than 0.8 kilometres (1/2 mile) from their destination to 78% of those who live more than 27.8 kilometres (over 17 miles) away.
Figure 8.7: How adults usually travel to work or education by distance between home and work or education
2009 data, Adults in work or education (base: 5,549)
Children Travelling to School
Having looked at how adults travel to work or education, it is also of interest to investigate the journeys children take to school, as these account for a large number of weekday journeys, often taken at peak times, during term time. In the SHS, information on travelling to school is collected from the household respondent about a randomly-selected school child within households containing at least one child in full time education at school.
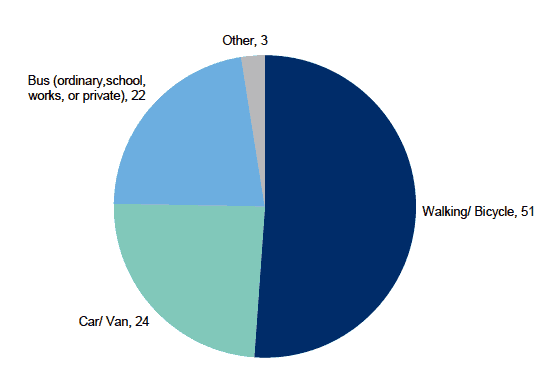
As Figure 8.8 shows, over half of children (51%) usually walk or cycle to school. 57 Almost a quarter (24%) travel by car or van and a further 22% travel by bus.
Figure 8.8: How children usually travel to school
2009 data, Pupils in full-time education at school (base: 2,881)
The proportion of school children using different modes of transport to travel to school varies according to the urbanisation of the area in which they live. Table 8.4 shows that in rural areas, away from towns, fewer walk and the 'Other' category, the vast majority of which is bus use, increases. This is particularly apparent in remote rural areas where there is greater access to school bus facilities (55% use the 'other' modes of transport to travel to school). This increase in motorised transport and decrease in active transport use is because pupils are more likely to travel longer distances to reach their school in these areas.
Table 8.4: How children usually travel to school by Urban Rural Classification
Column percentages, 2009 data
Pupils in full-time education at school |
Large urban areas |
Other urban |
Small accessible towns |
Remote small towns |
Accessible rural |
Remote rural |
All |
|---|---|---|---|---|---|---|---|
Walking/Bicycle |
57 |
58 |
51 |
65 |
29 |
26 |
51 |
Car/Van |
25 |
26 |
19 |
23 |
27 |
18 |
24 |
Other |
18 |
17 |
30 |
12 |
44 |
55 |
25 |
Base |
913 |
899 |
277 |
137 |
351 |
303 |
2,880 |
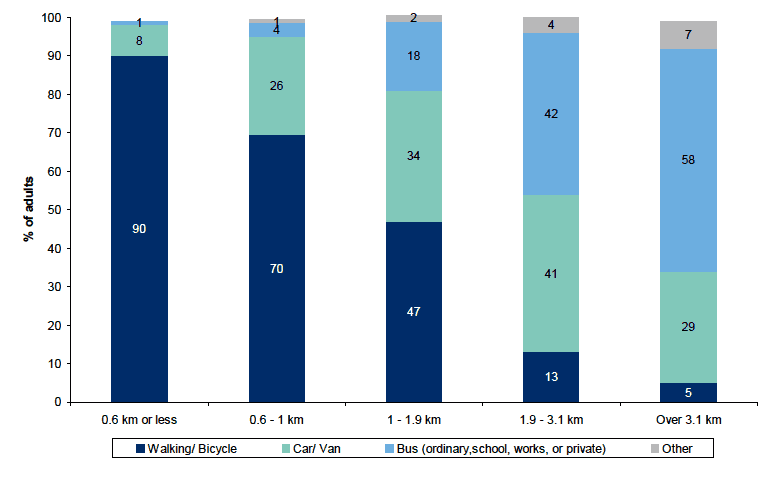
Travel to school by car or van is less affected by distance (Figure 8.9), except for pupils living the closest to schools; eight per cent living 0.6 km or less (less than approximately 3/8 mile) travel to school by car. Beyond that distance, at least 26% of school children travel to school by car. Active forms of transport (walking and cycling) are used predominantly by school children when they live within 1.9 km of their school, ranging between 47% and 91%. With distances bigger than 1.9 km, travelling to school by bus is the most used mode of travel, with 58% of school children who live more than 3.1 km from school travelling by bus.
Figure 8.9: How children usually travel to school by distance between home and school
2009 data, Pupils (base: 2,316)