Scotland's Carbon Footprint 1998-2018
Estimates of Scotland's greenhouse gas emissions on a consumption basis for the period 1999 to 2018.
Part of
Comparison of Scotland's carbon footprint and its territorial emissions
In addition to Scotland's carbon footprint, Scotland's carbon emissions are measured on a territorial basis. The different bases should be viewed as complementary ways of accounting for carbon emissions.
What are Territorial Emissions?
Territorial greenhouse gas emissions are those which occur within a country's or region's borders. The Scottish Government publishes emissions on a territorial basis from the Scottish greenhouse gas inventory as part of the Official Statistics publication Scottish Greenhouse Gas Emissions 2019. The Scottish greenhouse gas inventory measures greenhouse gas emissions on a territorial basis, so only includes emissions within Scottish borders, though it also includes estimates of greenhouse gas emissions from international aviation and shipping. The inventory also includes emissions and removals resulting from land use, land use change and forestry, which have been removed from the Carbon Footprint. Data from the Scottish Greenhouse Gas Inventory are used for reporting progress against the Climate Change (Emissions Reduction Targets) (Scotland) Act 2019 and for progress against the Scottish Government's Sustainability Purpose Target.
The Scottish greenhouse gas inventory is a disaggregation of the UK's greenhouse gas inventory, which is used for reporting UK emissions to the EC and United Nations Framework Convention on Climate Change (UNFCCC). The National Atmospheric Emissions Inventory website contains direct comparisons between the Scottish and UK greenhouse gas inventory.
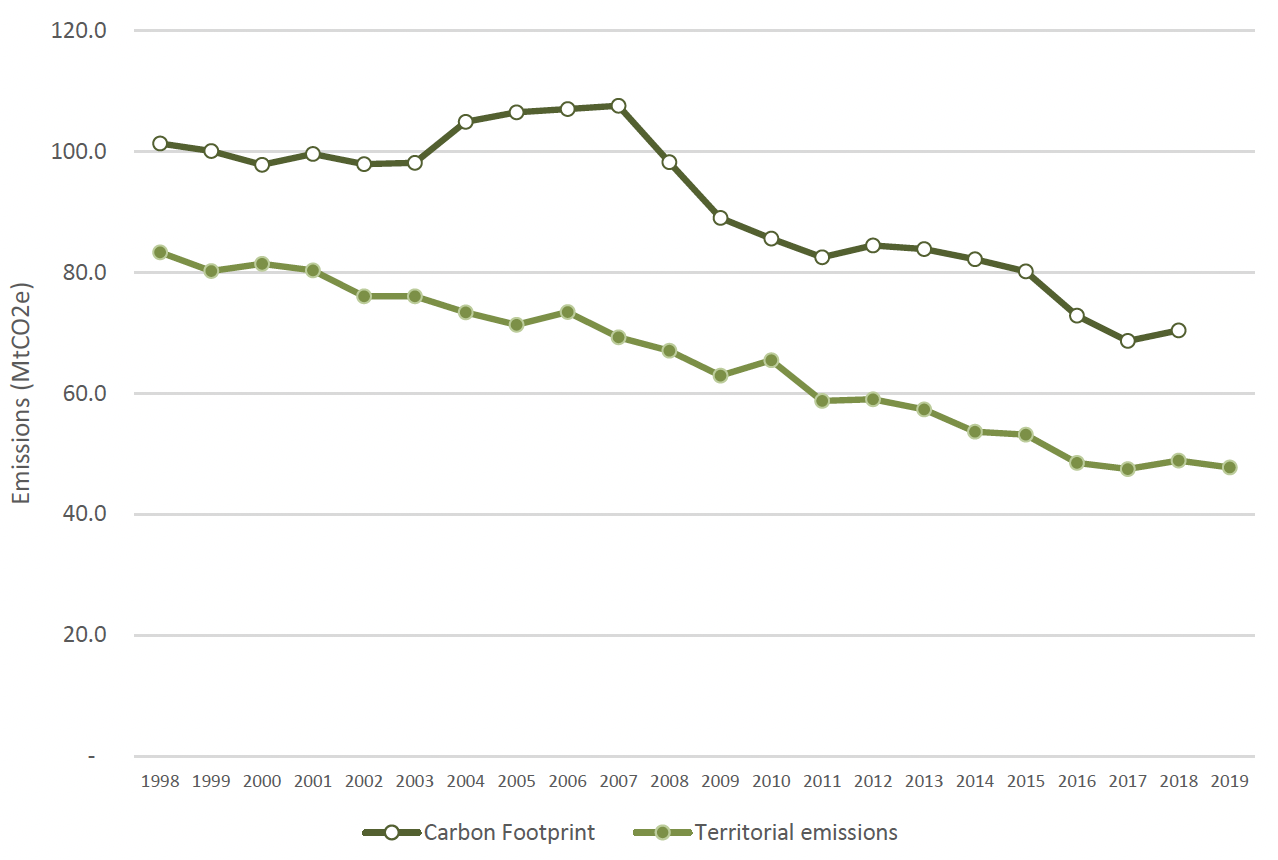
Chart 9 shows the relationship between the two different measures of greenhouse gas emissions relating to Scotland. The carbon footprint is notably bigger due to the impact of embedded greenhouse gas emissions from imports. Whilst the carbon footprint has fallen by 32.2 per cent between 1998 and 2018, equivalent greenhouse gas emissions on a territorial basis have fallen by 43.0 per cent over the same time period.
Contact
Email: CCStatsModelling@gov.scot