Scotland's Carbon Footprint 1998-2018
Estimates of Scotland's greenhouse gas emissions on a consumption basis for the period 1999 to 2018.
Part of
Revisions since the previous Carbon Footprint for Scotland
There have been nine releases of the model used to estimate Scotland's Carbon Footprint.
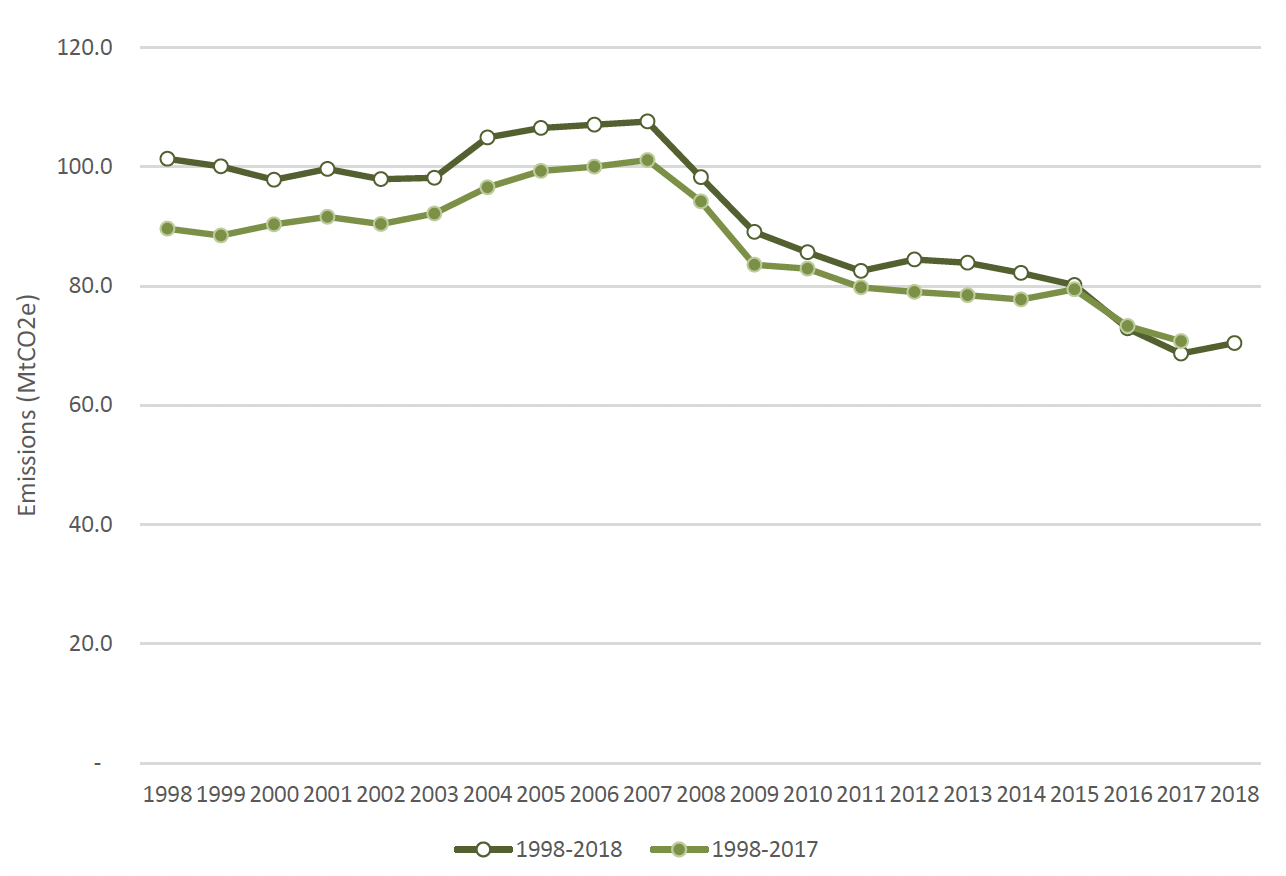
Chart 8 shows the differences between the 2017 and 2018 releases of the carbon footprint. Revisions to previously published estimates in this release mainly relate to the earlier part of the time-series. These higher emissions are due to the increased sectoral disaggregation of the latest model. In particular the separation of mining of metal ore and mining of crude petroleum and natural gas is an important improvement. These two sectors have significantly different impacts per unit of economic output, with the mining of crude petroleum and natural gas having the higher emissions intensity. When the sectors are combined, as in previous releases, the intensity of the combined sector is much too small for use with petroleum heavy goods. This means that for certain products, where petroleum is used in their manufacture (as an energy source or feedstock), their footprints will have previously been underestimated. Conversely for products which use significant ore in their manufacture previous footprints will have been overestimated.
Revisions between the 1990-2012 and 1990-2018 publications
Since the carbon footprint was first published, successive releases have used different versions of the UK MRIO model. The 2012 release used a 2-region model which only distinguished the UK and the Rest of the World as trade regions. The 2013, 2015 and 2016 releases used a four region model, distinguishing imports from Europe, China and the Rest of World, using trade data from the Eora global MRIO. The 2017, 2018 and 2019 model adopted the same four regions but used trade data from the EXIOBASE MRIO. In this release, the UK MRIO model uses a 15 region configuration although this has been collapsed to a degree in the publication for clarity. The full 15 region detail is provided in a spreadsheet which accompanies this publication.
Contact
Email: CCStatsModelling@gov.scot