Scotland National Strategy for Economic Transformation: evidence paper
This Evidence Paper presents evidence on the structure and performance of Scotland’s economy, and identifies areas where the new National Strategy for Economic Transformation must take action to deliver transformational improvements to Scotland’s economic performance.
5. Delivering Economic Transformation: Lessons from a Selection of Advanced Economies
This chapter considers the experiences of a number of countries that have experienced significant economic transformation or that have high levels of economic development to draw lessons for Scotland. It looks specifically at the experience of four countries that have had periods of significant economic change: Denmark, Finland, New Zealand and Ireland.
5.1 Transformation in an Advanced Economy
Traditionally, achieving and sustaining high rates of growth in GDP per capita growth, exports or other economic indicators is traditionally associated with countries undertaking transition or significant catch up in terms of economic development. Advanced economies tend to grow at slower rates given the high levels of economic activity within their economies. In the last 40 years, only one OECD country – the Republic of Korea, has doubled GDP per capita over a decade, and only two countries have doubled GDP growth in 20 years.[92] This type of economic transformation tends to be typical in earlier stages of economic development, and is then followed by the regularly observed phenomenon of 'economic convergence' where a country's GDP per capita growth slow down over time with economic development.
While more OECD countries have transformed on trade performance (roughly doubling exports over a decade), this has often been associated with radical changes to trade arrangement like the rapid global integration in the 1990s, and access to the 'European Single Market' for countries like the Czech Republic, Hungary and Poland. As noted in Section 3.5 however strong economic growth on the basis of only GDP per capita or exports is not enough to bring about wider improvement in living standards that the National Strategy for Economic Transformation is aiming for.
The World Economic Forum (WEF) Inclusive Development Index (IDI) provides a more comprehensive measure of economic transformation based on an institutional and policy framework encompassing: Growth (Labour Productivity, Healthy Life Expectancy, Employment); Inclusion (net income inequality, poverty, wealth inequality, and median income); and, intergenerational equity (adjusted net savings, carbon intensity, public debt and dependency ratio). The top six high performing countries on the WEF IDI are all relatively small European economies with populations of 10 million or fewer. All of these nations also score highly on the WEF Global Competitiveness Index (2019),[93] along with larger advanced economies (see Table 5.1.1).[94]
| Inclusive Development Index (2018) | Global Competitiveness Index (2019) | |
|---|---|---|
| 1 | Norway | 17 |
| 2 | Iceland | 26 |
| 3 | Luxembourg | 18 |
| 4 | Switzerland | 5 |
| 5 | Denmark | 10 |
| 6 | Sweden | 8 |
| 8 | Ireland | 24 |
| 11 | Finland | 11 |
| 13 | New Zealand | 19 |
| 21 | United Kingdom | 9 |
These rankings on the IDI and GCI shows that it is possible for countries to achieve both socioeconomic development and economic competitiveness. The two can work together and drive a virtuous circle, which rewards investment in inclusion, equality and sustainability, with long-term gains in growth and productivity.
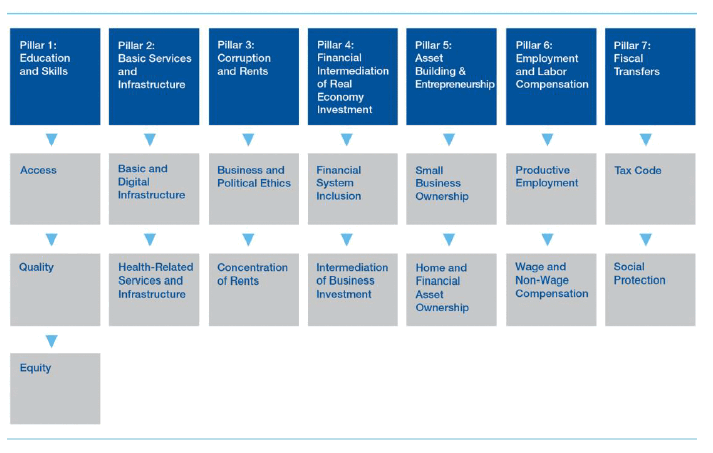
The WEF also ranks countries across seven structural economic policy and institutional strength pillars (see Figure 5.1.1) that cover fifteen areas judged to contribute to inclusive economic development or transformation. The top six performing countries on the Inclusive Growth and Development Framework all score highly across the seven areas. The only area where the UK performs relatively better than most of these countries is Pillar 7: Fiscal Transfers (UK ranks third), and to some extent Pillar 5: Asset Building (UK ranks fourth).
5.2 Policy Approaches for Successful Small Advanced Economies
There is no single 'best practice' to delivering economic transformation.[96] The high performing advanced economies all have significant differences in approaches and respond differently to a range of local political and economic contexts. There are, however, common features found in high performing small economies and are not in the less successful ones and all are a result of specific policy choices.
Overall, the evidence suggests that successful small advanced economies have tended to be rigorously strategic about strengthening their economic competitiveness through investing in their human capital and supporting innovation. They focus on choosing their areas of outward activity through careful development of existing strengths and targeting of potential international markets.
Prioritising Innovation and Human Capital: Most small advanced economies demonstrate strong, sustained investment in knowledge, innovation and human capital. High performing economies, such as Switzerland and several Scandinavian countries, perform particularly well on the GCI's innovation and business sophistication measures.
Strategic Coherence: High performing small economies all demonstrate a high degree of policy coherence in their approaches; demonstrate flexibility when responding to shocks and structural changes. For example, the Scandinavian nations and Switzerland all have flexible labour market policies, but also strong social insurance systems to protect their flexible workforce and to mitigate the risks that come with flexibility. Following the 2008 crisis, the countries that recovered quicker tended to have an increased focus on:
- building economic resilience and an increased awareness of economic risk;
- deliberate efforts to boost productivity, either through structural reform such as Productivity Commissions, or through other policy levers, like increased business investment and encouraging innovation; and,
- strategies to diversify international footprints, either through trade agreements or through supporting firms to expand internationally.
Active International Engagement: High performing small advanced economies also tend to have active international engagement, which lets them access larger markets. A business base that has more large companies per capita and that can readily access global markets supports this. External relations policies—whether that takes the form of trade agreements or a skills focus on enterprise and international expansion—support this international engagement.
Annex 1 Modelling Assumptions
Export Plan
- The Export Growth Plan {Scotland: a trading nation - gov.scot (www.gov.scot)} set a target of increasing Scotland's international exports from 20% to 25% of GDP.
- From international trade modelling perspective, various policy levers outlined in the plan are best thought of as a reduction in trade barriers for Scottish exporters with countries across the world. In a standard trade model, lowering barriers with one trading partner is expected to increase bilateral trade and can affect trade with other trading partners.
- The overall export change of ~5% has been informed using a global trade model GTAP with the original GTAP database adjusted to include Scotland as a separate region. An illustrative reduction in Scotland's trade barriers with the Rest of the World partners has been modelled to achieve a 25% increase in International Exports in line with previous SG modelling for the Export Growth Plan. The externally calibrated shock fed into a CGE model gradually over the 10 years together with other policy changes.
- Finally, as academic evidence also suggests that higher trade openness has a positive relationship with productivity, an additional productivity shock was incorporated into a CGE modelling scenario together with export shocks. The size of the productivity shock was informed by empirical evidence on the link between trade and productivity (i.e. using an elasticity of 0.2 informed by empirical evidence[97], a 5% increase in trade is assumed to lead to a 1% increase in productivity).
Inward Investment and Global Capital Investment Plans
- The Inward Investment Plan {Shaping Scotland's economy: inward investment plan - gov.scot (www.gov.scot)} set out ambition of increasing Scotland's attractiveness as a destination for inward investment to ensure that Scotland's Foreign Direct Investment (FDI) performance is generating spillovers similar to the levels seen in the East of England (the best performing UK region as estimated in the UK Government analysis).
- In addition, the Global Capital Investment Plan {Investing with Purpose: global capital investment plan - gov.scot (www.gov.scot)} set out how the Government hopes to increase the flow of private capital to the economy.
- Literature on the link between FDI and productivity is more limited than for trade openness, and even more so for business investment.
- The FDI plan is expected to increase FDI flows as well as productivity spillovers from FDI. Empirical elasticities between FDI and productivity are small- i.e. increasing FDI stock by 50% and under higher spillover utilisation (with the elasticity of productivity of 0.07 estimated for the East of England vs 0.03 estimated for Scotland in the Department for International Trade study[98]) relative to the baseline would suggest a productivity improvement of 2% in 10 years' time in Scotland. Larger increases in FDI stock relative to the baseline would generate greater improvements in productivity.
- Evidence on elasticities between investment and productivity is more limited.
- Taken together, both of these policies are modelled as a 4% increase in productivity, in line with previous Scottish Government modelling for the FDI plan but under a simplifying assumption that both plans achieve this potential improvement in productivity, reflecting productivity spillover effects from the FDI plan and higher productivity from increased innovation, infrastructure and R&D investment under the Global Capital Investment Plan.
Higher Real Wages linked to Productivity Improvements.
- The policy is modelled as a ~1% change in average gross wages, to reflect improvements in productivity.
- In a standard CGE model, an increase in wages lowers demand for labour which leads to lower employment. At the same time, numerous empirical evidence on the employment effects of minimum wages suggests low or modest impact.[99] The overall wage shock for the CGE model has been calibrated such that effective cost to firms generates changes in employment in line with the empirically observed elasticities (i.e. an elasticity of 0.3 implies that a 1% increase in wages results in 0.3% loss of employment).
Sensitivity Analysis
Productivity Shock
- The ambitions set out in this scenario are taken as given and if some targets are not met, the resulting economic boost is likely to be smaller. Expected changes to productivity and trade are relatively large in nature and exhibit a degree of overlap. Some ambitions may take longer to materialise than the assumed 10 year horizon.
- Historically, real labour productivity in Scotland grew at a rate of ~1% per annum but in the recent years it has been much lower.
- To reflect some of the uncertainty around productivity impacts, two additional illustrative scenarios have been explored for where productivity gains are lower and higher in 2032. Under both scenarios, international exports are still expected to increase by ~25%.
- The illustrative low (high) scenario shows productivity gain two standard deviations below (above) the 5% increase assumed in the main scenario. The standard deviation measure (~2%) is calculated based on the historical real labour productivity growth in Scotland.
- If the productivity gains over 10 years are higher (lower) than assumed in the scenario then the economy would be 6.3% (3.4%) larger in 2032 than the baseline.
- Both scenarios aim to provide a crude illustration of highest deviation in annual growth based on past performance around the assumed improvement of 5% in labour productivity by 2032.
Labour Market Parameters
- Different labour market closures (and migration) – less important when modelling a scenario (a combination of demand and supply side shocks) rather than individual policies.
- A direct shock to wages to model the Real Living Wage policy can be only be introduced under the fixed nominal wages closure (i.e. nominal wages are determined exogenously at a UK level but real wages adjust).
- For this reason, the sensitivity analysis for the labour market closure has been explored without the real living wage shock.
- Assuming a regional bargaining closure (rather than fixed nominal wages) in the labour market does not change significantly the GDP path over the 10 year horizon (GDP impact in 2032 increases by 0.1 percentage points) However, this closure results in a much higher expansion of the economy in the long run.
Production Function Parameters
- Substitution between capital and labour is one of the main parameters in the production function – it measures how easy it is substitute one input for another, and is linked to relative prices of labour and capital.
- One of the large shocks in the modelled scenario is an increase in labour productivity. Initially, it lowers demand for labour but as workers are now more productive, the effective cost of labour falls, encouraging firms to use more of labour (as it is now cheaper relative to capital). This means that employment impact in the model is likely to be sensitive to the value of elasticity.
- With higher elasticity of substitution between capital and labour, (0.8 vs 0.3), the boost to employment is higher than in the main scenario (2.3% vs 1.1%) , reflecting that firms find it easier to substitute workers for capital. GDP results are less sensitive to this parameter as the value of elasticity is expected to alter the composition of inputs used by firms when producing goods and services (GDP impact increases by 0.2 percentage points).
Limitations
- CGE models are not forecasting tools but provide an indication of how the economy may change relative to the baseline given a well-defined policy scenario.
- The targets set out in the policy scenario have been taken as given, and a range of simplifying assumptions have been used to demonstrate the potential benefits to the economy without assessing the feasibility of achieving these ambitions. If some targets are not met, the boost to the economy is expected to be lower.
- Net zero and Covid-19 – transformations already underway will have huge implications for the baseline. Also, Covid-19 part in accelerating longer term trends (more remote working, decline of large high street retail, technology/automation, demographics etc.).
- Shocks to trade and productivity are relatively large in nature and exhibit a degree of overlap – i.e. exports, inward investment and capital investment shocks all impacting on labour productivity.
- Combining all scenarios into a single mix of policy changes may introduce inconsistencies with the previous modelling of these policy changes in isolation.
- In addition to the uncertainty around the scenarios themselves, the modelling results are also influenced by parameters of the model – e.g.,. assumptions around how labour markets operate (labour market closure), how governments collect taxes and spend revenues (fiscal closure), and how migration flows between Scotland and the Rest of the UK respond to changes in economic policy (migration closure).
- In addition, the SG CGE model was not build to model economic decision making at a granular level (beyond a single representative household or firm). For example, the model does not consider how firms operating in different sectors or firms of different sizes may respond to changes in incentives; neither does it attempt to differentiate between different types of workers or different types of capital or investment. This means that the model is most useful in providing the direction of travel for the aggregate outcomes (such as GDP, employment, trade) with more limited sectoral insights.
Contact
Email: Cornilius.Chikwama@gov.scot