Scotland National Strategy for Economic Transformation: evidence paper
This Evidence Paper presents evidence on the structure and performance of Scotland’s economy, and identifies areas where the new National Strategy for Economic Transformation must take action to deliver transformational improvements to Scotland’s economic performance.
3. Challenges Facing Scotland's Economy across National Strategy Objectives
This section provides further evidence of Scotland's economic challenges across the five objectives set out in Section 1. It sets out:
- how Scotland has performed based on a range of measures of success – including benchmarking performance against comparable economies; and,
- specific challenges to improving performance and delivering transformational economic change;
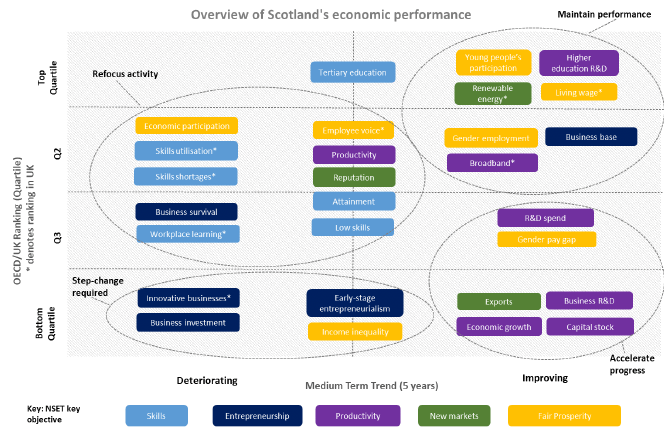
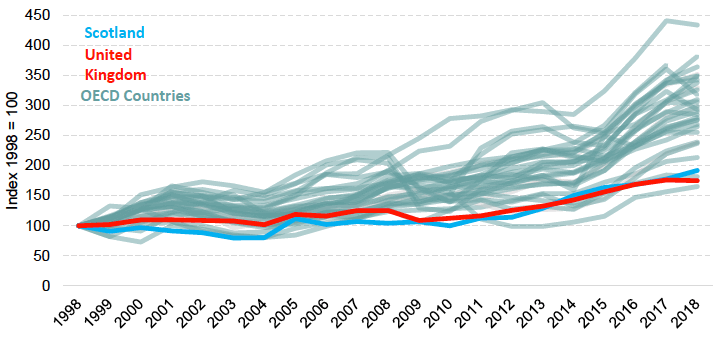
Figure 3 gives an overview of Scotland's performance across key drivers of economic performance. On the vertical axis it considers these drivers in relation to how Scotland performs against international competitors (or the rest of the UK where international data is not available), and on the horizontal axis whether Scotland's performance is improving or worsening. It highlights the economic drivers where Scotland has maintained strong performance, where there is need to refocus policy to stop further deterioration, and where it needs to accelerate progress to drive a step change in performance.
Broadly, the main areas where Scotland needs to drive a step change for the economy to prosper are linked to our business base – business innovation, investment and early-stage entrepreneurship, and inequality. These are the areas where Scotland ranks low when compared to other OECD countries and the UK, and where performance has been deteriorating.
3.1 Productive businesses and regions
| Measure | Current Performance |
|---|---|
| Productivity: Scotland's position on OECD productivity country rankings | 16th out of 37 countries |
| Innovation: Position on OECD gross expenditure on research and development rankings | 20th out of 37 countries |
| Business Innovation: Share of 'innovation active' businesses | 32.2% |
| Investment: Gross fixed capital formation as share of GDP | 15.8% |
Evidence presented in Section 2.2 showed Scotland's productivity in the last decade to 2018 has been subdued, and this is a pattern seen across most advanced economies.
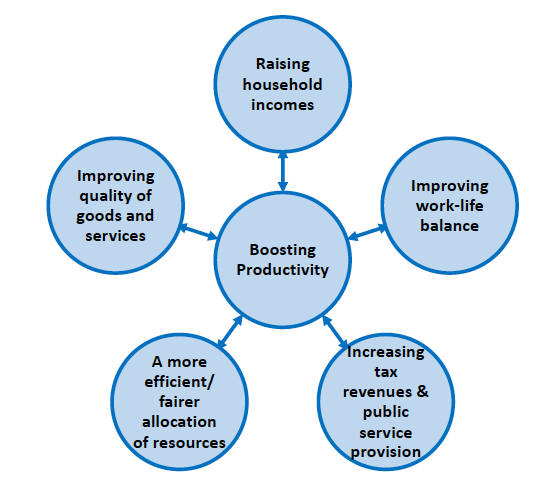
Productivity growth is not an end in itself. When delivered within a policy framework prioritising a broader set of economic, social and environmental wellbeing, productivity growth is an important enabler for the Scottish Government vision set out in the main NSET document.
The mechanisms through which rising productivity can contribute to delivering a wellbeing economy can be distilled into five main channels: raising household incomes; improving work-life balance; increasing tax revenues and public service provision; a more efficient and fairer allocation and use of resources; and, improving the quality of goods and services in the economy. This framework demonstrates that boosting productivity and delivering a wellbeing economy are important, interdependent and mutually reinforcing ambitions.
Source: Scottish Government
Notes:
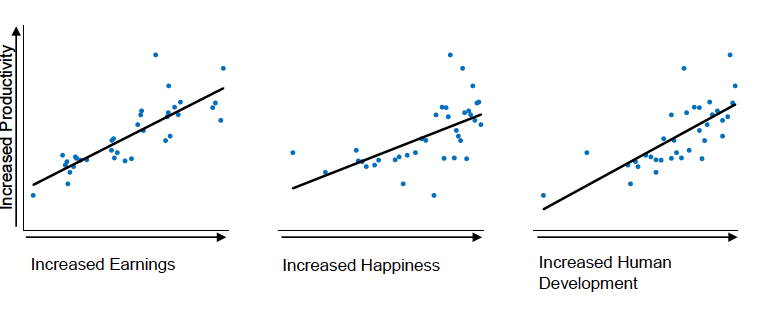
(1) Productivity – as measured by output per hour USD PPP. Source: OECD, 2019
(2) Earnings – as measured by average median annual earnings USD PPP. Source: OECD, 2019
(3) Happiness – UN World Happiness Index Ranking. Source: UNSDN, 2020
(4) Development – UN Human Development Index, based on measures including life expectancy and education. Source: UNDP, 2018
(5) Each chart plots the 37 OECD member countries
There is a positive relationship between productivity performance and weekly median pay (excluding overtime). Higher productivity sectors such as 'Information and Communication' and 'Manufacturing' have higher median weekly pay. This contrasts with lower productivity service sectors where median weekly pay is lower than average (not including non-market services – 'education' and 'health & social care'). It demonstrates the important positive impact that productivity performance has on incomes.
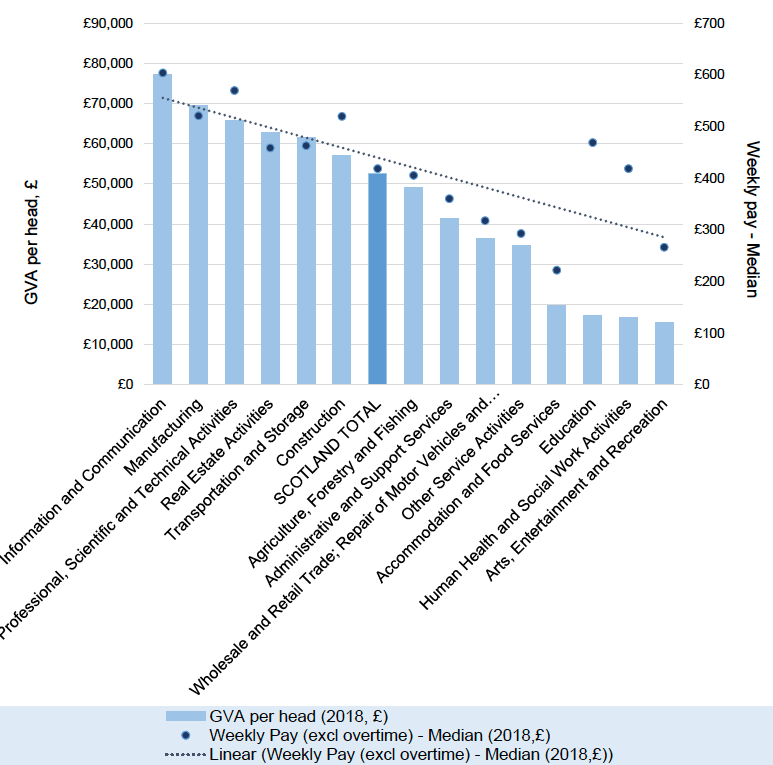
Source: Scottish Annual Business Statistics 2018, Annual Survey of Hours and Earnings 2018.
This relationship between productivity performance and pay is also evident across countries. In nearly every OECD country where productivity is above the Scottish level, annual average wages are also higher. On average, for every 1% increase in productivity, annual wages are around 0.8% higher. If Scotland's productivity matched that of the OECD top quartile, annual wages could be almost £3,850 or 10% higher. [8]
Figure 3.1.4 provides a more disaggregated picture of Scotland's productivity by industry. Business services, manufacturing and non-manufacturing production perform the strongest in terms of both productivity levels (above the Scotland average) and productivity growth over the last 20 years. As noted in Section 2, this is an important consideration for thinking about the structure of the economy and where to target effort to improve productivity.

Source: Scottish Annual Business Statistics 2018
The Scottish Annual Business Statistics shows that there is significant variations in productivity within sectors of the economy when split by sub-sectors and business size groupings. This is important for policy when deciding how to target interventions to raise productivity and in ways that will have the most beneficial impacts on wellbeing.
Figure 3.1.5 shows selected sectors of the Scottish economy and highlights their performance in terms of GVA and employment. The majority of the high productivity (with top 25% on productivity) tradeable sub-sectors are largely manufacturing industries. However, none of the high productivity tradeable sub-sectors are among Scotland's high employment sectors (with top 25% on employment). This would appear to indicate that the high productivity industries in Scotland are more 'niche'. Scotland's more tradeable services sectors such as 'Information Service Activities' and 'Telecommunications' also exhibit higher productivity than the mostly non-tradeable and localised services like 'Accommodation' and 'Food and Beverage Services.' These sectors tend to be both capital and knowledge intensive.
| Sector | Sub-Sector | High Employment | Low Employment | High Productivity | Low Productivity |
|---|---|---|---|---|---|
| Agriculture, Forestry and Fishing | Crop and animal production, hunting and related service activities | ✓ | |||
| Mining and Quarrying | Mining of Coal and Lignite | ✓ | ✓ | ||
| Extraction of Crude Petroleum and Natural Gas | ✓ | ✓ | |||
| Mining Support Service Activities | ✓ | ||||
| Manufacturing | Manufacture of Beverages | ✓ | ✓ | ||
| Printing and Reproduction of Recorded Media | ✓ | ||||
| Manufacture of Coke and Refined Petroleum | ✓ | ||||
| Manufacture of Chemicals and Chemical Products (3) | ✓ | ||||
| Manufacture of Basic Pharmaceutical Products and Pharmaceutical Preparations | ✓ | ||||
| Manufacture of Basic Metals | ✓ | ✓ | |||
| Manufacture of Computer, Electronic and Optical Products | ✓ | ✓ | |||
| Manufacture of Machinery and Equipment (not elsewhere classified) | ✓ | ✓ | |||
| Manufacture of Other Transport Equipment | ✓ | ||||
| Manufacture of Furniture | ✓ | ✓ | |||
| Repair and Installation of Machinery and Equipment | ✓ | ✓ | |||
| Water Supply, Sewerage, Wate Management and Remediation Activities* | Sewerage | ✓ | |||
| Waste Collection, Treatment and Disposal Activities; Materials Recovery | ✓ | ✓ | |||
| Remediation Activities and Other Waste Management Services | ✓ | ✓ | |||
| Construction | Construction of Buildings | ✓ | |||
| Transport and storage | Water Transport | ✓ | ✓ | ||
| Warehousing and Support Activities for Transportation | ✓ | ||||
| Postal and Courier Activities | ✓ | ||||
| Accommodation and food service activities | Accommodation | ✓ | |||
| Information and communication | Programming and Broadcasting Activities | ✓ | ✓ | ||
| Telecommunications | ✓ | ||||
| Computer Programming, Consultancy and Related Activities | ✓ | ||||
| Information Service Activities | ✓ | ||||
| Professional, Scientific and Technical Activities | Legal and Accounting Activities | ✓ | ✓ | ||
| Activities of Head Offices; Management Consultancy Activities | ✓ | ||||
| Scientific Research and Development | ✓ | ✓ | |||
| Other Professional, Scientific and Technical Activities | ✓ | ✓ | |||
| Administrative and support service activities | Employment Activities | ✓ | |||
| Travel Agency, Tour Operator and Other Reservation Service and Related Activities | ✓ | ✓ | |||
| Security and Investigation Activities | ✓ | ✓ | |||
| Services to Building and Landscape Activities | ✓ | ||||
| Education, human health and social work activities | Human Health Activities | ✓ | ✓ | ||
| Residential Care Activities | ✓ | ||||
| Social Work Activities Without Accommodation | ✓ | ✓ | |||
| Education, human health and social work activities | Human Health Activities | ✓ | ✓ | ||
| Residential Care Activities | ✓ | ||||
| Social Work Activities Without Accommodation | ✓ | ✓ | |||
| Arts, entertainment and recreation | Libraries, Archives, Museums and Other Cultural Activities | ✓ | ✓ | ||
| Gambling and Betting Activities | ✓ | ||||
| Sports Activities and Amusement and Recreation Activities | ✓ | ||||
| Other service activities | Activities of Membership Organisations | ✓ | ✓ | ||
| Repair of Computers and Personal Household Goods | ✓ |
Note: 'Water Supply, Sewerage, Water Management and Remediation Activities*' marked as the sector is incomplete due to disclosive information in SIC 36
Source: Scottish Annual Business Statistics (2018)
Scotland's productivity also varies by business size (Figure 3.1.6). While the estimated productivity levels for large businesses have overall declined since 2013 – partly driven by developments in the oil and gas industry, there remains a significant gap between smaller businesses (micro and small) and the medium and large businesses, with the former showing significantly lower levels of productivity. Thus, the dominance of micro and small enterprises in Scotland's business base shown in Section 2.7 will have a bearing on the economy's overall productivity performance.[9] Ensuring that micro and small businesses are maximising on their productivity potential could have transformational impact on the economy and wider wellbeing.
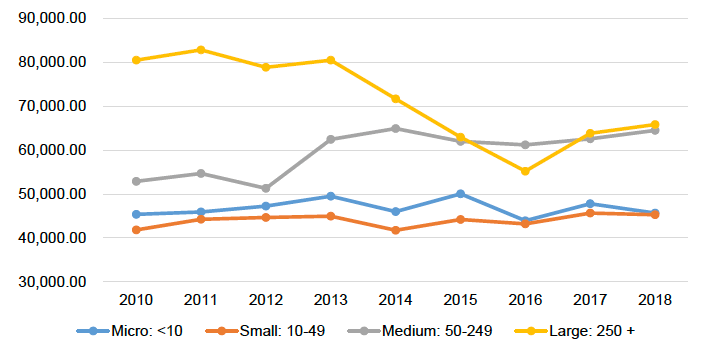
Source: Scottish Annual Business Statistics (2018)
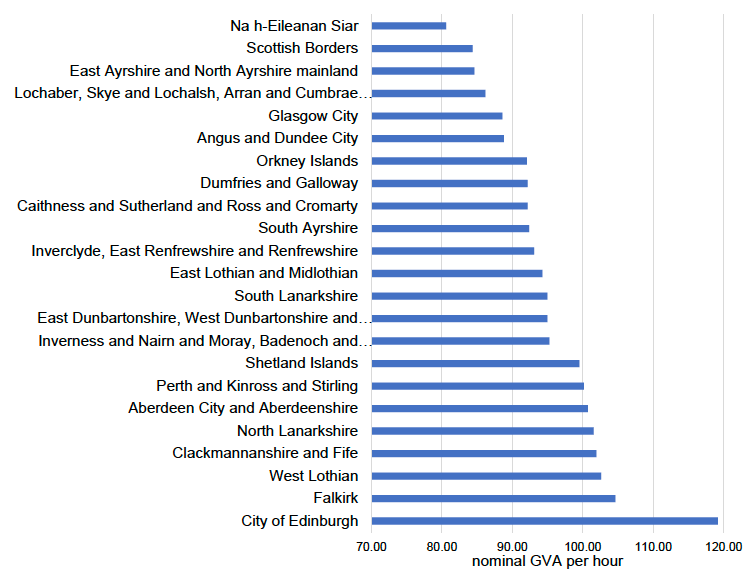
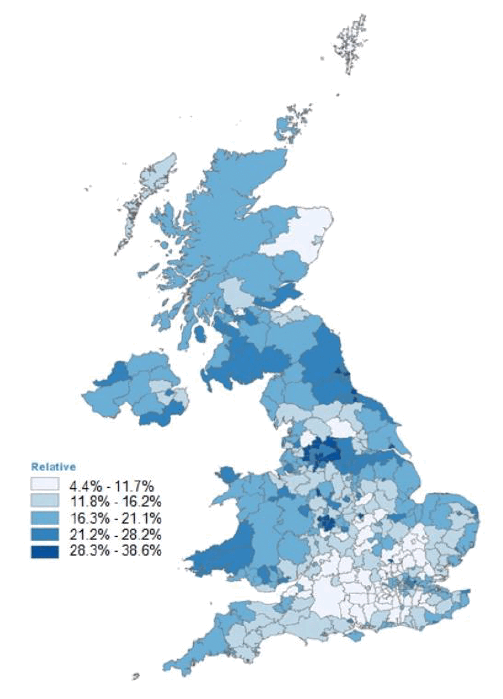
There are also differences in productivity across Scotland's regions (see Figure 3.1.7). City of Edinburgh is a notable outlier in terms of high hourly productivity. It is followed by Falkirk; West Lothian; Clackmannanshire and Fife; North Lanarkshire; Aberdeen City and Aberdeenshire; and, Perth and Kinross and Stirling in achieving rates above the UK as a whole. Glasgow City achieved just 88.6% of the UK's overall productivity despite being a large urban area. A recent report by the Centre for Cities suggested that Glasgow was facing a gap of £7 billion between its productive potential and actual GDP.[10]
The key drivers for productivity – innovation and technology; investment; and, digital and transport connectivity are looked at in the reminder of this section.
3.1.1 Innovation and technology
There are various measures for tracking innovation in the economy – from looking at expenditure on research and development, to prevalence of innovation activity in the business base.
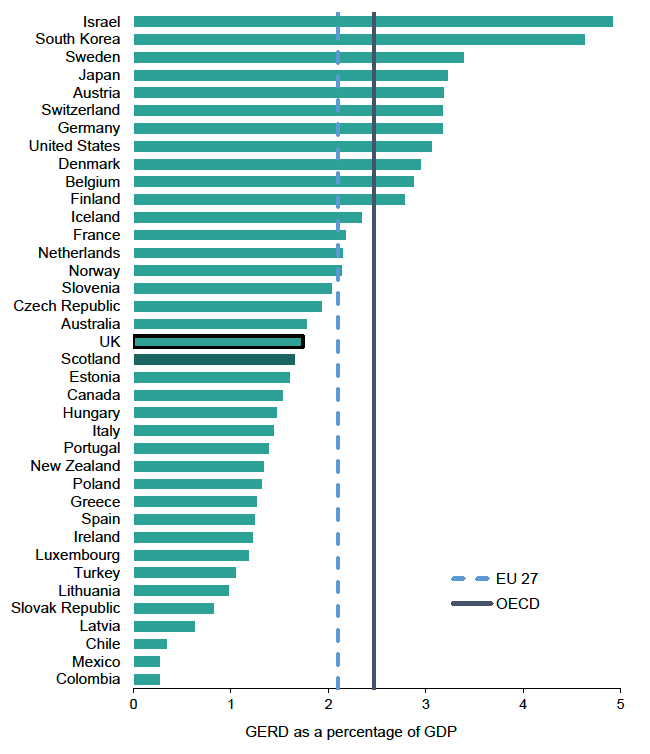
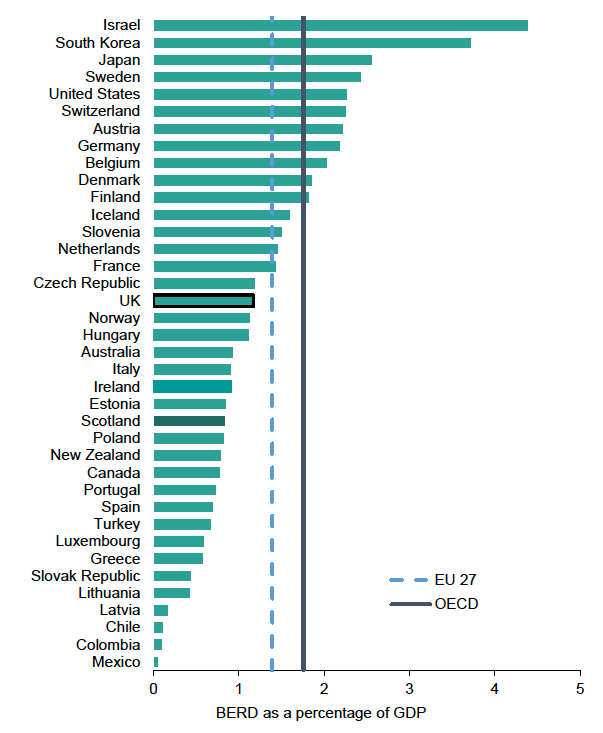
Scotland's Gross Expenditure on Research and Development (GERD) was £2,789 million in 2019 – an increase of 0.4% in real terms from 2018. In 2019, Scotland's GERD represented 7.2% of the UK total and 1.66% of Scotland's Gross Domestic Product (GDP). As a percentage of GDP, it ranked in the third quartile of the OECD countries (see Figure 3.1.8), below the UK (1.74%), the EU (2.10%) and the OECD (2.47%).
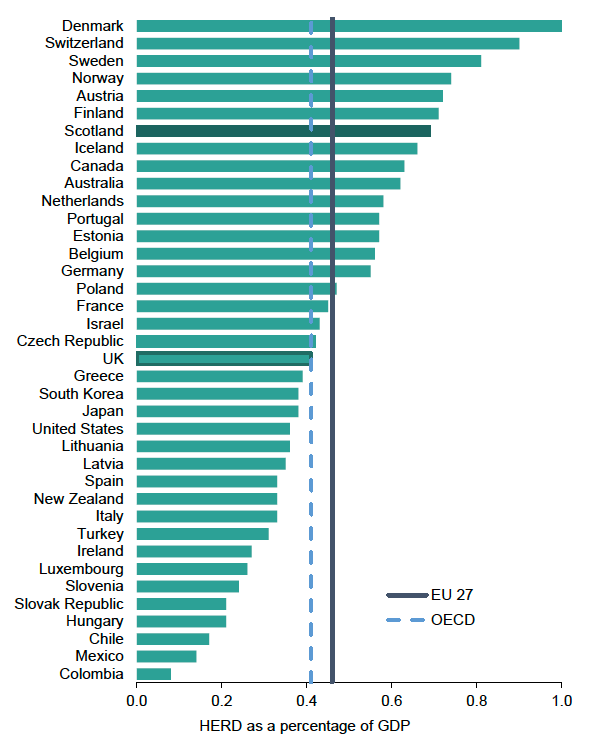
There are two components of GERD: Business Enterprise Research and Development (BERD) spend and Higher Education Research and Development (HERD) spend. Compared to most other OECD countries, Scotland's HERD spend makes up a relatively large proportion of total GERD.
Scotland's HERD spend was £1,150 million in 2019 – down 0.3% in real terms from 2018. In contrast the UK's HERD increased by 1.3% over this period. As a percentage of GDP it was 0.69%, compared to an OECD average of 0.41% (see Figure 3.1.9). Scotland ranked seventh among the OECD countries for HERD spend as a percentage of GDP, putting it in the first quartile, in contrast to the UK's position in the third quartile.
The latest data shows that BERD spend in Scotland decreased by 6.1% in real terms between 2019 and 2020. However, the timing of major research projects undertaken by a few large firms can cause fluctuations in the overall levels of business R&D. This is particularly important for 2020 given that some companies may have paused research projects because of the pandemic. BERD employment is a more stable measure of business R&D performance, and latest data shows that BERD jobs in Scotland increased by 9.0% between 2019 and 2020 – taking BERD jobs in Scotland to the highest level in the series back to 2001.
Figure 3.1.9 - Higher Education Expenditure on Research and Development across the OECD
Looking over the longer term, Scotland has experienced relatively strong growth in BERD spend and is on course to meet its target of doubling BERD spend between 2015 and 2025. However, Scotland's BERD spend is still relatively low compared with other countries (see Figure 3.1.10). At 0.84% of GDP, Scotland's BERD spend as a percentage of GDP ranked in the third quartile of the OECD countries in 2019, well below the EU and OECD averages, which are 1.39% and 1.76% respectively.
The above evidence suggest Scotland potentially faces some challenges with aligning its higher education and business and enterprise research and development activities. There is scope for HERD to help leverage additional BERD if Scotland is to improve on its overall ranking within the OECD on GERD.
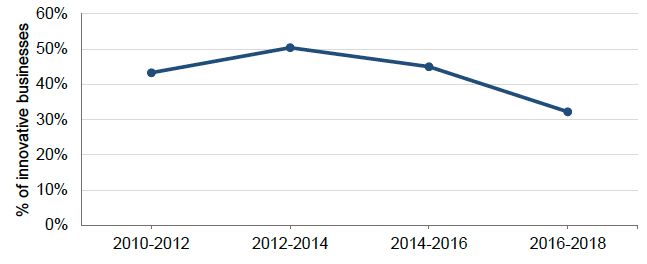
The National Performance Framework tracks the level of innovation activity within Scotland's business base. The share of 'innovation active'[11] businesses in Scotland in 2016-2018 was 32.2%, a decrease from 50% in 2015 (see Figure 3.1.11).
Source: UK Innovation Survey (UKIS)
Recent ONS research[12] using firm-level survey data found that firms with a higher management practice score were significantly more likely to undertake R&D. When controlling for other factors, moving a firm from median management practice to the upper quartile had roughly the same effect on the probability of being R&D active as moving a firm from domestic to foreign ownership. Additionally, it showed that the relationship between productivity and R&D is significantly stronger for firms with a higher management practice score.
The ONS research suggests Scotland's businesses perform favourably on management practices, with Scotland ranked joint-highest among all UK regions, along with the South East of England. It suggests Scotland has improved significantly since 2016, where it was the joint least performing region with the North East of England.
While innovation policy tends to focus on how best to encourage businesses to undertake research and innovate themselves, it is important to consider how best to empower businesses to adopt existing innovative technologies and practices. The Finnish innovation agency (Business Finland) uses a similar approach, which may prove effective in aiding the 'long tail' of low productivity firms.[13] This is important, because general-purpose technologies such as electricity in the 19th-20th Century and digital technologies in the 21st Century have tended to diffuse slowly despite obvious benefits. If technological diffusion takes a long time, it can slow-down productivity growth because of the impact of 'laggard firms' on the performance of the overall economy.
Researchers at Aston Business School have looked at the drivers and barriers to technology adoption for SME firms. Some of the key drivers for technology adoption that have been identified in this work are: agile and lean decision making, work optimisation planning, business competitiveness, employee training activities, and pro-active decision-making. Some important barriers to technology adoption they identify include: a lack of talent and knowledge management, poor skills development, limited finances, technology friction, a lack of systematic strategy, a lack of dissemination of successful business practices, and a lack of adequate technical infrastructure.
3.1.2 Investment
Private capital investment promotes the creation of new businesses and helps existing businesses to grow and improve competitiveness. At the same time, public led investment in infrastructure helps businesses to operate more efficiently, in turn increasing productivity. Investment can create high quality jobs and improve wellbeing.
3.1.2.1 Gross fixed capital formation
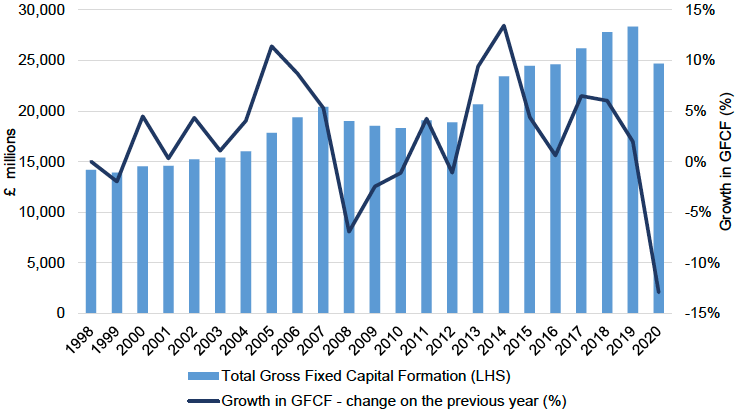
Figure 3.1.12 shows recent trends in Scotland's gross fixed capital formation (GFCF), and Figure 3.1.13 Scotland's ranking among OECD countries. The average annual growth in GFCF over the most recent ten years for which data are available is 2.6%. However, it fluctuates from year-to-year reflecting the lumpy nature of some investments.
Source: Quarterly National Accounts Scotland
Scotland's GFCF as a share of GDP is low when compared to other OECD countries. Latest figures put Scotland's GFCF as a share of GDP at 15.8% in 2020, compared to an OECD average of 23%. Relative to the UK, Scotland has seen the gap in investment close in recent years, although the UK as a whole suffers from relatively low levels of investment.
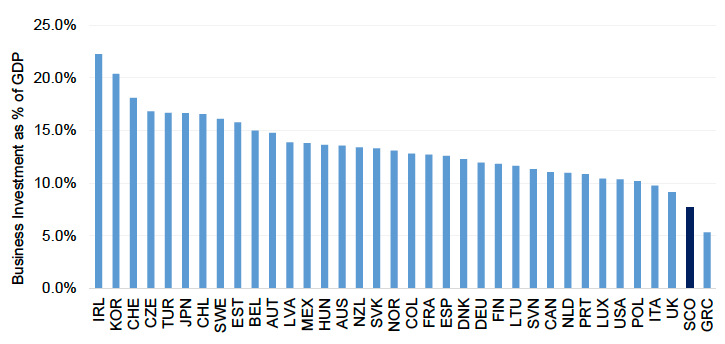
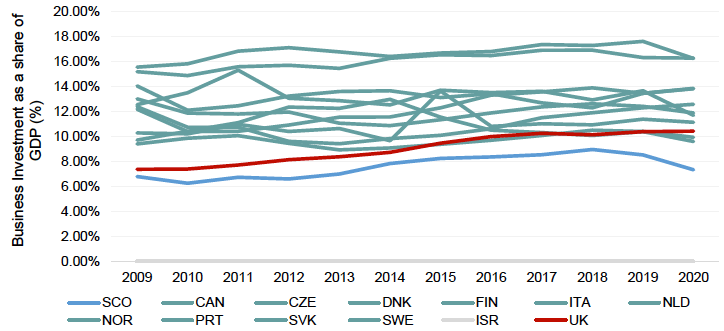
3.1.2.2 Business Investment While Scotland's business investment as a share of GDP has increased over the past decade, from 6.7% in 2011 and peaking at 9% in 2018, this figure remains low by OECD standards. Since 2018, it has however fallen for the past two consecutive years and is currently around 7.5%. Figure 3.1.14 shows how Scotland compares with other small advanced economies on business investment growth (where data is available).
Figure 3.1.14 - Business Investment as a share of GDP (%) – select OECD countries
Source: Quarterly National Accounts Scotland, ONS, OECD
In recent years, Scotland's business investment growth has been broad-based, driven by growth across most sectors of the economy – with increases in primary industries, manufacturing, business services, accommodation and distribution. Production sectors (manufacturing and primary industries) accounted for a disproportionately large share of business investment in 2019 (45%) compared to their share of Scotland's overall gross value added (19%), reflecting the capital-intensive nature of these sectors. The services sectors accounted for 53% of business investment in 2019, compared to 75% of Scotland's overall gross value added.
Source: Quarterly National Accounts Scotland, ONS, OECD
Scotland outperforms most other regions of the UK on foreign direct investment (FDI). For the last six years, Scotland has secured the most inward investment projects of any UK nation or region outside of London. However, compared to other OECD countries, there is scope to attract more global capital into business growth, infrastructure and commercial property. Scotland needs to close the gap in FDI flows as a share of GDP.
Scotland's FDI deals are mostly concentrated in a few sectors – 'business services', 'digital and IT' and 'technology and engineering'. In addition, Edinburgh, Glasgow and Aberdeen have accounted for the larger share of inward investment over the period 2015-2020. Together, these cities account for more than 50% of Scotland's inward investment projects, reflecting largely their share of Scotland's business base.[14] More detailed analysis of Scotland's FDI performance is available in methodology paper accompanying Scotland's Inward Investment Plan.[15]
| 2016 | 2017 | 2018 | 2019 | 2020 | |
|---|---|---|---|---|---|
| Aerospace and Satellites | 3 | 6 | 1 | 2 | 7 |
| Business Services | 101 | 159 | 137 | 174 | 160 |
| Digital & IT | 147 | 200 | 201 | 223 | 230 |
| Energy – Other | 19 | 20 | 20 | 20 | 21 |
| FinTech | 11 | 16 | 13 | 19 | 24 |
| Food & Drink | 40 | 50 | 64 | 50 | 56 |
| Life Sciences | 34 | 58 | 47 | 61 | 59 |
| Oil & Gas | 9 | 20 | 15 | 24 | 25 |
| Renewables | 16 | 21 | 15 | 22 | 16 |
| Technology & Engineering | 82 | 141 | 109 | 156 | 144 |
| Other | 24 | 32 | 26 | 29 | 36 |
The broad measures of business investment used above are a good barometer of overall investment activity in Scotland across business growth, new assets and changes of business ownership. Investments into high growth businesses in Scotland provides a more specific measure of performance in 'risk capital'.
Scotland performs relatively well in the risk capital market. In 2019, Scotland recorded the highest number of deals on record (285 deals), an increase of 13% on the previous year. These deals were worth a combined £542 million. However, the value of equity investment deals varies significantly year-on-year as risk capital flows are dependent on a few large investments. Digital, IT and life sciences dominate Scottish investment, together accounting for half of Scottish deals in 2019. Scotland has a strong angel investment due to 'the Scottish model' of business angel syndicates investing alongside public sector.
Further analysis of Scotland's performance in attracting risk capital and implications for business growth, infrastructure investment and real estate is contained in the Global Capital Investment Plan (GCIP).[16]
3.1.2.3 Public Sector Investment
Source: Scotland - Quarterly National Accounts Scotland, OECD
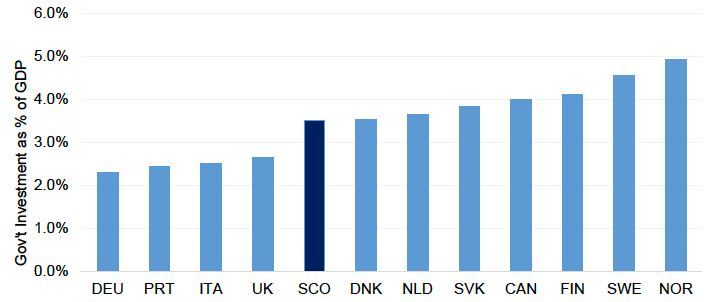
Public sector investment has increased by an average of 4.6% each year over the past decade. As a share of GFCF, it has also increased from around 18% in 2000 to 27% in 2020. Scotland performs relatively well in terms of public sector investment as a share of GDP when compared to other countries.
Latest comparable data shows that Scotland's public sector investment, as a share of GDP remained broadly stable over the past 10 years. Data for 2020 shows that while business investment and total gross capital formation fell, public sector investment increased, both in value terms and as a share of GFCF and GDP.
3.1.2.4 Scotland Business Investment Prospects Post-COVID-19 Pandemic
In response to the COVID-19 pandemic and its significant impact on the economy, the UK Government introduced a package of support in 2020 designed to improve access to- and reduce the cost of finance for UK businesses. This included a range of government-backed loans and finance agreements for businesses. A third (34%) of Scottish businesses used these. Data shows SME lending spiked from Q2 of 2020, driven mainly by increased COVID-19 related lending to small businesses.
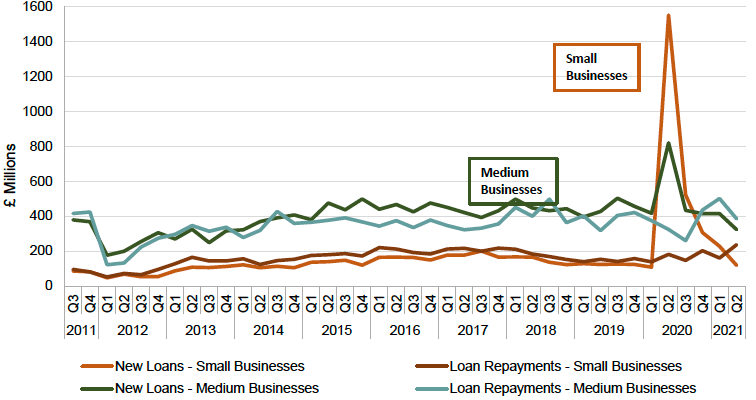
Source: UK Finance
While the debt taken on by businesses during the pandemic may have been crucial in helping them survive, the relaxed affordability checks presents future risk, there are concerns about businesses' ability to repay and the impact it will have on business investment and future growth.
In Q2 of 2021, 22% of SMEs in the UK using finance were concerned about their ability to repay, increasing to 30% of those borrowing for the first time. Concern about ability to pay decline by size of SME, and businesses in Hospitality, Manufacturing and Transport were the most concerned about meeting the repayments on current borrowing.
3.1.3 Infrastructure: Digital Connectivity
Digital technology is a source of opportunity and potential for businesses to open new markets. It enhances productivity, allows for timesaving and frees up resources, which in turn drives business growth across every sector of the economy. It is also widely recognised as drivers of innovation and international trade.
Evidence supports the link between digital technologies and enhanced business performance. The Digital Economy Business Survey (DEBS)[17] 2021 evidence shows that 31% of businesses report that digital technology had a significant impact on their productivity over the last 12 months. About a quarter (23%) saw a moderate impact on their business productivity, while 17% reported a slight impact and 26% reported no impact at all.
The influence of digital technologies on productivity is particularly noticeable in larger businesses and in particular sectors. Larger businesses were more likely to report a productivity impact from digital technologies than smaller businesses. The sectors most likely to report a significant productivity impact included Business Activities (43%), Health/Social Work (42%) and Other Services (41%). Those likely to report no impact included Transport and Communication (41%), Construction (38%) and Agriculture (33%).
Source: Digital Economy Business Survey, 2021
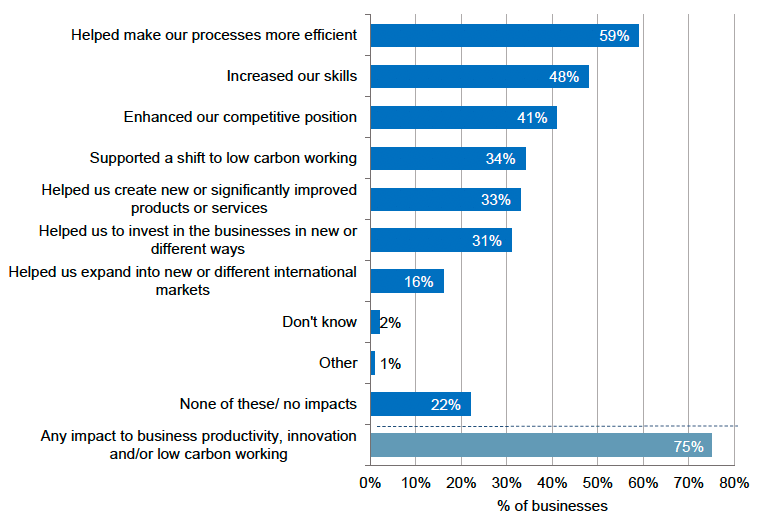
Figure 3.1.18 shows that digital technologies impact productivity in different ways. A third of businesses reported that digital technology helped them to create new or significantly improved products or services. It also made business processes more efficient (59% of businesses), increased skills (48%) and enhanced competitiveness (41%).
3.1.3.1 Digital Infrastructure
Digital infrastructure is a fundamental requirement for a modern advanced economy alongside the effective use of digital technologies. A key pillar of digital infrastructure is fast and reliable broadband access. Future economic transformation will depend on improvements in this infrastructure, particularly with the emergence of new technologies such as artificial intelligence, the internet of things and 5G.
In 2020, 81% of commercial premises in Scotland had access to superfast broadband (minimum download speed of at least 30 Mbit/s).[18] Residential premises have also seen significant growth in superfast broadband coverage in recent years, with access reaching 94% of Scottish homes in 2020, up from 92% the previous year.
| % of Residential Premises | % of Commercial Premises | |||||
|---|---|---|---|---|---|---|
| Superfast Coverage | Full Fibre Coverage | Gigabit Capable | Superfast Coverage | Full Fibre Coverage | Gigabit Capable | |
| Scotland | 94% | 20% | 44% | 81% | 9% | 23% |
| England | 96% | 19% | 36% | 84% | 17% | 26% |
| Northern Ireland | 90% | 63% | 69% | 83% | 35% | 43% |
| Wales | 94% | 21% | 28% | 82% | 13% | 17% |
| UK | 98% | 21% | 37% | 84% | 16% | 26% |
Source: Ofcom Connected Nations Interactive Dashboard Spring 2021 (all data as of Jan 2021)
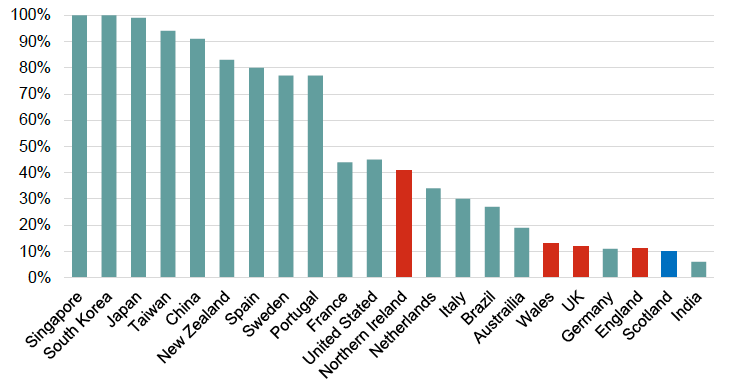
Full fibre infrastructure offers a degree of future proofing in digital connectivity, and can offer download speeds of up to 1,000 Mbit/s. Over 14,900 commercial premises (9% of total) in Scotland now have access to full-fibre broadband, an increase of 6,300 premises (77%) on the previous year. Over 517,000 residential premises (20% of total) in Scotland also now have access to full-fibre broadband, with coverage growing 90% on the previous year (See Table 3.1.2). Despite significant developments in Scotland's full fibre network, data suggests that rollout in Scotland (and the UK as a whole) lags behind a number of other nations (Figure 3.3.22)[19].
Source: Eurostat
Mobile connectivity is also an integral part of Scotland's digital infrastructure. Mobile coverage has increased significantly in Scotland in recent years, with 2.2 million indoor premises (81%) now covered by all mobile 4G operators (Table 3.1.3). This represents an increase of 1% compared the previous year, and 20% compared to three years ago. Scotland also shows strong performance when compared with other UK regions.
| Scotland | 81% |
|---|---|
| England | 81% |
| Northern Ireland | 65% |
| Wales | 73% |
| UK | 80% |
Source: Ofcom Connected Nations Spring Update 2021
However, a much greater proportion (19%) of Scotland's landmass is currently without 4G coverage compared to 3% in England and Northern Ireland, and 10% in Wales (Table 3.1.4). This reflects the difficulties of connecting hard-to-reach locations across Scotland, particularly given Scotland's disproportionate share of the UK's total landmass.
| Proportion of Landmass without 4G Coverage | |
|---|---|
| Scotland | 19% |
| England | 3% |
| Northern Ireland | 3% |
| Wales | 10% |
Source: Ofcom Connected Nations Annual Report 2020
3.1.3.2 Digital Adoption
The benefits of digital technologies are realised only if businesses are taking up available technologies. Evidence shows that the discovery of new technologies is not sufficient to boost productivity, without their adoption by businesses and diffusion across the economy.[20] Section 3.1.1 has already highlighted the importance of digital adoption in driving productivity growth, particularly among the long tail of low productivity businesses in the Scottish economy.
Source: Digital Economy Business Survey, 2021
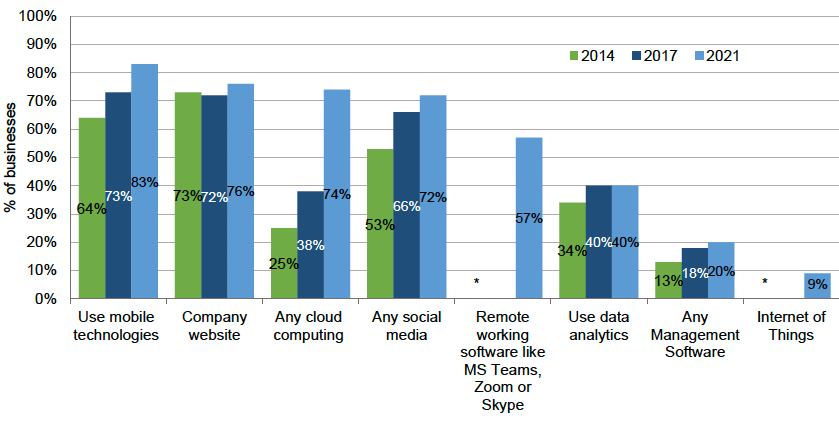
Evidence suggests that businesses in Scotland have increasingly been deploying a number of digital technologies to improve business performance. As of Quarter 1 of 2021, the most widely adopted digital technologies were mobile technologies (83%), company websites (76%) and cloud computing (74%). The use of most digital technologies has increased over time. (Figure 3.1.20).
A relatively small proportion of businesses (2%) did not use any of the technologies listed in Figure 3.1.20, with most (65%) reporting the technologies were not relevant to the business (65%). Other reasons include preference for current business models like face-to-face interaction (11%), lack of understanding of IT (10%) and lack of skills in the organisation (5%).
The Digital Economy Maturity Index (DEMI),[21] a more holistic measure of digital adoption show that overall digital capability remains very low among Scotland's businesses. The DEMI shows that in 2021 72% of businesses in Scotland fell into the bottom half of the index scale. These businesses have minimal, basic or intermediate level of digitisation.
Lower levels of digitisation based on the DEMI are particularly prominent in smaller businesses and in sectors like agriculture, construction, transport and communication. There are also regional variations in the index – for example, businesses in the South of Scotland were more likely to fall within the least mature segment.
3.1.3.3 Barriers to Digital Adoption
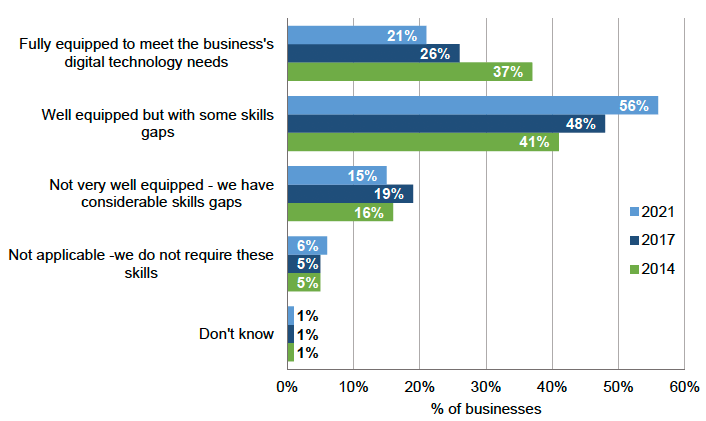
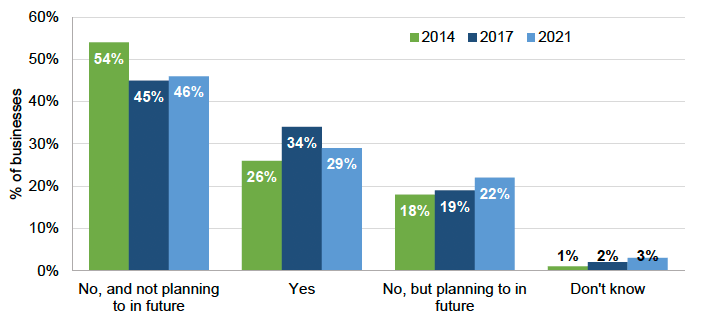
Despite the potential for digital technology to improve business performance, it is clear that there are barriers to businesses adopting these technologies. Foremost among these barriers is skills. Digital skills are essential if businesses are to benefit from digital adoption. However, only 1 in 5 Scottish businesses felt fully equipped with digital skills in 2021 and 15% reported that they were not very well equipped and had considerable skills gaps (Figure 3.1.21).
Source: Digital Economy Business Survey, 2021
The proportion of businesses that feel their staff are 'fully equipped' to meet their digital technology needs has decreased since 2014, though the proportion that feel staff are 'well equipped' is increasing. Businesses in particular sectors, such as Agriculture and Hotels/Restaurants, were particularly likely to report considerable skills gaps in 2021.
Source: Digital Economy Business Survey, 2021
The commonly cited areas of skills gap include basic technology skills, like email, internet navigation, Microsoft Office applications (26%), cyber security skills (11%), software skills (10%), web development skills (5%) digital marketing (6%), general business and commercial skills (5%) and coding skills (4%). About 14% of businesses reported that they are 'poorly' or 'not at all' equipped with the relevant skills to protect against and deal with cyber security threats.
While many businesses reported skills gaps, 46% of those surveyed were 'not taking' or 'planning to take' any action to address digital skills gaps. Amongst businesses with relevant skills gaps who were not taking action to address them, the most commonly cited barriers include 'resource or time constraints', and costs. Of the businesses that reported skills gaps, 23% were not able to identify specific skills for improvement, highlighting some knowledge barriers.
3.1.4 Infrastructure: Transport Connectivity and the Economy
The transport system in Scotland is an important enabler of economic activity. Evidence shows that the efficiency, reliability and quality of transport system is an important driver for business productivity.[22],[23] It reduces barriers to employment,[24] connects people (workers and customers) to areas of economic activity and allows businesses to access their markets – domestic and abroad, in turn supporting international trade, including tourism.[25]
An efficient transport system contributes to creating agglomeration benefits,[26] which is another driver for performance of our local economies. Transport also affects other aspects of people's wellbeing – social outcomes and the environment, including climate. The National Transport Strategy (NTS2) has four priorities to capture the various impacts of transport on wellbeing:
Reduces inequalities
- Will provide fair access to services we need
- Will be easy to use for all
- Will be affordable for all
Helps deliver inclusive economic growth
- Will get people and goods where they need to get to
- Will be reliable, efficient and high quality
- Will use beneficial innovation
Takes climate action
- Will help deliver our net-zero target
- Will adapt to the effects of climate change
- Will promote greener, cleaner choices
Improves our health and wellbeing
- Will be safe and secure for all
- Will enable us to make healthy travel choices
- Will help make our communities great places to live
This section focuses on the performance of Scotland's transport system with respect to the economy. Section 3.1.4 presents transport policy challenges with respect to the climate emergency.
3.1.4.1 Passenger Transport
Road
Cars or vans account for the majority of passenger journeys in Scotland, despite the longstanding need to shift to active and public transport. In addition to contributing to sustainability objectives, public or active transport contributes to stronger economic performance by reducing congestion. It offers a more efficient and sustainable means of connecting people to work and other places of economic activity.
Figure 3.1.23 shows that the proportion of people travelling to work by public transport and active travel has remained reasonably stable in the ten years to 2019. Bus passenger numbers have declined while rail passenger numbers have increased. More recently, the Covid19 pandemic has negatively affected public transport demand, and expectations are that it will take several years to return to pre-pandemic levels.
Source: Scottish Household Survey
The quality of services affects the use of public transport. Figure 3.1.24 shows that while the majority of adults report that they are 'very or 'fairly satisfied' with public transport, this declined from 75% in 2014 to 65% in 2018. The first year to see a reversal in this trend since 2014 is 2019.
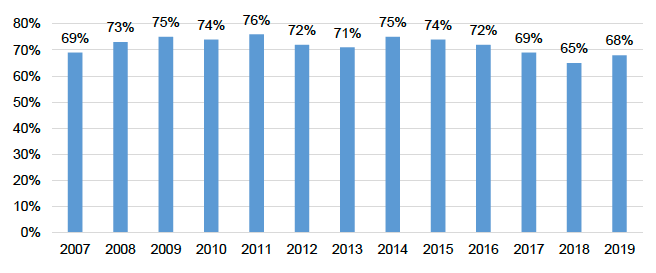
Source: Transport and Travel in Scotland
Figure 3.1.25 compares Scotland's reliance on the car for passenger transport with EU countries. Scotland has a slightly higher percentage of passenger kilometres by car when compared to the EU average, although lower levels of car use in some countries could reflect lower incomes limiting car ownership. In some instances, physical and human geography will also be a factor. However, the data still shows that it is possible to have a relatively low level of reliance on the car while retaining higher levels of productivity and wellbeing, like in Belgium, Denmark and Ireland.
Source: Eurostat, Scottish Transport
Rail
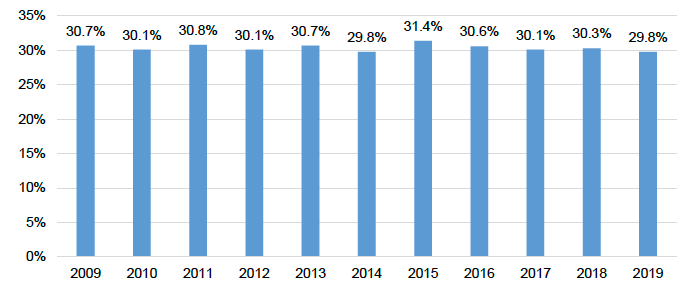
The density of rail networks (rail network kilometres per 1000 square kilometres and rail network kilometres per 1000 of population) is used to compare Scotland's passenger rail transport with other countries. Figure 3.1.26 shows that Scotland has a low rail network density (per 1000 square kilometres) than the EU and UK average. This is partly because of large areas of Scotland with very low population density when compared to many EU countries with high rail density who overall have high population density across most of their territories.
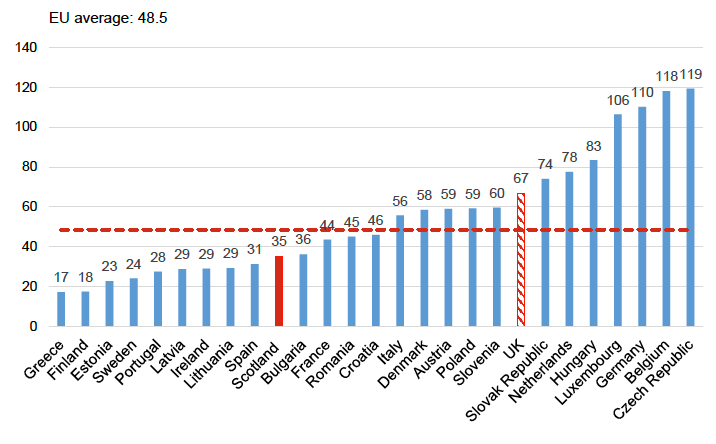
Source: Scottish Transport Statistics
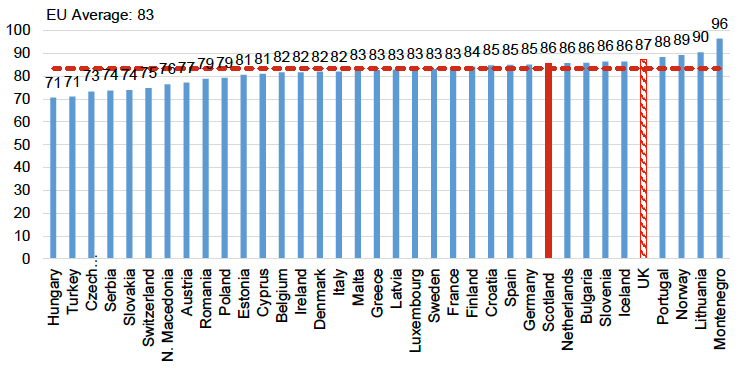
On a population basis (per 1000 of population, see Figure 3.1.27) Scotland's rail network appears to be slightly denser than the EU and UK averages. This partly reflects Scotland's population distribution; and the fact that accessing more remote locations increases the required length of the rail network for a given population size.
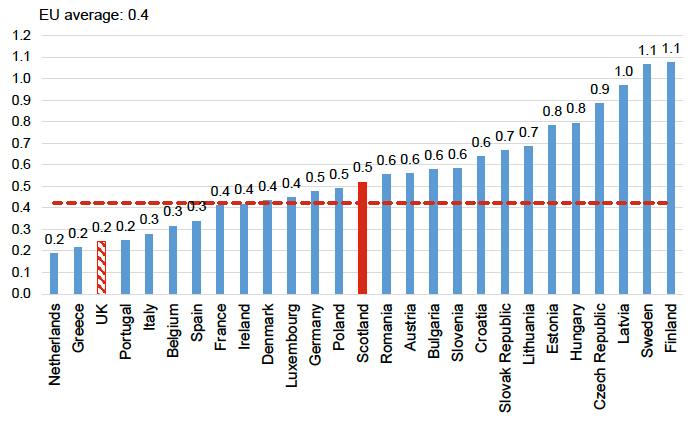
Source: Analysis of Scottish Transport Statistics
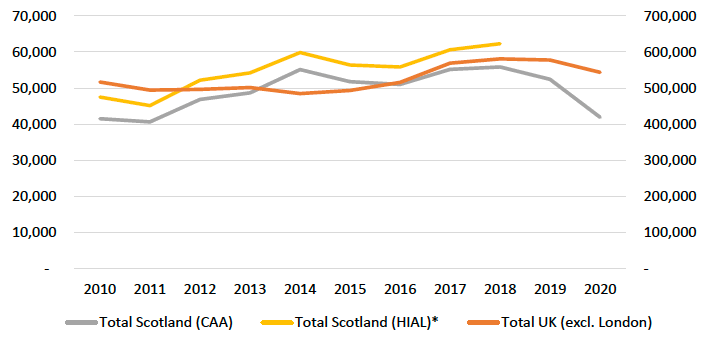
Aviation
Scotland's international, national and regional air connections are important for the economy. Aviation allows people to visit Scotland – benefiting the tourism industries, and businesses to seize new opportunities in international markets. Scotland's higher education sector welcomes learners from across the globe. For many of Scotland's remote and island communities, local air services are a vital lifeline, allowing travel to and from the mainland for business, tourism, leisure, and access to health and other public services.
In 2019, 28.9 million passengers passed through Scottish airports, and the number of aircraft movements totalled 478,000.[27] In 2019, air travel to Scotland was possible from 79 unique destinations for short-haul travel and from 10 unique destinations for long-haul travel. Of the 3.5 million overseas visitors to Scotland in 2019, 1.9 million arrived using Scottish airports.[28]
3.1.4.2 Freight Transport
Scotland has trade links with 105 countries across nearly 100 different industries and sectors. Scotland's key exports include petroleum, petroleum products and related materials, food and drink and power generating machinery and equipment. For a detailed analysis, see Transporting Scotland's Trade.[29] Within Scotland, the trunk road network operated by Transport Scotland is crucial for national and local delivery of goods, with 70% of heavy goods vehicles (HGV) vehicle kilometres being on trunk roads.
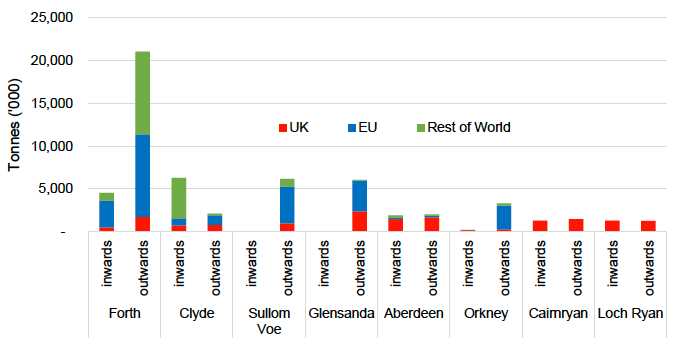
There are eight "major" port areas in Scotland that handle over a million tonnes of cargo per year and for which official statistics are collected. However, the Forth is by far the largest port in Scotland and handles the majority of Scotland's international exports (by weight).
| Port | Major Activity |
|---|---|
| Aberdeen | Oil products and some domestic general freight |
| Cairnryan | Ferries to Northern Ireland |
| Clyde | Oil imported from Russia, Norway, USA, Nigeria etc. Oil product exports and other cargo to mostly Europe & north Africa |
| Forth | Handles more liquid bulk cargo than any other UK port except Milford Haven, largely exporting oil products to Netherlands & China |
| Glensanda | Ships quarried granite and aggregates mostly to Germany, Netherlands & UK |
| Loch Ryan | Ferries to Northern Ireland |
| Orkney | Dominated by oil exports to Germany, Netherlands, China, Plus some ferry traffic |
| Sullom Voe | Dominated by oil exports to Netherlands and other UK ports |
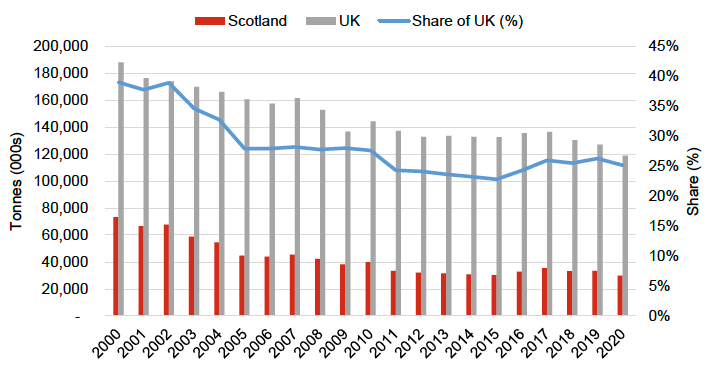
In 2020, Scottish ports accounted for 25.1% of all UK major port outbound traffic by volume and 4.4% of all UK major port inbound traffic by volume. Crude oil exports – with crude oil making up 80.3% of all exports, skews the outbound figure. There are other heavy but low value items such as granite bulk particulates from Glensanda.
Source: Department for Transport
Source: Department for Transport port freight statistics
Overall, Scotland is heavily reliant on ports in England, especially the Channel ports/tunnel, as it represents the most effective route to/from continental Europe for a wide range of industries. Whilst air transport is faster for some routes to/from Scotland, it is also expensive - typically priced 4–5 times per kg more than road transport and 12–16 times per kg on sea transport. As a result, most cargo to the EU travels by sea or sea/road.
Ports also serve other functions beyond handling cargo. They also host offshore industries such as energy and fishing. They also offer key infrastructure nodes for passengers to reach certain parts of the country. Ferries to Scottish islands carry 40% of the UK's domestic sea passenger traffic,[30] and the sea connections to Northern Ireland carry 8% of domestic passenger traffic and 85% of sea passengers between Northern Ireland and the island of Great Britain.
Airfreight accounts for a very small amount of total freight lifted from Scotland, almost 60,000 tonnes in 2019. However, goods tend to be of a higher value and are more time-sensitive than those transported by sea. The last available figures for 2020 show that freight carried by air totalled 41,938 tonnes.
3.1.5 What the evidence tells us we need to address:
This section has provided evidence on Scotland's productivity performance and its drivers. It has shown that:
Overall Productivity Performance
- Scotland's productivity performance, while overall subdued over the last two decades, varies significantly across and within sectors, and across business size bands, with productivity growth largely occurring in higher productivity sectors (manufacturing and internationally tradable services. To shift the dial on productivity across the whole economy we need to maintain rates of productivity growth in currently high performing sectors and also increase performance in the traditionally low productivity services sectors.
NSET responds to this evidence through the following Projects:
- Project 9: Upskill Business and Public Sector Leaders, Pioneering New Approaches to Driving Productivity Improvements
- Project 10: Realise the Potential of the Different Economic and Community Assets and Strengths of Scotland's Regions
- A National Mission with Local Impact: Infrastructure Investment Plan for Scotland 2021-22 to 2025-26
Research & Development and Broader Technology Adoption
- Scotland still suffers from very low levels of business R&D spend, although there has been recent improvements. This is in contrasts with Scotland's strong performance on higher education R&D spend.
- There is scope to improve business management practices and to build their capacity for productivity enhancing business models. This includes policies to encourage a culture of entrepreneurship within the existing business base by building experimental and innovative capacity, and facilitating peer to peer learning between businesses.
- There is need to tackle a wide range of barriers to businesses adopting and making the most effective use of existing technologies. This will go a long way in improving the productivity performance of many businesses.
NSET responds to this evidence through the following Projects:
- Project 9: Upskill Business and Public Sector Leaders, Pioneering New Approaches to Driving Productivity Improvements
- Project 8: Improve Connectivity Infrastructure and Digital Adoption Across the Economy
Investment
- Recently, Scotland has performed well at attracting foreign direct investment projects, and has a strong angel investment market due to 'the Scottish model' of business angel syndicates investing alongside the public sector.
- Scotland's capital investment, measured by Gross Fixed Capital Formation (GFCF) as a share of GDP is low by OECD standards. Scotland's public sector investment as share of GDP is higher than the UK's, and compares favourably to other OECD countries, although there remains a gap to close on the better performing countries like Norway.
- Scotland's business capital investment rates are significantly lower than comparable countries. The pandemic may have exacerbated this challenge due to impact on business balance sheets and ongoing economic uncertainty.
NSET responds to this evidence through the following Projects:
- Project 7: Attract and Deploy Significant Domestic and International Private Investment in Scotland
- Shaping Scotland's Economy: Inward Investment Plan
- Investing with Purpose: Global Capital Investment Plan
- A National Mission with Local Impact: Infrastructure Investment Plan for Scotland 2021-22 to 2025-26
Digital Infrastructure and Technology
- While there has been progress to support digital transformation through enhanced broadband and mobile coverage via programmes including Reaching 100 (R100) and the Scottish 4G Infill (S4GI) Programme, Scotland's levels of connectivity still lag behind many other European countries, particularly when considering full fibre
- The adoption of most key digital technologies, such as mobile technologies and cloud computing, has increased in recent years. However, the digitisation of Scottish businesses is relatively low on average and there is scope to increase further the adoption of many digital technologies to improve economic performance.
- Barriers to digital adoption and readiness exist, particularly in digital skills development, meaning many businesses are not fully embracing digital technologies to enhance their productivity. This is important as digital adoption is a continuous process where deployment of modern technology and development of skills should be a constant of business evolution.
NSET responds to this evidence through the following Projects:
- Project 8: Improve Connectivity Infrastructure and Digital Adoption Across the Economy
- Project 11: Adapt the Education and Skills System to Make it more Agile and Responsive to our Economic Needs and Ambitions
Transport
- Overall, Scotland's transport system performs well in enabling economic activity. However, there remains opportunities to improve transport connections within and between certain areas. The main challenge is with respect to public passenger transport, largely improving satisfaction with services and encouraging switch from the car to public and active travel.
NSET responds to this evidence through the following Projects:
- Project 8: Improve Connectivity Infrastructure and Digital Adoption Across the Economy
3.2 A Fairer and more equal society
| Measure | Current Performance |
|---|---|
| % of workforce earning above the Real Living Wage | 85.6% (2021) |
| No of Living Hours Accredited Employers | 0% (scheme launched 1 Aug 2021) |
| Disability employment gap | 32.0 p.p. (Jul 2020 – Jun 2021) |
| Gender employment gap | 4.3 p.p. (Jul 2020 to June 2021) |
| Ethnicity employment gap | 9.7 p.p. (Jul 2020 to June 2021) |
Scotland continues to face challenges of low pay, unacceptably high levels of child and in-work poverty and wide ranging inequalities. A number of policies are already in place to ensure that Scotland's economy contributes to raising living standards for all. While some of these measures have demonstrated progress in improving outcomes, this has not always translated to improvements in other indicators for prosperity and standard of living like child poverty. The NSET seeks to build a stronger and fairer economy that offers people better opportunities to earn incomes and that grows resources for supporting public services.
3.2.1 Employment Earnings and Inequality
Real Living wage and low-wage earners
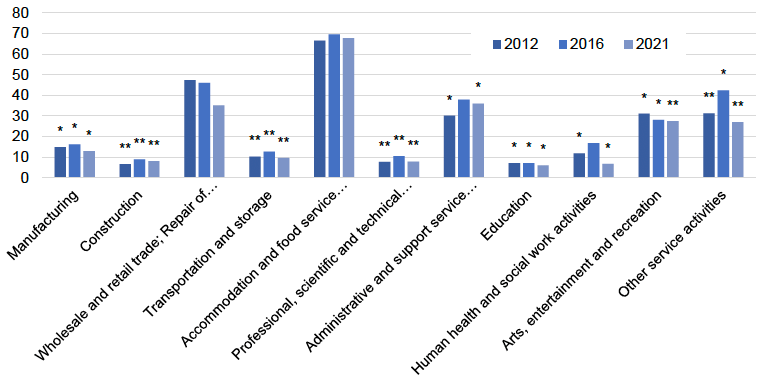
Scotland faces a significant challenge with respect to the share of the workforce with low earnings from employment. As shown in Section 2, growth in real incomes has been modest since the 2008-09 financial crisis. In 2021, about 14.4% of the workforce earned less than the real living wage, which is currently £9.50.
There are significant variations in sectoral performance against the real living wage. In 2021, as much as two-thirds (67.7%) of the workforce in accommodation and food service activities, earned less than the real living wage. The high prevalence of workers earning below the real living wage are also observed in other sectors – wholesale and retail trade; administration and support services; arts, entertainment and recreation; and other service activities.
When taking account of the size of the workforce, however, the 'retail and wholesale trade' industry accounted for the largest share of the all workers earning below the real living wage in 2021, followed by 'accommodation and food service activities'. In 2021, nearly half (48.6%) of all employees earning less than the real living wage were employed in the 'wholesale and retail trade' or 'accommodation and food service activities' sectors.
Source: Annual Survey of Hours and Earnings, ONS
Note: Estimates for some SIC sections are not included due to the reliability of the estimates.
* estimates are considered reasonably precise.
** estimates are considered acceptable.
Source: Annual Survey of Hours and Earnings, ONS
Note: Estimates for some SIC sections are not included due to the reliability of the estimates.
* estimates are considered reasonably precise.
** estimates are considered acceptable.
Figure 3.2.3 provides a more detailed picture of the distribution across Scotland's industries of workers earning below the real living wage across Scotland's industries.[31]
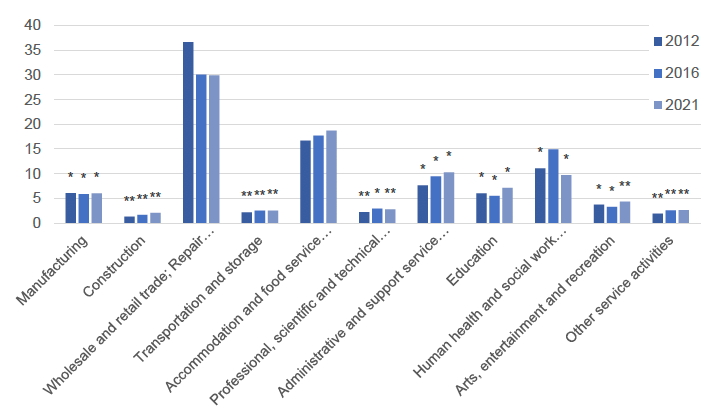
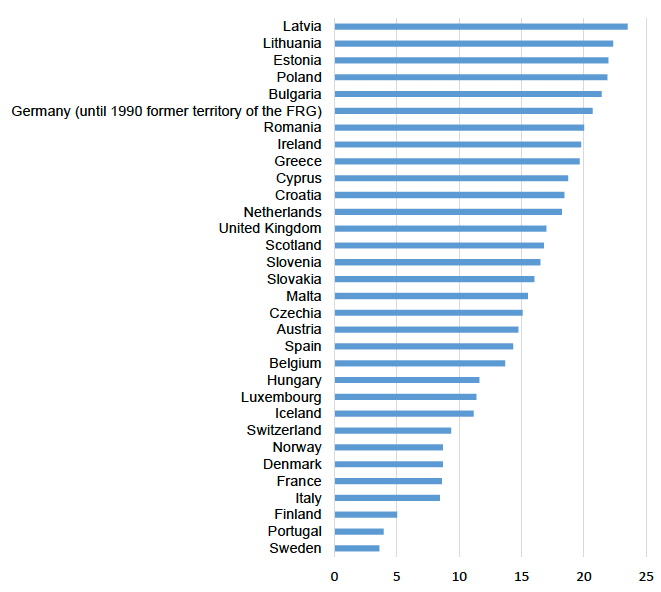
The share of low-wage earners as a proportion on all employees allows for comparison with other countries. The share for Scotland was 16.8%, placing it in the bottom half of countries (EU plus Norway and Switzerland) ranked according to the least share of low-wage earners. Most countries performing better than Scotland on this measure tend to rank higher on productivity performance. However, some rank significantly below Scotland on productivity (Slovenia, Czech Republic, Spain, Hungary, Italy, and Portugal). This suggests labour market structure and policy environment can play an important role in delivering better relative pay outcomes.
Source: Eurostat
Income inequalities
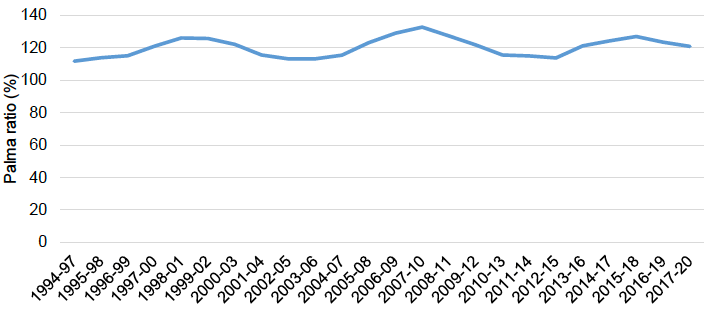
Scotland's income inequality, measured by the Palma ratio, has consistently fluctuated over time with no clear trend. In 2017-20, the total household income of the top ten percent of the population was 21% higher compared to that of the bottom forty percent. This is a gradual improvement from the three previous periods. However, on this measure Scotland ranks in the bottom quartile of OECD countries.
Source: Scottish Government Analysis of the Family Resource Survey, Households Below Average Income dataset
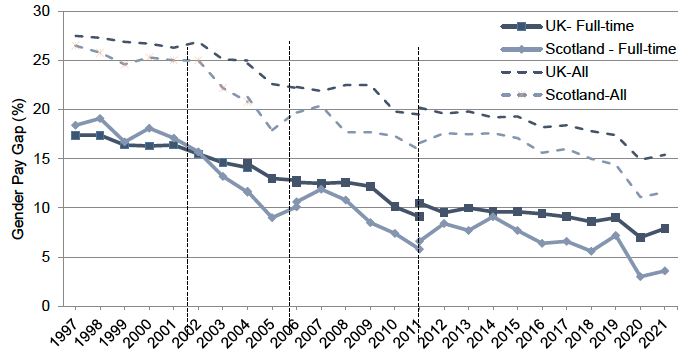
Scotland's earnings from employment also vary across equalities groups. For instance, median gross weekly earnings for full-time women in 2021 was £582.20 while the equivalent for full-time men was £650.50. However, the Gender Pay Gap for full-time employees (based on hourly earnings excluding overtime) in Scotland has decreased from 18.1% in 2000 to 3.6% in 2021. The gender Pay gap in Scotland is ranked 26th lowest out of 37 OECD countries (2019), based on full-time gross weekly employee earnings.[33]
Source: Annual Survey of Hours and Earnings
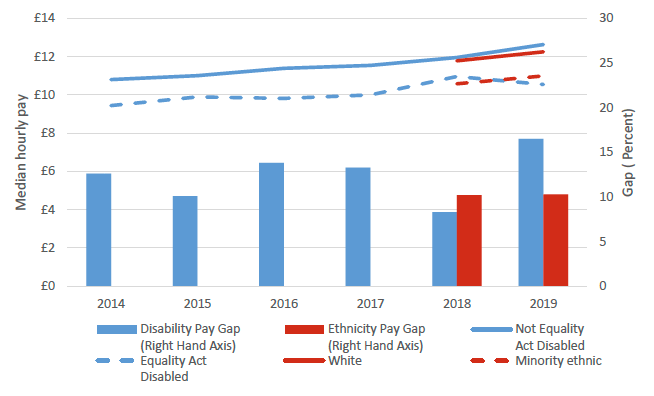
In 2019, estimates for Scotland's disability pay gap[34] was 16.5% and for the ethnicity pay gap[35] it was 10.3%.
Source: Annual Population Survey January to December dataset [36] [37]
Note: Data for earnings by ethnicity are not available for earlier years at time of publication
Disability pay gap - Pay gap calculated as Not Equality Act Disabled median hourly earnings minus Equality Act Disabled median hourly earnings then divided by Not Equality Act Disabled median hourly earnings.
Minority ethnic pay gap Pay gap calculated as Minority ethnic median hourly earnings minus Minority ethnic median hourly earnings then divided by Minority ethnic median hourly earnings.
3.2.2 Wider socioeconomic performance
Scotland's less favourable performance on pay has direct impact on the living standards of many families and communities. This is evident in the wide range of poor social outcomes, especially in local communities that are lagging behind on economic performance.
On latest 2017-20 data, around one in four (24%) children in Scotland currently live in relative poverty, significantly above the 2030 targets. Absolute poverty rate was 22% and combined low income and material deprivation rate was 13%. The relative poverty rate has slowly increased while the absolute child poverty rate, persistent poverty rate and the combined low income and material deprivation rate have remained relatively stable.
Children in the six priority family groups identified in the Scottish Government Tackling Child Poverty Delivery Plan remain at higher than average risk of poverty. Particularly notable is the proportion in relative poverty amongst lone parents and minority ethnic households:
- Lone parent households: 38% in relative poverty (2017-20)
- Minority ethnic household: 38%
- Baby aged under 1 in household: 34%
- 3+ children in household: 32%
- Disabled person in household: 29%
Scotland's local authorities are however consistently underrepresented in the 10% of UK local authorities with highest child poverty rates. Relative poverty rate after housing costs was 19% in Scotland and 22% in the UK in 2017-20. Poverty is lower in Scotland than in the UK for almost all after-housing-costs (AHC) measures, except for persistent poverty, where levels are similar. Only Northern Ireland's AHC poverty rates are slightly lower than Scotland's.
Poverty statistics – Scotland and UK comparison
- The statistics covering the period 2017-20 indicate that child poverty has been gradually rising since the early 2010s.
- Relative poverty AHC overall was 19% in Scotland and 22% in the UK in 2017-20.
- Poverty is lower in Scotland than in the UK across almost all AHC measures except for persistent poverty, where levels are similar. Northern Ireland's AHC poverty rates are slightly lower than Scotland's.
- Almost one in four children in Scotland (24%, 240,000) were still living in relative poverty (AHC). In the UK, 30% of children were in relative poverty (AHC).
- More than one million people (19%, 1.03 million) in Scotland were in relative poverty AHC. This compares to 22% across the UK.
- 68% of children in poverty AHC in Scotland lived in working households (160,000 children). This compares to 74% of children across the UK.
- 61% of working-age adults in poverty AHC in Scotland lived in working households (400,000). This compares to 68% of working-age adults across the UK.
- 14% of pensioners were in relative poverty AHC (150,000). In the UK, 17% of pensioners were in relative poverty.
- 17% of people in Scotland (910,000) were in relative poverty before housing costs, the same level as in the UK overall.
Source: DWP/HMRC children in low-income families local measure 2019-20
The 2017-20 data shows that the majority of people living in poverty are in working households. 68% of children in poverty AHC in Scotland lived in working households (160,000 children), compared to 74% across the UK. 61% of working-age adults in poverty in Scotland lived in working households (400,000), compared to 68% of working-age adults across the UK. It shows that having a job is not always enough, for example when it does not pay well, when someone is unable to work enough hours, or when one parent is unable to do paid work.
The increase in working poverty over the last decade points to changes in the labour market and the wider economy since the financial crisis, with reductions in unemployment matched by stagnant wages and the rise of part-time work and insecure contracts.[38] At the same time poverty can act as a drag on economic performance, particularly child poverty, which tends to reduce an individual's lifetime earnings. This also tends to absorb fiscal resources that could be invested in other ways to support public services and the economy.[39]
Although Scotland has the lowest child poverty rates in UK, tackling child poverty remains an urgent national priority. Recent projections suggest child poverty targets will be challenging to achieve, as the COVID-19 is likely to disproportionately affect workers in in low pay sectors.
3.2.3 Regional Economic Inequality
The distribution of economic activity and its benefits across regions is important for fair prosperity. While regional inequality is partly a result of different regions having different opportunities as determined by the natural assets and historical contexts, there can be scope to reduce it.
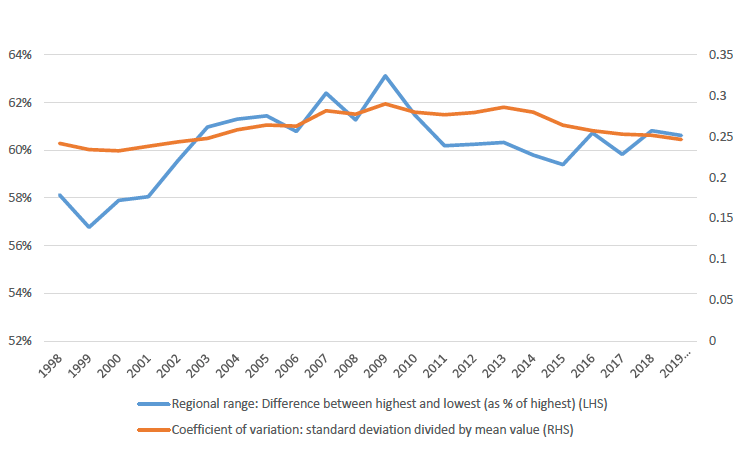
Over the period 1998 to 2019, the difference between the highest and lowest regional GDP per capita peaked in 2009. In that year, GDP per capita was highest in City of Edinburgh (£38,807) and lowest in East Lothian & Midlothian (£14,312). The coefficient variation, used by the OECD to measure regional inequalities, also shows that regional inequalities have gradually declined, although they remain above levels recorded in 1999 to 2000.[41]
3.2.4 What the evidence tells us we need to address
The evidence in this section has highlighted the need to do more for the economy to do more to deliver on wider prosperity and to raise living standards across all of Scotland:
- low growth of earning from employment and low pay, with a significant although reducing proportion of the workforce earning below the real living wage. While this is partly explained by productivity levels, the evidence from other countries suggest that labour market structure, business models and policy could be important determinants of wages.
- deep seated regional inequalities in economic activity with many communities in Scotland facing significant social challenges linked to poor economic performance, as evidenced by high-levels of deprivation or child poverty in regions with low economic performance.
- significant economic inequalities exist for disadvantaged groups (gender, ethnicity, and disability). Tackling this is not only important for maximising the benefits from Scotland's economic prosperity, but it improves overall economic performance.
NSET responds to this evidence through the following Projects:
- Project 14: Tackle Poverty Through Fairer Pay and Conditions
- Project 15: Eradicate Structural Barriers to Participating in the Labour Market
- Project 10: Realise the Potential of the Different Economic and Community Assets and Strengths of Scotland's Regions
- A National Mission with Local Impact: Infrastructure Investment Plan for Scotland 2021-22 to 2025-26
3.3 New market opportunities
| Measure | Current Performance |
|---|---|
| Renewable Energy Target: for the equivalent of 50% of the energy for Scotland's heat, transport and electricity use to come from renewable sources. | 23.8% (2019) |
| Circular Economy: waste prevention | Latest figure (2018) is a 4% reduction. Has been achieved twice since 2011 but highly dependent on construction waste. |
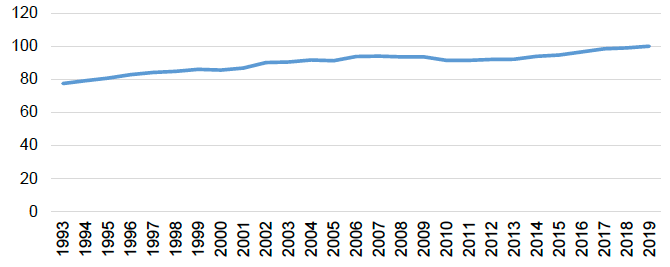
| International exports as a share of GDP | 20.8% (2019) |
The global and domestic market place is constantly in transition with global policy changes, new technologies, product innovations and changing tastes and habits. This continuously presents new market opportunities for Scotland. The global push to tackle the climate emergency; improve environmental sustainability; and, the need to rebuild Scotland's natural capital offers Scotland opportunities to establish new and transformational industries for the future.
Together the NSET identifies the following opportunity areas:
- Renewable energy, with Scotland's enjoying 25% of Europe's wind potential and home to globally leading businesses in tidal energy;
- The hydrogen economy, with vast generation potential of renewable hydrogen for export markets;
- The decarbonisation of transport, particularly the development of a high value manufacturing base for low volume high value zero emission vehicles;
- Space, leading Europe in end-to-end capability for small satellites, including earth observation data solutions;
- The "blue economy", utilising the potential, and sustainable management of our ocean, sea and coastal resources;
- Sustainable farming & forestry, nature restoration, eco-tourism, and nature-based solutions to climate change mitigation and adaptation;
- Our financial services and fintech sectors including Scotland's leading positions in responsible and ethical finance;
- Industrial biotechnology, where Scotland has developed innovative technology that can transform traditional industries and offer greener alternatives to fossil fuels;
- Emerging technologies such as photonics and quantum technologies which will underpin the industries of the future and where Scotland enjoys a world leading position;
- Digital technology including artificial intelligence and cyber security, building on Edinburgh as the Data Capital of Europe and Dundee's global leadership in gaming;
- One of the biggest life sciences clusters in Europe with world leading expertise in drug discovery and precision medicine, medical technologies and pharmaceutical services, advanced therapies, digital health and care, animal health and agritech;
- Food and drink innovation including Scotland's long-standing strengths in premium food and drink products, a key export market, and the transition to technologies of the future, including our world leading position in vertical farming; and
- Creative industries and tourism, which draw on Scotland's long-standing cultural assets and reputation for innovation, and growing strengths in digital skills and technologies.
Early evidence suggests the Inward Investment Plan is making progress to increase the number of investment deals into sectors linked to some of these opportunity areas. Industry and sector led plans to drive growth also support these areas. However, it is too early to establish evidence for wider economic impacts (e.g. impacts on GDP, jobs and local economies).
The Scottish Government is also working on delivering on the 2020 Programme for Government commitment to create Supply Chain Development Programmes (SCDP) across key sectors of the economy. The aim is to leverage £13 billion of public sector procurement spend aligned with strategic enterprise and innovation to build resilient and strategic supply chains to support growth of industries in these opportunity areas.
This section will focus on presenting evidence on the opportunities available to Scotland in net zero transitions and environmental sustainability.
3.3.1 Renewable Electricity Generation
The Scottish Government has set a target to reduce GHG emissions by 75% reduction by 2030, and for net zero GHG emissions by 2045. While Scotland has a range of sector-specific targets and ambitions including in heat, transport, electricity, land use and industry, achieving the net zero target will require emissions reductions across all sectors of the economy. This is a challenge shared across the world. Key drivers for progress will be the pace at which society can improve energy efficiency and reduce fossil fuel usage. This requires significant investments in renewable energy in Scotland and globally, which creates vast economic opportunities for economic growth and transformation.
To date, the decarbonisation of electricity generation has been one of the main drivers for Scotland's progress towards net zero. Scotland is already a world leader in renewable energy, with the equivalent of 95.9% of gross electricity consumption generated from renewable sources in 2020. However, operating a zero-carbon electricity system requires further investment to replace thermal power stations. To illustrate the potential scale of the economic opportunity in renewable technologies, National Grid analysis estimated that 50,000 jobs in Scotland will be required in the net zero energy workforce.
Scotland currently has approximately 12 Giga Watts (GW) capacity of renewables, and this has increased by 50% in the last 5 years. Offshore and onshore wind generation have huge potential for growth to 2030 and beyond, as outlined in the Scottish Government's Offshore Wind Policy Statement, which aims for an additional 10GW offshore wind and 16GW of onshore wind by 2030. The Scottish Government's Sectoral Marine Plan for Offshore Wind Energy will partly support delivery of these ambitions, providing the framework for consenting offshore wind projects that have been awarded options for seabed leases by Crown Estate Scotland via the ScotWind leasing round.
ScotWind lease option holders have made commitments to invest around £1bn per GW in Scottish supply chain content, through the Supply Chain Development Statements required by the ScotWind leasing round. It is expected that this should result in billions worth of investment linked to ScotWind.
The UK Offshore Wind Sector Deal has a UK wide target to achieve 60% lifetime local content for offshore wind projects installed by 2030. A recent Scottish Offshore Wind Energy Council (SOWEC) study provides baseline estimates of the Scottish supply chains' performance against this target.[42] Scottish supply chains' content in Scottish projects is 44%, which is very close to the overall UK supply chains' content in UK projects of 48%. However, Scottish supply chains have only so far been able to capture less than 1% of all of the non-Scottish UK offshore wind projects – reflecting opportunities to grow beyond the Scottish market.
| Scottish Projects | Non-Scottish UK Projects | All UK Projects | Adjusted | |||||
|---|---|---|---|---|---|---|---|---|
| Scottish content | UK content | Scottish content | UK content | Scottish content | UK content | Scottish content | UK content | |
| DEVEX | 66% | 73% | 0% | 90% | 38% | 80% | 27% | 83% |
| CAPEX | 9% | 13% | 1% | 11% | 5% | 12% | 4% | 12% |
| OPEX | 76% | 81% | 0% | 80% | 43% | 81% | 31% | 81% |
| DECEX | 30% | 30% | 0% | 30% | 17% | 30% | 12% | 30% |
| Total | 44% | 48% | <1% | 47% | 25% | 48% | 18% | 48% |
Source: BVG Associates (2021). UK and Scottish content baseline and roadmap: A report for the Scottish Offshore Wind Energy Council
When adjusting for the anticipated installed UK capacity in 2030 and how it may balance between Scottish and non-Scottish UK projects, the SOWEC study estimates current share of Scottish supply chains to be around 18%.[43] While these estimates are driven by modelling assumptions, they still indicate the challenge to maximising economic benefits from growing offshore wind energy market. Scottish supply chains need to build capability and competitiveness in exportable segments of the offshore wind projects.
A BVG Associates study estimates all turbines components, foundations, substations and cables must be sourced from the UK to achieve the 60% lifetime local content target for projects installed by 2030. This would require 15 new manufacturing facilities in the UK, of which six could be located in Scotland.
3.3.2 Hydrogen Economy
The world needs to move at pace to develop other alternative fuels to displace hydrocarbons, in addition to decarbonising electricity. Currently, attention is focused on hydrogen as a future GHG emissions free alternative. Hydrogen has wide-ranging applications in:
Transport: it offers significant advantages over battery electric vehicles (BEV) in heavy vehicles such as buses, heavy goods vehicles (HGVs), non-electrified trains and ferries/ships.
Buildings and heating: use of hydrogen in domestic, commercial and industrial space heating could play an important role alongside the use of other zero emissions heat technologies, such as heat pumps and heat networks, with existing gas distribution network repurposed for hydrogen distribution. However, this is dependent on UK Government decisions on the future of the UK gas network.
Industry and Power Generation: hydrogen use could be significantly expanded to displace fossil fuel use for high temperature heat and for the production of synthetic fuels. Industrial use could generate sufficient scale required to create blue hydrogen hubs.
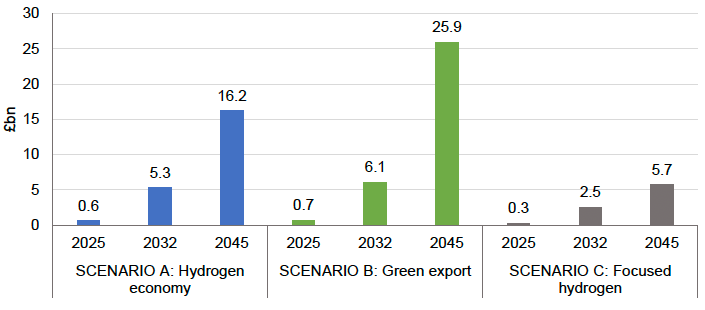
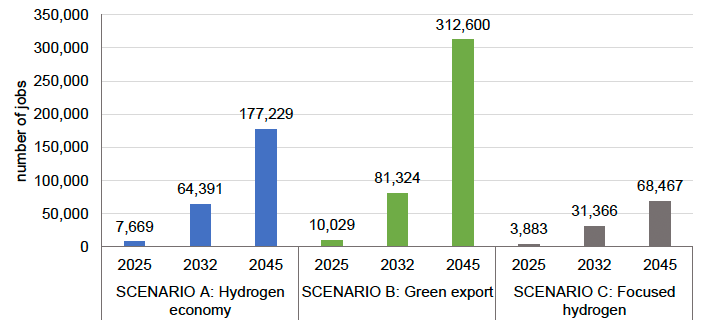
A comprehensive Hydrogen Assessment[44] was undertaken in 2020, along with an Economic Impact Assessment (EIA) of three scenarios; Focused Hydrogen, Green Export and Hydrogen Economy and across the timeframes of 2025, 2032 and 2045 (see Figure 3.3.1 and Figure 3.3.2).
Source: Scottish Hydrogen Assessment Report
The 'Green Export scenario' (assumes Scotland as a key exporter of hydrogen) provides the highest GVA contribution in which roughly £26 billion of value is generated by 2045. The 'Hydrogen Economy scenario' (less export more widespread use of hydrogen in Scotland) also makes a significant contribution in terms of GVA – generating £16 billion. The Focussed Hydrogen scenario assumes lower overall amounts of hydrogen produced and generates GVA of £5 billion.
Source: Scottish Hydrogen Assessment Report
The Green Export scenario could delivers most employment; over 300,000 jobs are either retained or created. This is followed by the Hydrogen Economy scenario, which creates a significant 177,000 jobs spread across Scotland, and the Focused Hydrogen, which supports 69,000 jobs delivering localised value in regions.
Informed by the economic assessment the Scottish Government published its Hydrogen Policy Statement in December 2020, committing to a strategic approach to the development of the hydrogen economy in Scotland, with an ambition to install 5GW hydrogen production capacity by 2030 and 25GW by 2045.
Supply Chain - the supply chains in Scotland that currently services heavy industry and the energy sector should be well positioned to support progress in the hydrogen industry. These supply chains have shown a prior ability to reshape themselves to support new industries (e.g. offshore wind). It is also clear, however, that government support for this transition will be a critical success factor and a focus on encouraging local content will be key.
There is already strong appetite from industry to develop and commercialise a hydrogen industry in Scotland. Large-scale hydrogen production features as an integral part of the recent £1 billion investment by Ineos to help decarbonise the Grangemouth industrial complex. Significant investment in comprehensive demonstration and early commercial hydrogen projects is also coming forward from key energy players in Scotland such as Scottish Gas Networks,Scottish Power Renewables and oil and gas majors such as Repsol/Sinopec and the Green Investment Group (McQuarries).
3.3.3 Heat in Buildings
Currently, heat in buildings accounts for 20% of Scotland's greenhouse gas emissions. This is in a context where 25% of households are fuel poor, and 12% are in extreme fuel poverty. As well as reaching net zero emissions by 2045, by 2040 statutory fuel poverty targets require that no more than 5% of households are fuel poor; that no more than 1% of households are in extreme fuel poverty; and that the fuel poverty gap is reduced to £250.
Scotland has made good progress in improving energy efficiency for heat in buildings, with 45% of homes now achieving Energy Performance Certificate Band C or better. Only around 11% of households have a low carbon heating system and just over half of non-domestic building stock has heating from low or zero carbon sources. To reach net zero the heating systems of over 2 million homes and almost 100,000 non-domestic buildings in Scotland will need to change by 2045. To meet the 2030 target, heating system conversions must accelerate, requiring at least 124,000 conversations annually between 2021 and 2026, and over 200,000 conversions per year in the late-2020s.
The same challenge of reducing emissions from heat in buildings is shared across the world, especially in the Northern hemisphere. This presents a large market opportunity if Scotland can make progress in developing cost-effective low or zero emissions technologies to commercialisation, and build industries to serve export markets. Such opportunities are in alternative fuels like hydrogen, heating appliances, supporting infrastructure and related supply chains.
3.3.4 Transport decarbonisation
Transport continues to be Scotland's biggest emitting sector, accounting for around 29% of emissions. The derived nature of transport demand mean that where people live, work, learn and access goods and services all play a part in their need to travel. Moreover, many transport choices people make are particularly ingrained and have become habitual over time.
The climate action for transport aims to increase the share of public transport operators in the passenger market and to support active travel. The Climate Change Plan update (CCPu) includes measures that will further reduce emissions while stimulating the economy. Further, the National Transport Strategy (NTS2), which sets the direction for Scotland's transport over the next two decades, has climate action as a core priority along with reducing inequalities, helping to deliver inclusive economic growth and improving health and wellbeing.
While the decarbonisation of small passenger vehicles is progressing with electric car technologies, achieving net zero emissions in aviation, maritime and heavy goods still requires substantial investment in innovation. Extensive carbon-reduction modelling has concluded that technological solutions alone will not be enough to reach net-zero emissions. Thus, CCPu in 2020 set out a world-leading commitment to reducing car kilometres by 20 per cent by 2030. This presents economic opportunities in alternative modes of transport. Scotland is in a good position to start looking at technology and industry growth opportunities in these areas, given its comparative advantage in natural assets for establishing a hydrogen economy. The presence of a thriving aerospace engineering industry in Scotland also provides foundations for building innovation clusters for relevant technologies.
Figure 3.3.3 reflects the scale of the challenge to reverse a long-term trend of rising car use, and to reduce the economic, social, health and environmental harms of growing car use. Measures to achieve this outcome can also create transformational economic benefits – living more locally can support community wealth and improve equality of opportunity across Scotland.
3.3.5 Waste and the circular economy:
Scotland has made significant progress in the waste sector in the last 20 years by recycling over 60% of its waste and reducing the amount of waste that goes to land fill to its lowest since records began. In 2018, the waste and resources sector emissions were over 70% lower than in 1998. However, achieving full circular economy milestones will require further effort to reduce and recycle waste, including:
- ending landfilling of biodegradable municipal waste and significantly reducing food waste;
- accelerating efforts to address legacy emissions from closed landfill sites; and
- ensuring a more rapid transition to a fully circular economy in Scotland.
There is an opportunity to build a fully circular economy in Scotland that can stimulate job creation. Research has shown that 10,000 tonnes of waste can create one job in incineration, 6 jobs in landfill, 36 jobs in recycling or up to 296 jobs in repair and reuse.
Building a circular economy at a scale needed to tackle climate change and global resource scarcity requires change from all sectors of the economy. Designers, manufacturers and consumers all have a role to play in ensuring that move to circular economy delivers economic opportunities for Scotland. Transformational circular economy opportunities are varied, and they include in the following areas:
- domestic reprocessing of materials;
- circular energy infrastructure; and,
- construction supply chains.
3.3.6 Land use, land use change and forestry:
Scotland's land has capacity to deliver nature-based solutions to climate change, including through increased tree cover, restoration of degraded peatland and infrastructure to help with adaptation. With significant increases in tree cover and widespread peatland restoration, Scotland can reduce emissions, increase carbon sequestration, enhance and protect our biodiversity, improve flood mitigation and climate adaptation, and support new jobs as part of a green recovery.
Recent years have seen some progress in these areas. Around 22,000 hectares of new woodlands were planted in the last two years, and over 25,000 hectares of peatland have been put on the road to restoration. However, around 80% of Scotland's peatlands are still degraded and Scotland remains heavily deforested compared to many other European countries. Net zero land use transformation in Scotland is estimated to require £12 billion of investment (UKCCC). This is attracting interest from private investors.
The forestry industry has already identified opportunities to increase the quantity of renewable natural wood and wood products used in Scotland, especially in construction where it can displace other non-renewable energy intensive building materials. The use of more wood and wood products will help to store carbon in some products for 100 or more years and so help to meet Scotland's climate change target of net zero emissions by 2045.
3.3.7 Blue Economy
Many of the opportunities identified above, including in renewable energy generation and the hydrogen economy, will contribute to Scotland's Blue Economy. The Blue Economy approach will help ensure our that our seas are clean, healthy, safe, productive and biologically diverse and managed to meet long term needs of nature and people. It will also offer further opportunities to grow Scotland marine related industries, notably in aquaculture, oil and gas decommissioning and the maritime industries.
Aquaculture
Scotland exported £868 million of seafood in 2020, of which Scottish salmon accounted for £450 million. The extensive use of technology in aquaculture means it is producing highly skilled jobs in some of Scotland's remote coastal and island communities. GVA per worker in the Scottish aquaculture sector was £107,000 in 2018 , with the average wage in salmon production at £38,000. The trend towards high skilled jobs in the sector will continue with further technological progress.
Oil and Gas Decommissioning
The UK Continental Shelf (UKCS) is the largest decommissioning market in the North Sea. The Oil and Gas Authority estimates that UK annual decommissioning expenditure in 2018 amounted to £1.45 billion, having risen year-on-year from 2015.[45] This represents around 9 per cent of total expenditure in the basin in 2018, compared to 2 per cent in 2010. The Oil and Gas Authority reports that the total cost of decommissioning remaining UK offshore oil and gas production, transportation and processing infrastructure to be around £49 billion.[46] This presents huge economic opportunity for Scotland's oil and gas service industry.
However, a competitive oil and gas decommissioning industry in Scotland will demand infrastructure and world class Scottish supply chains. This demands upgrade of economic infrastructure in many areas, including ports and skills.
Maritime Industries
Scotland has a legacy in maritime industries and there are areas of opportunity emerging for countries like Scotland. As noted above, the need to decarbonise maritime transport presents huge opportunities for Scotland to lead in developing net zero fuels and technologies to power the global shipping industry. The maritime industry will also play an important role in growing Scotland's hydrogen economy through trade.
There are also other niche, but high-value opportunity areas, including technologies for handling ship ballast water to stop the spread of non-native invasive species, which can be a source of ecological, economic and public health harms. The Ballast Water Management Convention, which came into force in September 2017, seeks to tackle the spread of non-native invasive species from discharge of ballast water.
More than countries, representing more than 70% of world merchant shipping tonnage, have ratified the Convention.[47] The Convention will determine the waters that ships can enter and the market they can serve, if their flag country has not implemented the convention. To implement the convention ships are required to install ballast water management systems, creating a new global market worth for maritime engineering businesses.[48]
3.3.8 Export Markets
Accessing international markets provides greater opportunities for businesses to grow. Exposure to international competition can also drive productivity growth. To realise the wider economic and societal benefits from export markets, the Scottish Government and its partners are delivering the export growth plan – Scotland: A Trading Nation - A plan for growing Scotland's exports.[49] It sets direction for growing Scotland's exports and focuses resources and policies for export promotion. While progress has been made in the implementation of the Export Growth Plan, evidence of impact is still to emerge.
Figure 3.3.4 shows the level of exports vary considerably across Scotland's industries – mainly reflecting the extent to which their output is tradable and their competitiveness on international markets.
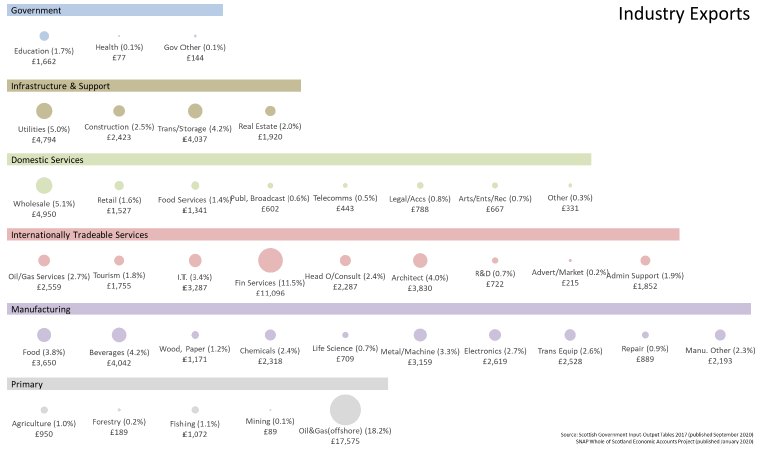
3.3.8.1 Scotland's Performance in Export Markets
HMRC Regional Trade Statistics put Scotland's international goods exports at £26.6 billion for 2020 (down from £33.8 billion in 2019) accounting for 9% of the UK's total goods exports by value. Since 2013, Scotland's international goods exports as a proportion of the UK have fallen from 11% to 9% in 2020. HMRC OTS data[50] also show a similar decline for UK non-EU exports from Scottish ports, as a share of total UK ports, from around 9% in the early 2000s to 5% in 2020.
While the value of Scotland's international exports has increased over the last 20 years, it has fallen as a proportion of GDP. Over the same period, however, many similar sized nations have increased their share of exports in GDP. This general trend suggests Scotland has not been internationalising at the same pace as its competitors with respect to trade. Latest data shows that the share of exports in GDP dropped below 20% for the first time since 2015, reflecting the impact of the COVID-19 pandemic on global markets – see Figure 3.3.5.

Source: GDP Quarterly National Accounts (Scotland), 2021 Quarter 1
Figure 3.3.6 shows Scotland's exports performance relative to other small advanced economies in 2018. It shows that Scotland underperforms on this measure, even when including exports from production onshore and in Scottish waters, and both international exports and exports to the rest of the UK. However, Scotland's export performance would have been shaped by the fact that it is part of a much bigger UK market.
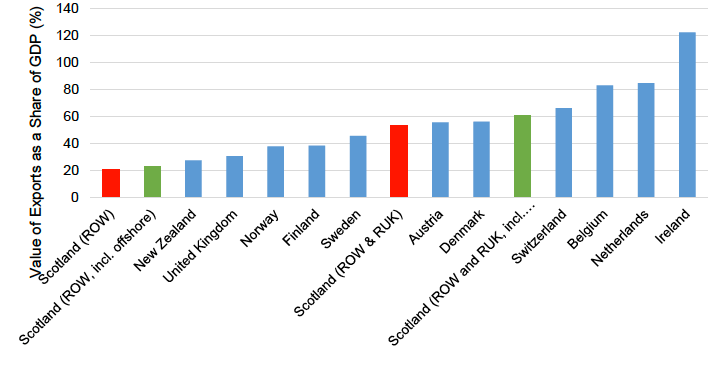
Source: Scotland's Export Growth Plan: Methodology Note, OCEA
Figure 3.3.7 shows that Scotland outperforms competitor countries in only a few product markets; only Ireland when looking at the EU market and a handful of non-EU markets – Australia, Canada, Singapore, Saudi Arabia and Brazil. Figure 3.3.8 shows that Scotland's export revealed competitiveness is concentrated mainly in a handful of sectors – the drinks industry, wholesale and retail, engineering services, utilities and business support.
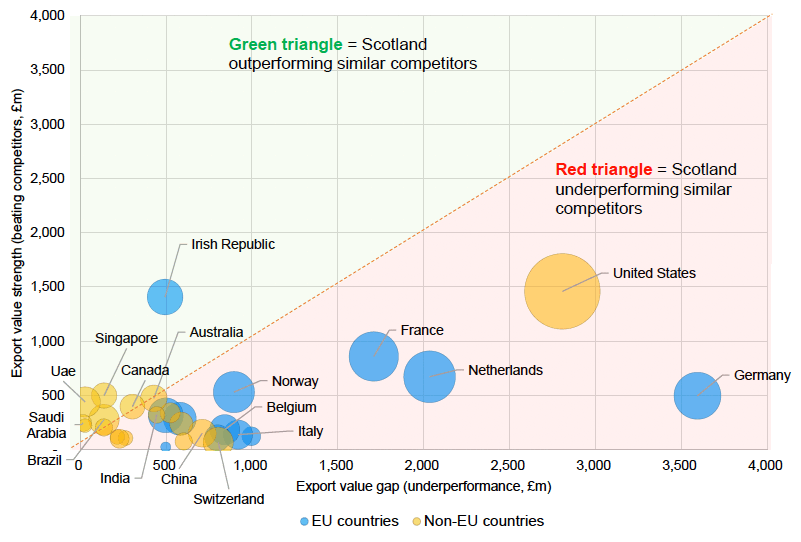
Note : size of bubble = value of Scotland's exports to country, 2014-16 average
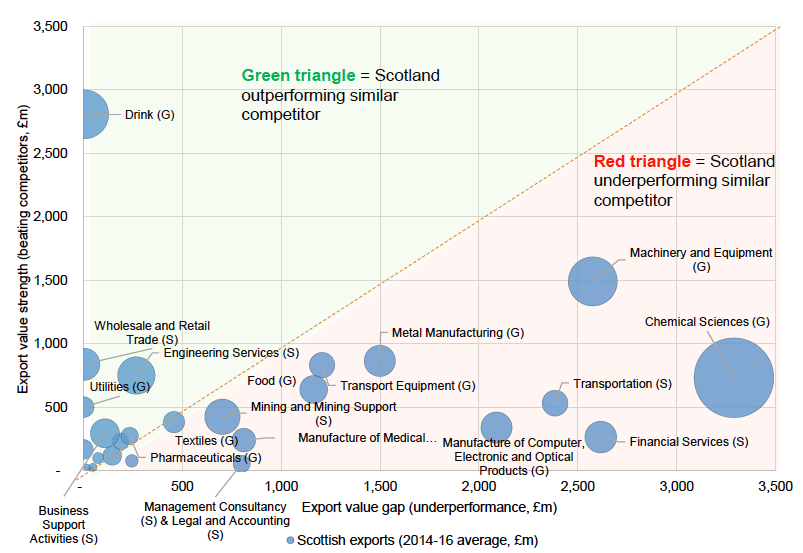
Source: OCEA calculations based on HMRC RTS, Export Statistics Scotland 2017 and UN COMTRADE
Scotland's goods exports are largely concentrated in the South West of Scotland and East of Scotland, although all the regions have seen growth since 2016 with the exception of North Eastern Scotland.[51] The North Eastern economy exports are predominantly in oil and gas industries and machinery industries. Scotland's trade in services is also concentrated regionally.[52] Financial and insurance activities account for the largest service industry exports in Glasgow, Edinburgh and South East city regions. [53] Professional, scientific and technical activities dominated services exports in the Aberdeen city region.
3.3.9 What the evidence tells us we need to address
Scotland has demonstrable strengths in many of the industries of the future with high potential for economic transformation if it can make progress in establishing industries to serve new markets linked to net zero transitions and wider technological developments.
Evidence from offshore wind energy industry suggests that Scotland has not always maximised on its economic opportunities. Supply chain development has not matched the opportunities available in Scotland, the rest of the UK and internationally. It is important therefore that approach to other emerging or new markets draws lessons from the offshore wind development where there are now efforts to bolster Scotland's supply chains capacity. This will require investment in skills, private capital, infrastructure and innovation to grow capacity and competitiveness.
While Scotland has grown its international exports over the past 20 years, their value as a share of GDP has remained broadly static and remains low relative to comparable small advanced economies. Scotland's exports are heavily concentrated. Our top five sectors account for 69% of export value. Scotland outperforms its peers in only a few key markets and sectors.
NSET responds to this evidence through the following Projects:
- Project 11: Adapt the Education and Skills System to Make it more Agile and Responsive to our Economic Needs and Ambitions
- Project 5: Build on Scotland's Strengths to Win an Ever Greater Share of Domestic and International Market Opportunities
- Project 6: Support the Development of Scottish Supply Chains, Laying the Foundations of a Net Zero Industrial Strategy
- Project 7: Attract and Deploy Significant Domestic and International Private Investment in Scotland (Shaping Scotland's Economy: Inward Investment Plan &
- Investing with Purpose: Global Capital Investment Plan)
- A Trading Nation - A Plan to Grow Scotland's Exports
3.4 Entrepreneurial people and culture
| Entrepreneurship | |
|---|---|
| Business creation: Total Early-stage entrepreneurial activity rate (TEA) | 7.3% (2020) |
| Business survival: Start-up business 3-year and 5-year survival rate | 57% (3 Year) (2016) 42% (5 Year) (2014) |
| Business growth: Proportion of high growth businesses in total registered businesses with 10 or more employees | 3.9% (2020) |
| Total Early-stage entrepreneurial activity rate (TEA) Gender Gap | 4 percentage point (2020) |
Businesses are the engine of any economy. Thriving and growing economies need a dynamic and innovating business base. Scotland has a smaller business base when compared to the rest of the UK and internationally. For example, to be in the UK regions' top quartile for the number of registered businesses per 10,000 population, Scotland would need to create 60,000 more businesses (grow the current base by 35%). However, it is not only the size of the business base that matters, the quality and diversity of businesses is important.
A central driver for a growing, innovating and dynamic business base is entrepreneurship; the ability to identify business opportunities and to translate them into viable business propositions that deliver economic impact and desirable social and environmental change. Entrepreneurship is diverse, spanning lifestyle businesses, social entrepreneurship, high growth, scale-ups, intrapreneurship within established companies and possibly other forms. However, an entrepreneurial mind-set of aspiration and ambition drives all of them.
Entrepreneurship is also important for driving productivity growth. The general view is that new entrants into industries can drive productivity growth through the creation of new technology and processes that diffuse across the economy. Furthermore, entrepreneurship can drive 'creative destruction' whereby incumbent firms are displaced and resources are reallocated to improve overall economic efficiency and leading to long-term productivity growth.
A number of policy initiatives are already in place to ensure Scotland realises it full entrepreneurship potential. These include Unlocking Ambition and Scottish EDGE. The Women in Enterprise Framework and Action Plan or the Women's Business Centre support women to start their own businesses. These interventions are delivering in many cases, but are still at early stages of delivery to assess their full impact. For example, there is evidence to suggest that Youth Enterprise Scotland is having some impact; the business start-up rate for the 18-29 age group has been rising over time and is now the highest (9.7%) within the UK home nations.[54] However, Scotland still has a significant gap to close if it is to match the overall performance of other small advanced economies.
This section provides evidence on Scotland's performance on three phases of the business life cycle – business creation, business survival and business growth.
3.4.1 Business Creation
The National Performance Framework (NPF) tracks Scotland's business creation using the indicator: Total Early-stage Entrepreneurial Activity (TEA) rate. TEA measures the proportion of the working age population that is actively trying to start a business or that own or manage a business, which is less than 3.5 years old. On this measure, Scotland's entrepreneurial activity has gradually improved over time. However, Scotland's TEA rate remains significantly below that of other advanced economies, including the rest of the UK (see Figure 3.4.1).
Source: Global Entrepreneurship Monitor
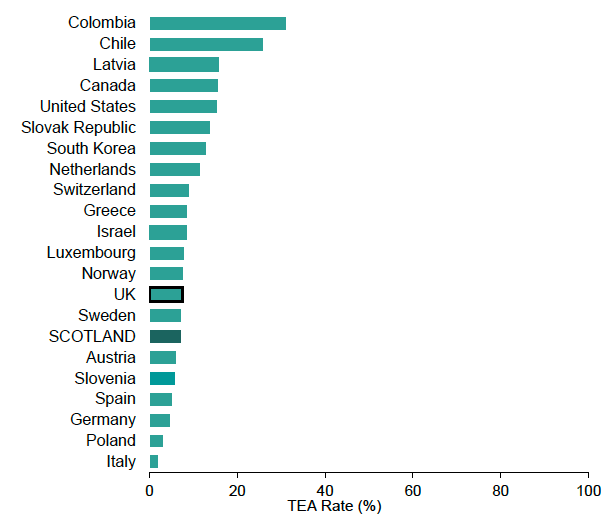
Source: Global Entrepreneurship Monitor
Scotland needs to increase its TEA rate by around 70% if it is to match the performance of other small advanced economies like Ireland. To illustrate, the latest published 2019 TEA rate for Ireland was 12.4%, compared to 7.2% in Scotland in the same year.
Box 3.4.1 – Lessons from Entrepreneurship in Ireland
The Global Entrepreneurship Monitor (GEM) research for 2019 shows that Ireland stands out on the level of 'latent entrepreneurs' among its population. One in five people in Ireland aspire to start a business in the next three years, compared to one in twelve in Scotland. On this indicator, Ireland is ranked fourth in Europe (of 15) and tenth across the OECD (of 24).
- In 2019, 18.9% of adults in Ireland deemed themselves to be aspiring entrepreneurs compared to 9.9% for the UK.
- In 2012, Ireland's TEA rate was 6.3% compared with 9.0% in the UK. Based on 2019 data, Ireland has overtaken the UK (see above).
- Ireland's strong performance on business creation however varies across equalities groups. For example, Ireland's TEA gender ratio (male TEA rate: female TEA rate) is 1.8 compared to 1.7 for the UK and Scotland and an OECD average of 1.5.
- When looking at motivation for starting businesses, early stage entrepreneurs in Ireland are more likely (69%) to report a desire to continue a family tradition compared to the UK (6%).
The relationship between start-ups and economic success is, however, much more complex. Countries with the highest TEA rates globally are low-income countries, reflecting unrealised entrepreneurship opportunities. TEA rates generally tend to be lower in advanced economies, and indeed some of the stronger advanced economies have much lower TEA rates. For example, Germany has a low TEA rate among advanced economies yet it has a strong performing economy. Some start-ups can also be precarious and associated with low wages and low productivity.
Men dominate Scotland's businesses creation despite the fact that half of people approaching Business Gateway (Scotland's publicly funded business advisory service) are female. While Scotland's TEA rate for women has risen over time, it remains lower than that for men (Figure 3.4.3). The business base also reflects this. In 2020, only 17% of SMEs in Scotland with employees and 20% of sole traders were women-led. This is broadly in line with the UK as a whole (16% and 21%).[56]
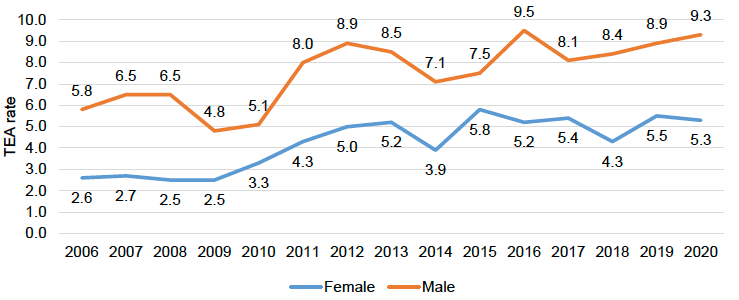
Source: Global Entrepreneurship Monitor
Analysis by ethnicity shows a TEA rate of 12.95% amongst Scotland's non-white population. Given the overlap between ethnicity and migration, this chimes with recent evidence from the Federation of Small Business on the importance of immigrant led businesses to Scotland's economy. However, this may be partly necessity entrepreneurship due to less favourable labour market outcomes for minority ethnic populations.
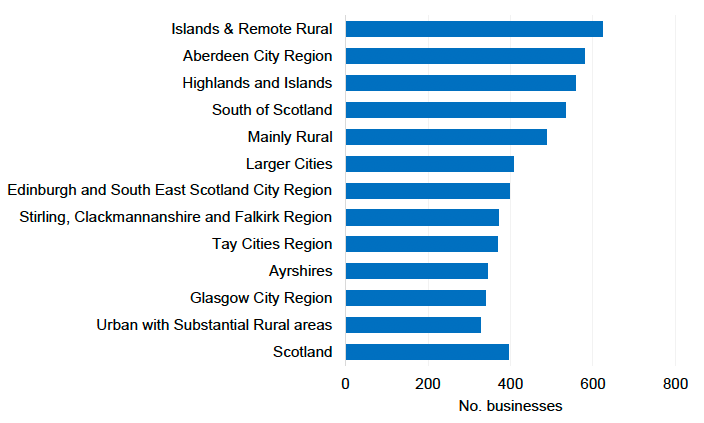
Source: Scottish Government
3.4.2 Business Survival
Survival rates for business start-ups in Scotland have generally declined over time (see Figure 3.4.5). While more businesses have been starting in recent years, more have stopped trading at an earlier stage. Based on 2004 to 2018 data, 57% of Scotland's start-ups survived to 3 years and 42% survived to 5 years.
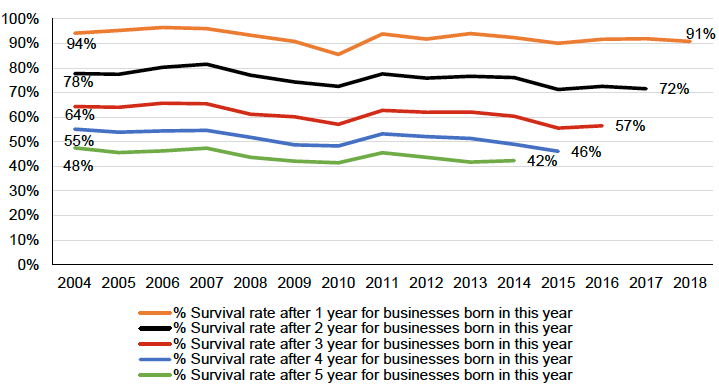
Source: ONS Business Demography
Compared to other advanced OECD economies, the start-up survival rate in Scotland appear to be much lower. Across the OECD in 2018, the best performing countries on 3 years start-up survival rates included Sweden (76.7%), Netherlands (74.3%), Ireland (75.3%) and Belgium (73.1%). The 5 year start-up survival rate is highest in Sweden (60.8%); Netherlands (57.7%) and Belgium (57.5%), compared to the UK rate of 42%.
While there is no Scottish target for start-up survival rate, there is a significant gap to close if Scotland is to match the best performing advanced economies. For instance, to match the best performing OECD countries, Scotland would need to raise its 3-year and 5-year business survival rate by around 20 percentage points. It must be borne in mind, however, that in a thriving economy a degree of churn in the businesses base reflects dynamism, and it is important to drive innovation and to reinvigorate the economy.
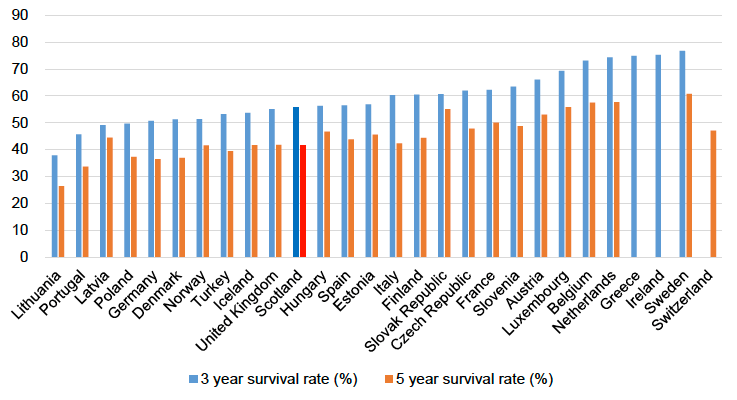
Source: OECD Business Demography Indicators
3.4.3 Business Growth
Not all start-ups that survive will grow or scale up. Others may find their growth is constrained, for example, by the market, by limited access to talent, constraints on investment and leadership capacity.
The ScaleUp Institute has estimated that while high-growth firms represent less than 1% of UK companies, they generate £1.1 trillion in turnover, equivalent to 50% of the total turnover among SMEs.[57] Other research finds that high-growth firms generate over 80% of net employment growth, and they are 24% more productive than other small firms.[58] These findings have encouraged a particular policy focus, including in Scotland, on start-ups that have the potential to scale-up.
The growth trajectories for firms can however be "episodic" which makes it difficult to define high-growth firms.[59] Additionally, it is not always apparent how best to treat micro-enterprises. Using the OECD high-growth (scale-up) definition,[60] there were 2,190 such firms in Scotland in 2020 that employed 220,562 people and with a turnover of £21.5 billion. The number of high-growth businesses in Scotland has declined since 2014.
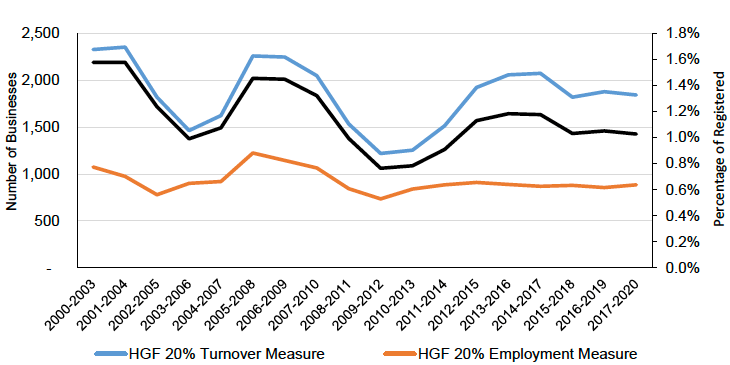
Source: Scottish Government
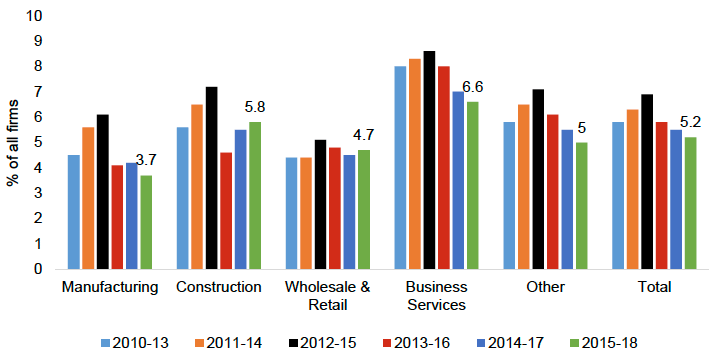
Source: ONS Business Structure Database (BSD)
As a share of the overall business base, high growth enterprises (as a share of all registered enterprises) accounted for 1.1% in 2020, down from 1.5% in 2008. When looking at businesses with 10 or more employees, the share in Scotland is 3.9% – below the UK average of 4.5% and the London region rate of 5.4%. Thus, when benchmarking against other parts of the UK, Scotland consistently underperforms on the share of high-growth enterprises in the business base.
A key driver for business growth is ongoing 'intrapreneurism' – constant focus on identifying enterprise opportunities in existing businesses and creating a competitive edge in the market. Research using panel data comprising 73 countries over 13 years finds that an increase in the experimental capacity score of a firm of one standard deviation is associated with an increase in productivity growth by an almost equal amount. [61] It finds that experimental capacity is more important for entrepreneurs who entered the market in the previous year when compared to those who entered in the current year. This suggests that growth-enhancing policies need to be different from entry-centred policies.
3.4.4 Regional patterns in entrepreneurship
In Scotland, there is a close correlation between entrepreneurship (as measured by VAT business registrations per 10,000 adults) and regional economic prosperity and performance. The stronger city regions appear to have higher levels of entrepreneurship. However, when it comes to survival rate of newly registered businesses, there does not appear to be huge variations across regions (although survival rate has overall declined over the period 2013 to 2015).
The distribution of high growth enterprises in Scotland is also unequal, although a number of regional economies with weaker overall economic performance (Ayrshire and Stirling & Clackmannanshire) seem to perform much better on this measure. Overall, however, high growth firms seem to be more concentrated in larger cities.

Source: Business Demography - Office for National Statistics
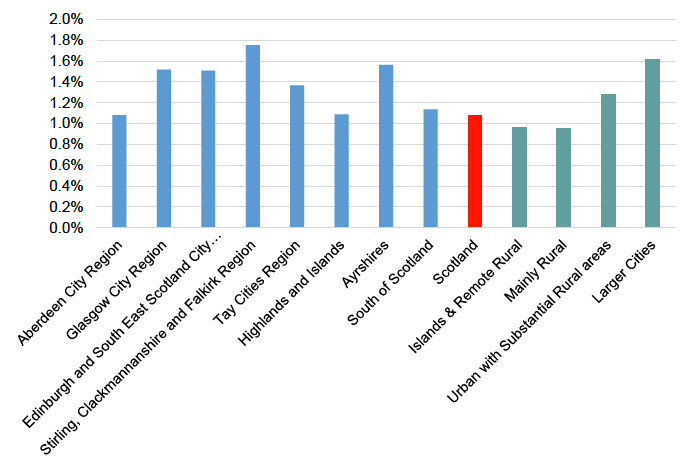
Source: Businesses in Scotland 2020 - Scottish Government
While both urban and rural areas have high growth firms, urban areas have a higher incidence of them. They are also across all sectors, including some low-productivity and domestic market facing sectors, with disproportionately more in business services and construction.
3.4.5 Entrepreneurial eco-system
Research carried out for Scottish Enterprise[62] finds that Scotland's low performance on high-growth firms is partially explained by the nature of the business base (size, age, sector, prior growth), together with background variables such as education, ethnicity and other macro variables such as economic growth. This suggests that, as well as providing direct support to help individual businesses to scale up, greater focus should be placed on the wider "entrepreneurial eco-system".
The most successful entrepreneurial economies feature thriving eco-systems, often operating through a "triple helix" of private sector, public sector and universities and linked to sectoral clusters. In terms of local economies in Scotland, Edinburgh is a good example of this, but more needs to be done in other areas.[63]
Nurturing entrepreneurial ecosystems requires building cultural, social and material attributes,[64] including education, role models, access to peers, celebration of success, learning from 'failure', social ties, entrepreneurial networks, skilled workers and access to talent and appropriate and diverse investment capital. Entrepreneurship can flourish when these attributes are supported by key institutions including universities (which are often anchor institutions), favourable government policies and appropriate infrastructure including transport, super-fast broadband and access to cultural activities including, for example, attractive places for entrepreneurs to come together in a "market-square" type environment.[65]
3.4.6 Challenges for Entrepreneurship in Scotland
Overall, evidence presented above shows that there is significant scope for Scotland to improve its entrepreneurship performance, especially when looking at what other advanced economies achieve. This report has reviewed evidence on challenges faced by Scotland's micro and SME business base (as a proxy for entrepreneurship) to understand where they may be opportunities to improve Scotland's entrepreneurship performance.
Table 3.4.1 Constraints to Entrepreneurship in Scotland: Summary of Evidence
The following have been identified as constraints to entrepreneurship in Scotland:
- Fewer entrepreneurial companies with which to collaborate and build an eco-system;
- Access to talent (depending on sector, e.g. tech: software engineers and coders);
- Low levels of entrepreneurial ambition;
- Public perceptions about entrepreneurship;
- Lack of diversity among entrepreneurs;
- Lack of joined up entrepreneurial education from primary through to further and higher education;
- Business infrastructure, e.g. incubators and other premises;
- Fewer existing businesses of scale: fewer role models and opportunities for collaboration and sales;
- Finance for growth;
- Skills in how to lead and grow businesses of scale;
- Access to talent;
- Lack of experience and capacity in growing an entrepreneurial venture;
- Increasing sales domestically and internationally;
Table 3.4.2 provides evidence on the distribution of obstacles to business growth by business size drawing on Small Business Survey Scotland data.
| Scotland | Business size | |||
|---|---|---|---|---|
| Micro (1 - 9) | Small (10 - 49) | Medium (50 - 249) | ||
| Obtaining finance | 22% | 21% | 27% | 17% |
| Taxation, VAT, PAYE, National Insurance, business rates | 39% | 36% | 53% | 42% |
| Staff recruitment and skills | 29% | 23% | 55% | 62% |
| Regulations/red tape | 38% | 37% | 46% | 34% |
| Availability/cost of suitable premises | 15% | 15% | 15% | 10% |
| Competition in the market | 45% | 43% | 54% | 69% |
| Workplace pensions | 17% | 15% | 28% | 33% |
| Late payment | 33% | 31% | 45% | 36% |
| UK exit from the EU | 34% | 36% | 26% | 32% |
| National Living Wage | 21% | 19% | 32% | 26% |
| Any other major issues or obstacles | 10% | 12% | 2% | 11% |
| None of these | 6% | 6% | 8% | 10% |
| Don't know/No opinion | 2% | 3% | - | - |
| Refused | 1% | 1% | - | - |
| Scotland | 100% | 100% | 100% | 100% |
Source: Small Business Survey Scotland, 2019
3.4.7 What the evidence tells us we need to address
Entrepreneurship in Scotland is improving from a low base, but there needs to be a step-change in order to be truly transformative. There remains significant scope for improvement in a number of areas.
- Scotland has a relatively small but growing business base. Growth has largely been among micro and small businesses and Scotland still lag behind comparable economies on indicators of entrepreneurial dynamism – start-ups, business survival rate and high growth businesses.
- Scotland has a deficit of high-growth firms when compared with other countries, and there is evidence of constraints to business growth in the wider enterprise eco-system.
- There is recent evidence of significant improvement in business start-ups in the younger age groups that Scotland can build on. The business start-up rate amongst ethnic minorities is also significantly higher than in the rest of the population, demonstrating the value of immigration to Scotland's economy. There is, however, a distinct gender gap in Scottish entrepreneurship; we need to increase female entrepreneurs.
- Growth in registered businesses has been strongest in 'internationally tradable services' and 'infrastructure and support' sectors,[66] although the domestic services industry still accounts for the largest share of registered businesses.
NSET responds to this evidence through the following Projects:
- Project 1: Embed First Rate Entrepreneurial Learning Across the Education and Skills Systems
- Project 2: Create a World Class Entrepreneurial Infrastructure of Institutions and Programmes Providing a High Intensity Pathway for High Growth Companies
- Project 3: Attract and Retain the Very Best Entrepreneurial Talent from at Home and Abroad
- Project 4: Build an Entrepreneurial Mindset in Every Sector of our Economy
3.5 Skilled workforce
| Measure | Current Performance |
|---|---|
| Skills supply: skills shortage vacancies | 21% (2020) |
| Scotland's performance on young people's participation in education, training and employment, compared to EU countries | 3rd Quartile (2019) |
| Proportion of those in employment (aged 16-64) who reported receiving job related training within the last 3 months | 22.3% (2020) |
Skills enable people to participate and progress in the labour market. Providing people with the opportunities to develop skills – irrespective of who they are and where they live – is a key driver of improved economic performance and wellbeing, which sits at the heart of the Scottish Government's economic and labour market strategies.
People with higher skills are more likely to be in employment. For example, using qualifications as a measure of skills level, we observe that 84.2 per cent of Scotland's population (16-64 years) with a degree of professional qualification are in employment compared to only around a half of the population (16-64 years) with no qualifications (46.2 per cent).[67]
Scotland's skills levels, as measured by qualifications, have improved over time. In 2020, the percentage of the population (16-64 years) with low or no qualifications (SCQF) was 9.7 per cent, compared with 14.7 per cent 10 years earlier.[68] As well as improving the likelihood of being in employment, investing in skills helps people to progress to more fulfilling, secure, well-paid and fair work. This has wider social benefits. When improvement in skills are among groups that traditionally face disadvantage or that are under-represented on key positive labour market outcomes – women, disabled people, minority ethnic groups, it contributes to tackling social inequalities.
Overall, a highly-skilled and engaged workforce are a key requisite for a successful economy. Skills Increase an individual's ability to do advanced tasks that add more value to the economy. Indirect impacts include enabling the development and application of more productive technology and innovation.[69] Consequently, the OECD suggests that for the UK, "developing the right set of skills and making full use of them in the economy is a recipe for higher productivity growth and inclusiveness".[70]
Recently, the Scottish Centre for Employment Research (SCER)[71] has looked at business models, innovation and employees' experiences in the workplace. They provide evidence that poor productivity performance is associated with poor use of employee skills, insufficient training and poor management.
3.5.1 Skills Supply
In 2020, 'skill shortage vacancies' accounted for about 21% of all vacancies in Scotland. These are vacancies that are hard to fill due to a lack of skills, knowledge or experience among applicants. In both 2015 and 2017, the rate of "skill shortage vacancies" was 24% – only falling in 2020 with the negative impact of the COVID-19 pandemic on the economy as some industries either closed or had restrictions in activity.
The proportion of all Scottish employers with at least one 'skill-shortage vacancy' fell from 6% in 2017 to 3% in 2020, partly reflecting the impact of the pandemic. Figure 3.5.1 presents the vacancies and skills picture for Scotland for years 2015, 2017 and 2020.
The incidence of 'skills shortage vacancies' vary across sectors (see Figure 3.5.2). Traditionally, the incidence has been highest in education, followed by hotels and restaurants and business services. The impact of the pandemic is evident in 2020; most sectors experienced significant falls in the incidence of skills shortage vacancies.
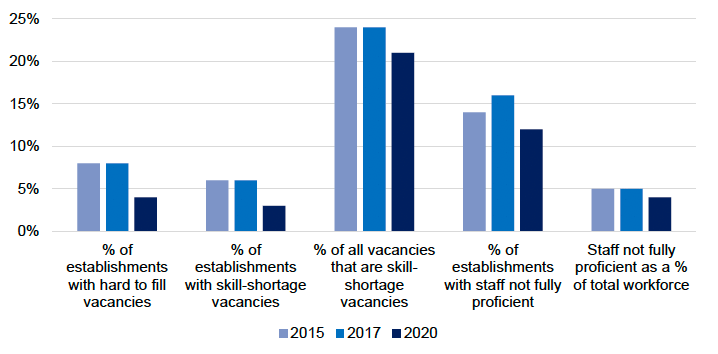
Source: SG, Employer Skills Survey[72]
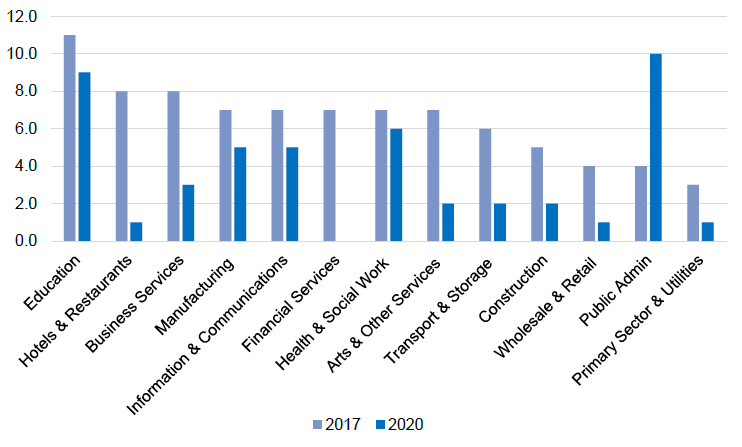
Source: Scottish Government, Employer Skills Survey
In 2017, 16% of businesses in Scotland reported 'skills gaps' (employees not sufficiently skilled for their roles) among their workforce. This is higher than the overall UK figure (13%). Historically the shares of businesses reporting skills gaps has been higher in Scotland compared with the rest of the UK. Between 2011 and 2017, however, Scotland has seen a 5-percentage point fall in the number of businesses reporting skills gaps, and the UK as a whole saw a decline of 4 percentage points over the same period.
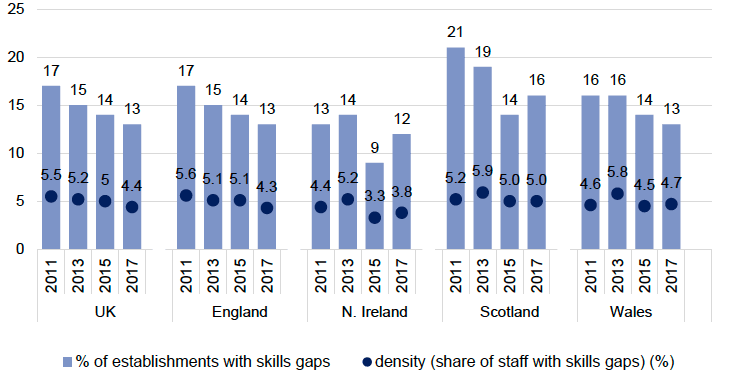
Source: UK Department for Education (2018), 'UK Employer Skills Survey 2017'; Base: All establishments (base size: UK 87,430; England 71,527; NI 3,973; Scotland 6,017; Wales 5,913)
Following the pandemic, businesses have been experiencing difficulties filling posts due to the pace of re-opening, the impact of EU Exit and a frictional miss-match of candidates with jobs.[73] Survey data shows that in October 2021,[74] 44% of business reported vacancies were more difficult to fill compared with normal expectations for the same time of year. This is a bigger challenge in 'Accommodation and Food Services' and 'Transport and Storage' sectors. The most common reason cited for these difficulties is the lack of applicants and qualified candidates. Online notified vacancies are also higher than the pre-COVID period, particularly so in some sectors.
3.5.2 Skills Profile of Scotland's population
As noted above, latest (2020) data shows that around 9.7% of Scotland's population aged 16 to 64 years were classed as having low or no qualifications, reflecting progress that Scotland has made in investing in skills over the last decade.
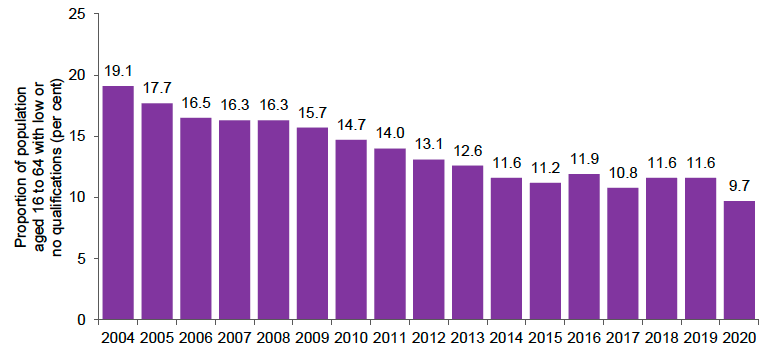
Source: Annual Population Survey, January to December each year, ONS
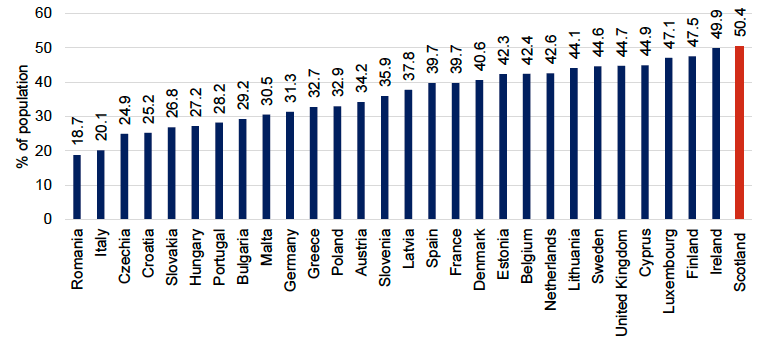
Source: Eurostat
When compared to EU countries, Scotland has the highest share of the population aged 25 to 64 years that has at least tertiary education. It shows that Scotland performs strongly when it comes to investing in skills, at least as measured by tertiary education qualifications.
3.5.3 Scotland Demographic Trends
Like most advanced economies, Scotland has an aging population. The share of children (15 years and below) in the population has declined from 20.2% in 1993 to 16.9% in 2018. Over the same period, however, the share of the pensionable age[75] group has only increased from 18% to 19%.
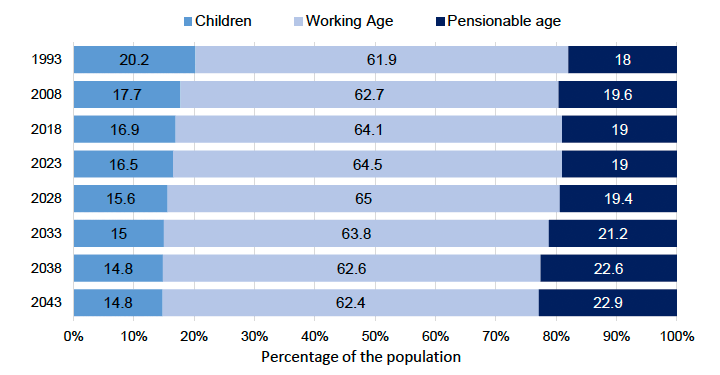
Source: National Records Scotland[76]
The changes in the population age profile is affecting Scotland's workforce. Scotland is seeing a gradual increase employment in the older age groups. In 2020, the over 50-age group accounted for 30.9% of total employment, compared to only 24.9% in 2010. The estimated employment rates for those aged 65 years and over has increased from 5.2 per cent in 2004 to 8.7 per cent in 2020, as working lives are getting longer. The share of workers aged 50 to 64 years has increased from around a quarter of the workforce in 2010 to around one third in 2020.
Over the same period, the share of the workforce in the younger age bands has decreased. For example, the workforce aged 25 to 49 years has fallen from 59.1 per cent in 2010 to 57.7 per cent in 2020.
The growing share of older workers in the workforce in the last 5 years is evident in most sectors. The only sectors that have not seen growth in the share of the 50-64 year olds in the workforce are 'Information and Communication Services', 'Real Estate', 'Professional, Scientific and Technical Services' and 'Education'.
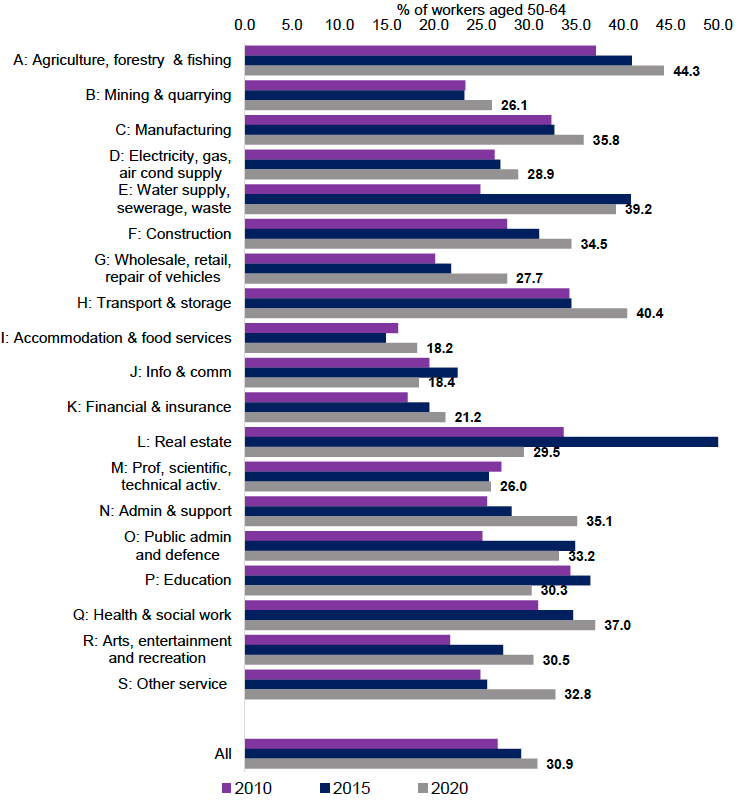
Source: Annual Population Survey, January to December in each year.
Looking to the future, the trend towards an aging population is projected to continue. According to National Records Scotland projections, Scotland's working age population could decline to 62 per cent in 2043 (from 64.1 per cent in 2018). This will affect Scotland's labour and skills supply. While these changes may present as slow or gradual, with greater challenges appearing to be in the distant future, reversing demographic changes will also be a slow and gradual process.
As people are working longer, it challenges skills provision to ensure that workers can continue to invest in skills throughout all life stages. This is important for ensuring all can have equal opportunities to participate and benefit from economic activity. Socio-economic trends, including the global climate emergency, demographic changes and the uncertain impact of technology, necessitate that Scotland's skills system evolves to meet the needs from this changing demography.[77]
3.5.4 Foreign born workers
Like the UK as a whole, Scotland's economy has partly depended on migration to meet it workforce and skills requirements. Some sectors are more dependent on foreign-born (those who have migrated from their country of birth to reside in Scotland) workers than others. The highest number of foreign-born workers are in the 'Health and Social Work' sector. However, the highest dependence on foreign-born workers, based on share of the workforce, is 'Accommodation and Food Services', followed by 'Administration and Support' and then 'Information and Communication Services'.
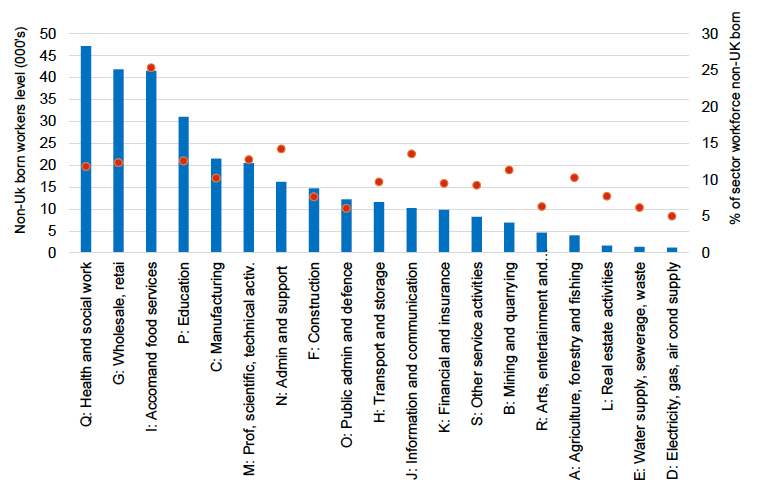
Source: Annual Population Survey 2019
When compared to other OECD countries, Scotland has a relatively low share of foreign-born population (of all ages). However, the employment rate for Scotland's foreign-born population (16-64 years) is higher than the average across other OECD countries.
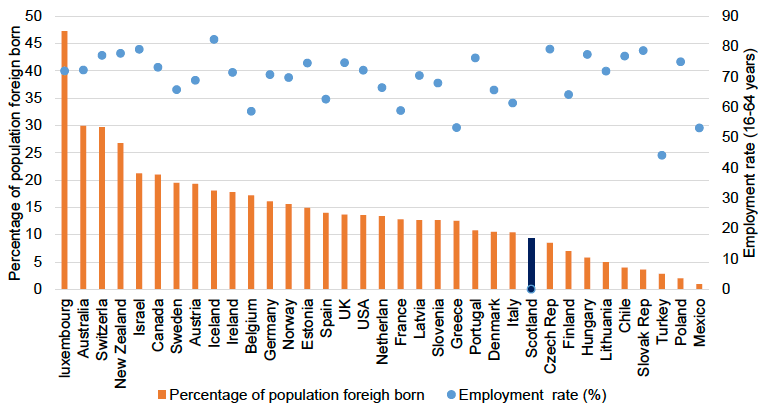
Source: OECD International migration database[78], APS
Note: Scotland 2019, other countries- 2017, 2018, 2019
Since the COVID-19 pandemic, the National Insurance Numbers (NINo) allocated to overseas nationals have reduced.[79],[80] Over the quarter October to December 2020, there were 3,700 NINo registrations to overseas nationals living in Scotland. This is a 71% decrease compared to the same quarter in 2019. While part of this may reflect disruptions to the NINo registration process because of the COVID-19 pandemic, survey data estimates that 15 per cent of businesses reported an annual declined in EU workers in 2020. This was as much as 42 per cent in Accommodation and Food services sector.
3.5.5 Inactivity in the Workforce
While Scotland faces skills and general labour shortages, 22.0 per cent (Jul to Sep 2021) of the working population (16 to 64 years) are economically inactive – not in employment and not actively seeking work. Since 2016, Scotland has had a marginally but consistently higher rate of inactivity than the UK, although since 2015 Scotland's inactivity rate has consistently been lower than Wales' and Northern Ireland'.
Source: ONS, Annual Population Survey, Jan-Dec in each year
Source: Annual Population Survey January to December in each year
When considering reasons reported for economic inactivity, in 2010 students accounted for a larger share of the inactive population UK-wide when compared with Scotland. However, this gap has reduced, and currently students account for a similar share of the inactive in Scotland and UK.
The share of inactive population reporting that they are looking after family and home in UK has decreased faster when compared with Scotland. Scotland consistently report a higher proportion of inactive who are long term sick or in retirement. Women accounted for a slightly greater percentage of the inactive and most were in the 16-24 years or 50-64 years age groups.
Source: OECD, Labour Force Survey, Q1 2021
Scotland's economic inactivity rate is not too dissimilar to that of other small advanced economies like Finland, Norway and Demark. However, other countries like Switzerland, Netherlands and Sweden have much lower rates, while rates are significantly higher in Belgium and Ireland.
3.5.6 Skills Mismatch
Understanding the extent of skills mismatch within the economy is important as it can be a drag on overall performance of economy. The 2020 Scottish Employer Skills Survey (ESS)[82] suggests skills mismatch is a significant issue for employers in Scotland.
Skills mismatch is complex to measure. Often education and qualification levels are used to approximate skill levels, and to test whether or not they match what is required to do a particular job. Skills mismatch can take different forms. The International Labour Organisation (ILO)[83] set out three main classification of skills mismatch:
Vertical mismatch
When someone's level of education is higher or lower than expected for his or her occupation.
Horizontal mismatch
When workers educated in a particular field work in another.
Career mismatch
When jobs and skills do not approximate over time.
In 2020, one-third (33%) of establishments in Scotland reported having under-utilised staff (i.e. those that have both qualifications and skills that are more advanced than required for their current job role). On average, under-utilised staff as a proportion of total workforces was 8%. These results varied by region, employer size and sector. This is an improvement from 2017, when 35% of establishments reported having under-utilised staff.
While we cannot conclude a trend, especially given the disruption to the labour in 2020 due to the pandemic, Employer Skills Survey results by sector show that in 2020, under-utilised staff in Scotland were most prevalent in 'Financial Services', 'Hotels & Restaurants' and 'Arts, Entertainment and Recreation' and 'Other Services'. There was also a large decline in under-utilisation in the 'Information and Communications' and 'Public Administration' sectors.
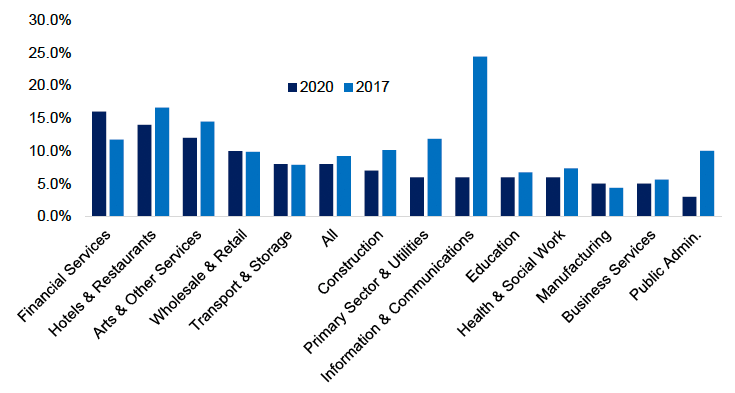
Source: Scottish Employer Skills Survey, 2020
Trend data on skills mismatch is not available for Scotland. However, the Office for National Statistics (ONS) estimated[84] in 2016 that between 2002 and 2015, the UK saw a gradual increase in the proportion of workers whose level of educational attainment matched the average for people in their occupation. The highest rate of 70.6% was in 2012 followed by a period of gradual decline to 2015.
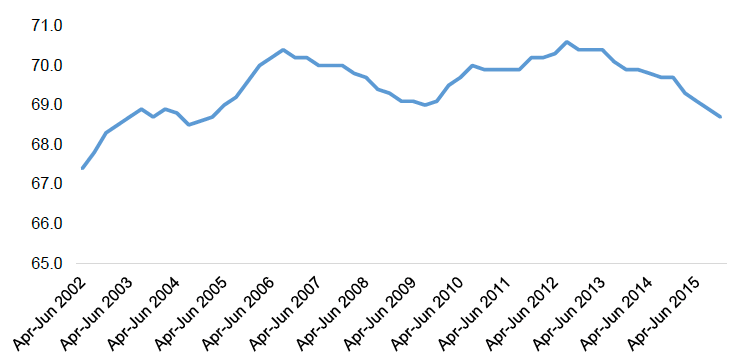
Source: ONS, Labour Force Survey
The more recent decline in matching of skills and jobs (post 2012 to 2015) is because of a rise in 'over-education', and coincides with a period of strong employment growth in the UK and in Scotland. A 2014 ILO report[85] found that total skills mismatch in the UK was 5th highest among 24 European countries in 2012, with overall 28.9% of the UK workforce in jobs not matching to their skill level (either over or under educated).
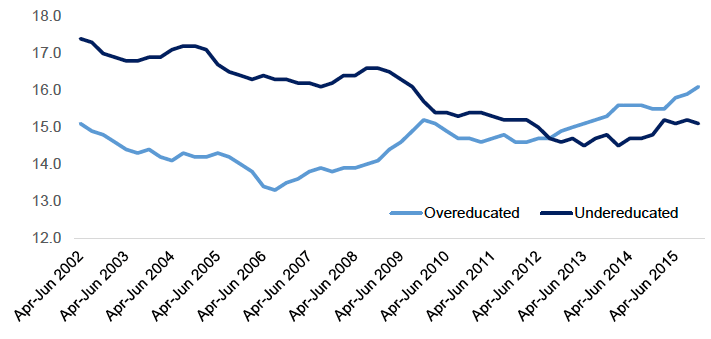
Source: ONS, Labour Force Survey
3.5.6 What the evidence tells us we need to address
The evidence presented in this section shows that Scotland performs well on investment in skills, especially as measured by the share of the workforce with at least tertiary education. However, the economy still faces a wide range of challenges with respect to skills, including:
- general skills shortages as measured by prevalence of 'skills shortage vacancies'. The skills challenge has grown as economic activity has recovered following the pandemic and with impacts of EU exit on migration;
- an aging population, which is also translating to an aging workforce. There is evidence the working life is getting longer with increasingly more people working beyond the retirement age. Latest projections suggest that these trends are long term and will continue. This highlights the importance of investing in lifelong learning.
- while Scotland has depended on migration to meet skills and workforce requirements – especially in some sectors; its share of foreign-born population is much lower when compared to other OECD countries. Brexit is likely to have reduced it further.
- despite having challenges with respect to skills and general labour shortages, around one in five of Scotland's working age population is economically inactive. The most common reason cited for economic inactivity in Scotland is temporary or long-term health problems in the workforce. The share of inactive workers reporting that they are discouraged or not interested in work was only 1% in 2020.
- to mitigate against growing skills mismatch in the economy, there is need to ensure skills provision adapts to changing skills requirements as the economy transforms with modern technologies and new markets. This requires ensuring that a more coherent lifelong learning offer is complemented by increased employer and industry investment in workforce skills and training.
NSET responds to this evidence through the following Projects:
- Project 11: Adapt the Education and Skills System to Make it more Agile and Responsive to our Economic Needs and Ambitions
- Project 12: Support and Incentivise People, and their Employers, to Invest in Skills and Training Throughout their Working Lives
- Project 13: Expand Scotland's Available Talent Pool, at all Skills Levels, to Give Employers the Skills Pipeline They Need to Take Advantage of Opportunities
Contact
Email: Cornilius.Chikwama@gov.scot