Recorded Crime in Scotland, 2022-23
Statistics on crimes and offences recorded and cleared up by the police in Scotland in 2022-23, split by crime or offence group and by local authority.
Part of
Official Statistics on clear up rates
This section presents statistics on recorded crime clear up rates in Scotland during 2022-23. Whereas the rest of this bulletin presents recorded crime statistics that have been produced as National Statistics, these clear up rate statistics remain published as Official Statistics.
A crime or offence is regarded as cleared up where there exists a sufficiency of evidence under Scots law to justify consideration of criminal proceedings notwithstanding that a report is not submitted to the procurator fiscal because either:
(i) by standing agreement with the procurator fiscal, the police warn the accused due to the minor nature of the offence, or
(ii) reporting is inappropriate due to the non-age of the accused, death of the accused or other similar circumstances.
Clear up rates are calculated as follows:
number of crimes cleared up in year y: 100
X
total number of crimes recorded in year y: 1
Clear up rates presented are rounded to one decimal place.
Because crimes or offences may be cleared up in a different year than they were recorded, rates in excess of 100% can arise.
Clear up rates for both the Coronavirus restrictions crimes group and Road traffic offences group are not included in this bulletin, as by their nature both typically involve criminality in which the offender is 'caught in the act'. Further to this, it has not been possible to obtain clear up rate information for the Coronavirus restrictions group, due to the separate and bespoke data collection used by Police Scotland. Further detail on clear up rates by groups and categories is available from the 'Supporting documents' Excel workbook (Table 3).
More information on clear up rates is available in the User Guide.
Total recorded crime
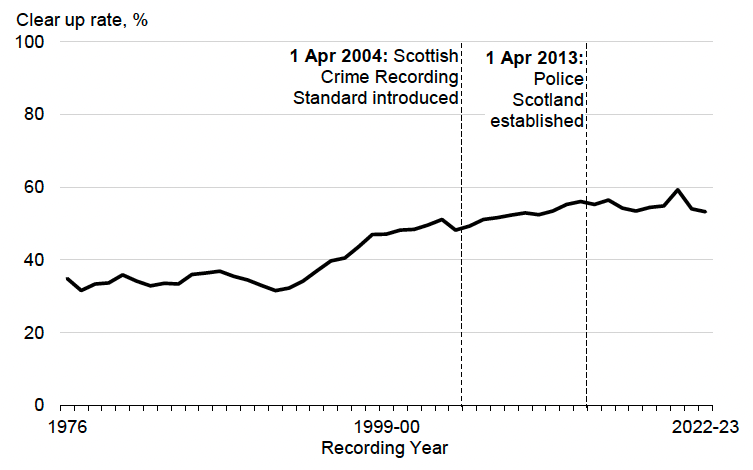
In 2022-23 the clear up rate was 53.3%, down from 54.0% in 2021-22 and 59.3% in 2020-21.
The larger decrease between 2020-21 and 2021-22 likely reflected the impact of the COVID-19 pandemic on the types of crime recorded, with the volume of those crimes that have relatively lower clear up rates falling more sharply in 2020-21 than those with relatively higher clear up rates. The fall back to 54.0% in 2021-22 reflected a partial return to the volume of different crime types recorded prior to the pandemic (2019-20), albeit clear up rates still fell for each of the individual crime groups.
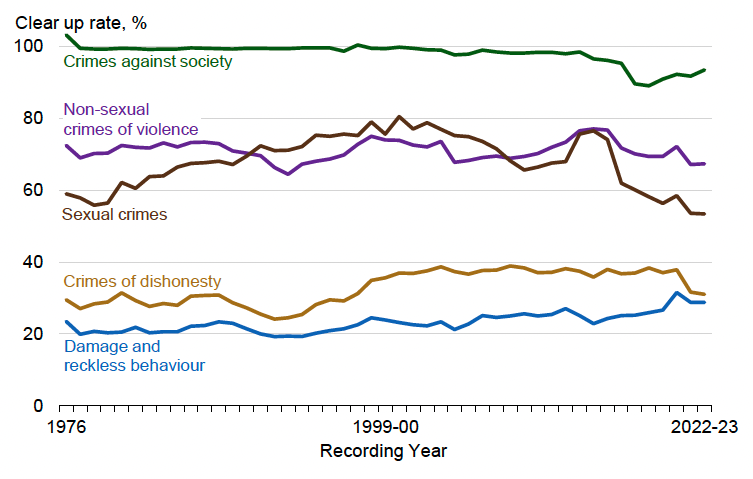
Clear up rates then remained more stable in 2022-23, reducing slightly from 54.0% to 53.3%. Crimes against society (93.4%), Non-sexual crimes of violence (67.3%) and Sexual crime (53.4%) continued to have higher clear up rates in 2022-23 than Crimes of dishonesty (31.0%) and Damage and reckless behaviour (28.8%).
Prior to 2020-21, clear up rates had been relatively stable over the last decade following a generally upward trend since 1976, the first year for which comparable clear up rates are available, as shown by Chart 15 below. Chart 16 shows the clear up rates by crime group from 1976 onwards.
1. Comparable clear up rates for the present crime groups are not available prior to 1976.
1. Comparable clear up rates for the present crime groups are not available prior to 1976.
Non-sexual crimes of violence
The clear up rate for Non-sexual crimes of violence increased from 67.1% in 2021-22 to 67.3% in 2022-23.
Between 2021-22 and 2022-23, the category with the largest decrease was Murder and culpable homicide, from 113.5% to 91.7%. Serious assault and attempted murder had the largest increase, from 77.4% to 79.9%.
Sexual crimes
The clear up rate for Sexual crimes was relatively unchanged from 53.5% in 2021-22 to 53.4% in 2022-23. This is the lowest rate since 1976, the first year for which comparable clear up rates are available.
Between 2021-22 and 2022-23, the category with the largest decrease was Other sexual crimes, from 47% to 44.1%. Crimes associated with prostitution had the largest increase, from 66.3% to 80.6%.
Crimes of dishonesty
The clear up rate for Crimes of dishonesty decreased from 31.6% in 2021-22 to 31% in 2022-23.
Between 2021-22 and 2022-23, clear up rates decreased for most categories. The category with the largest decrease was Other dishonesty, with the clear up rate falling from 58.7% to 54.3%. The only category with an increase was Theft by opening lockfast places, increasing from 16.2% to 23.5%.
Damage and reckless behaviour
The clear up rate for Damage and reckless behaviour remained unchanged at 28.8% in both 2021-22 and 2022-23. Damage and reckless behaviour consistently has the lowest clear up rate of the five crime groups. However, despite the decrease in 2021-22 which has remained unchanged in 2022-23, there have been increases since 2014-15. The rate for 2021-22 and 2022-23 is the second highest over the past ten years.
Between 2021-22 and 2022-23, the only decrease occurred in the clear up rate for the Reckless conduct category, from 48.8% to 45.4%.
Crimes against society
The clear up rate for Crimes against society increased from 91.6% in 2021-22 in to 93.4% in 2022-23. Clear up rates for Crimes against society have always been the highest of all groups, as many of the contributing categories (though not all) relate to criminality for which someone is generally 'caught in the act' (for example Drugs – Possession). An example of where this is not the case would be the Weapons Possession (used) category, where earlier research[6] suggested the clear majority of crimes were recorded following a victim or witness report to the police.
There were consistent decreases in clear up rates for Crime against society between 2013-14 and 2018-19, followed by small increases over 2019-20 and 2020-21, before a decrease in 2021-22 then increasing again in the latest year.
Between 2021-22 and 2022-23, most categories have seen a decrease. Two categories showed an increase in clear up rate with the largest one occurring for Other crimes against society, from 75.1% to 82.3%, with the only other category showing an increase being Drugs – Possession, from 94.6% to 100.8%.
Contact
Email: JusticeAnalysts@gov.scot