Primary care - public understanding and perceptions survey: analysis report
Findings from a survey run by the Scottish Government and The Scottish Centre for Social Research to understand public perceptions of primary care in Scotland.
5. Demographic variation
This section collates the differences highlighted throughout the report found between demographic groups for the variables collected, which are listed in Annex 2. All reported differences are statistically significant, though the analysis did not control for correlation between variables (for example, older adults and people experiencing socio-economic disadvantage are more likely to have one or more long term health conditions). It is therefore not possible to determine which variable explains the differences in responses. No other significant variations by demographic group were found, though this may be due to low sample sizes, especially for those not registered with a GP practice, families with over 3 children, single parent households and people with non-limiting long term conditions. Information on ethnicity was collected but not analysed due to the vast majority of the respondent population being white (96%). Sexual and gender identity were not collected and represent a gap in the analysis.
Age
Older participants (70+) were more likely to report:
- Having had contact with primary care across services in the past 12 months.
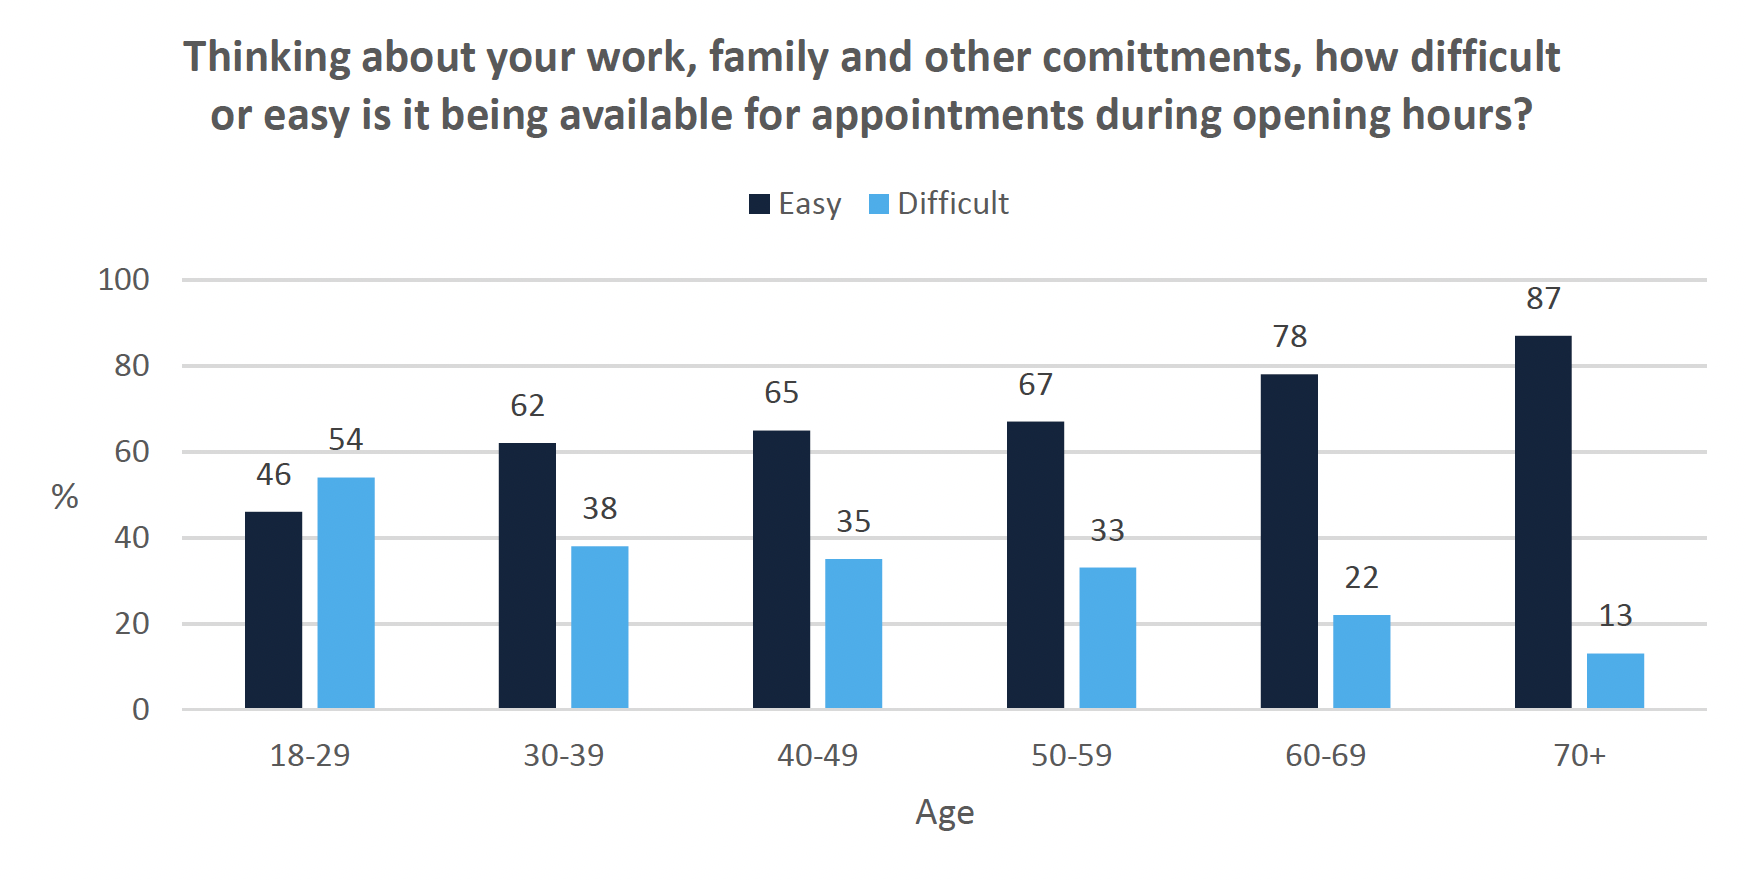
- Being available to contact their general practice.
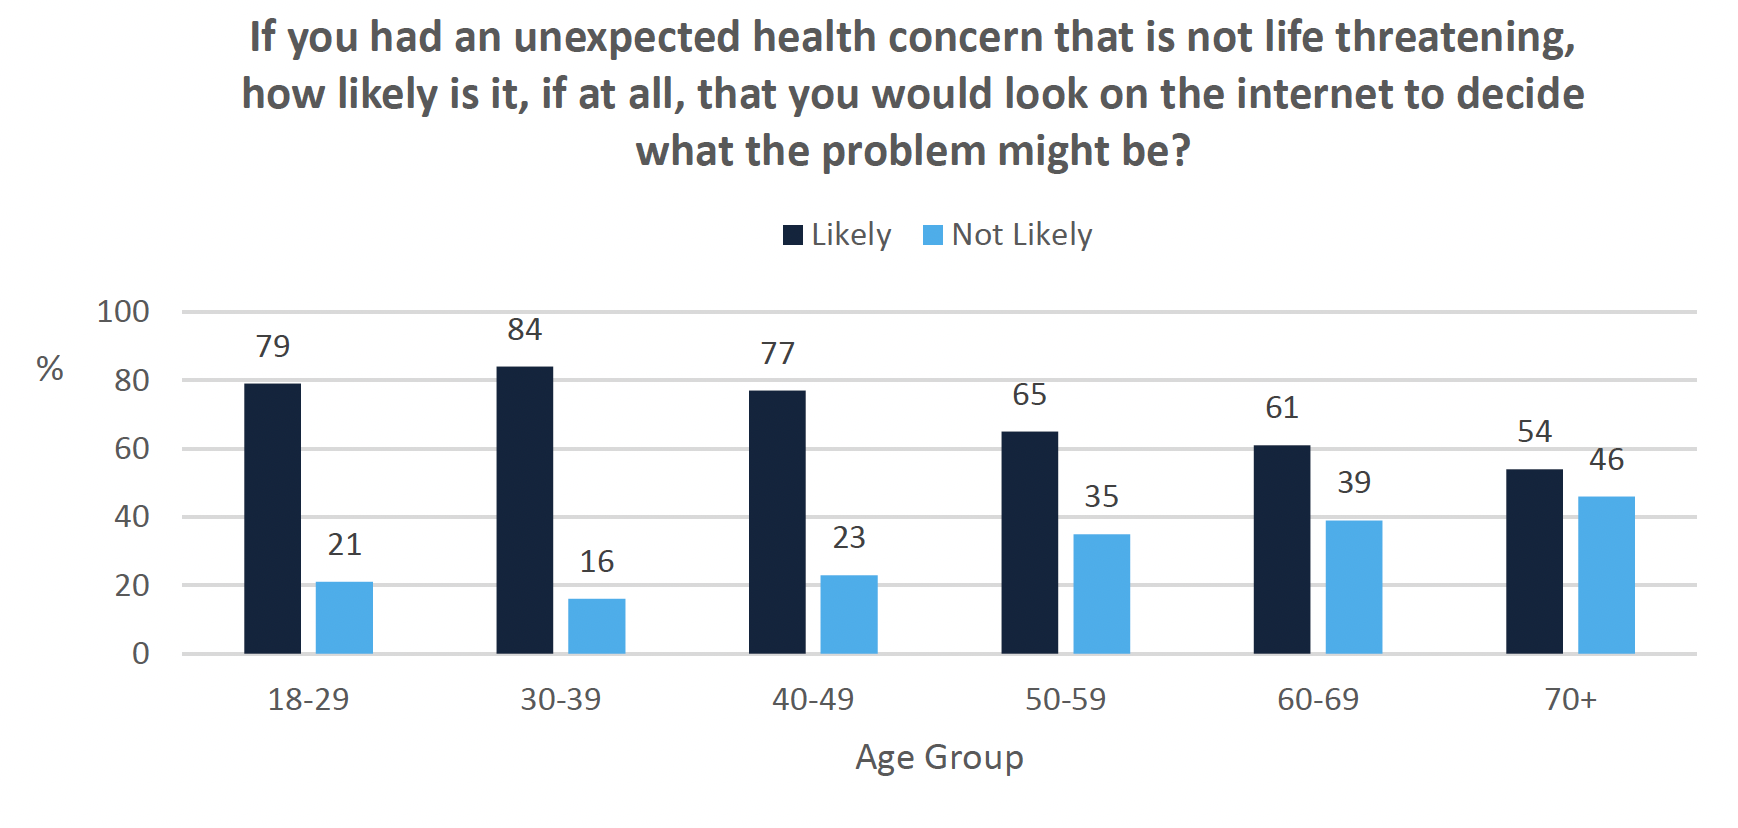
- Less likely to use the internet (Figure 14) or friends and family as a source of health advice.
- Lower awareness and trust in mental health professionals.
Younger participants (aged 18-25) were more likely to report:
- Using the internet and asking friends and family as a source of health advice.
- Higher awareness of and trust in mental health professionals.
- Being less available to contact and have appointments at their general practice (Figure 15).
Limiting long-term illness
Those experiencing a long-term condition were more likely to report:
- Contact with primary care over the past 12 months.
- Receiving care over the phone.
- Lower confidence in finding information about specific health problems.
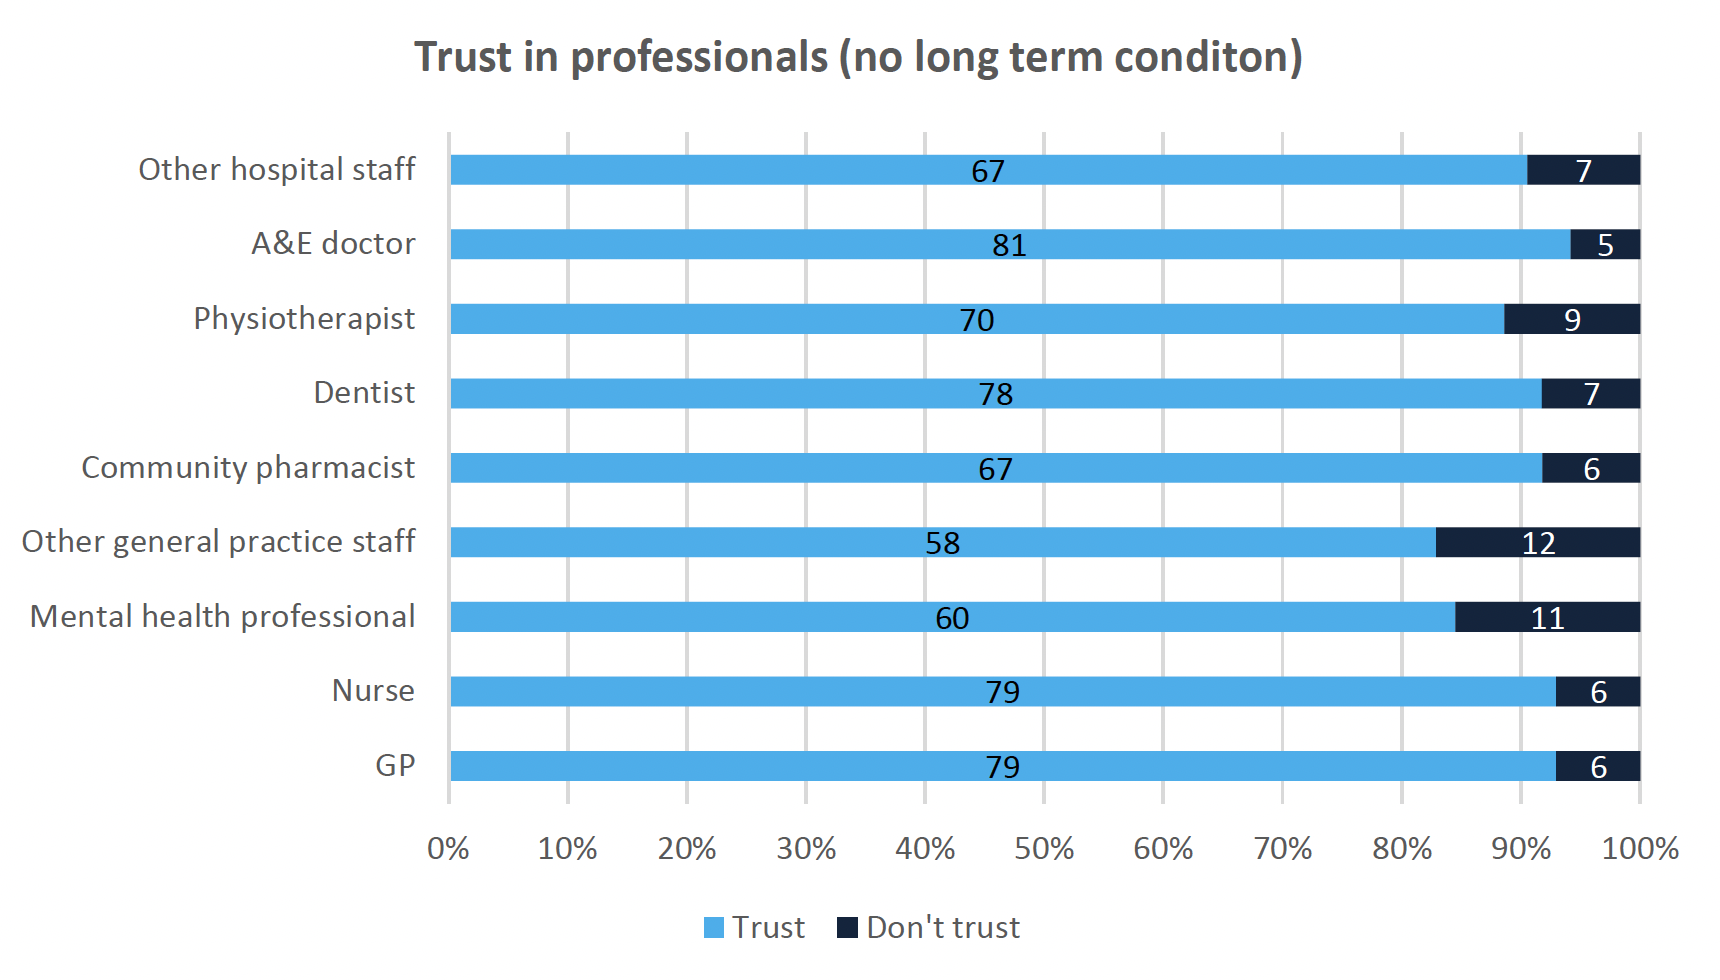
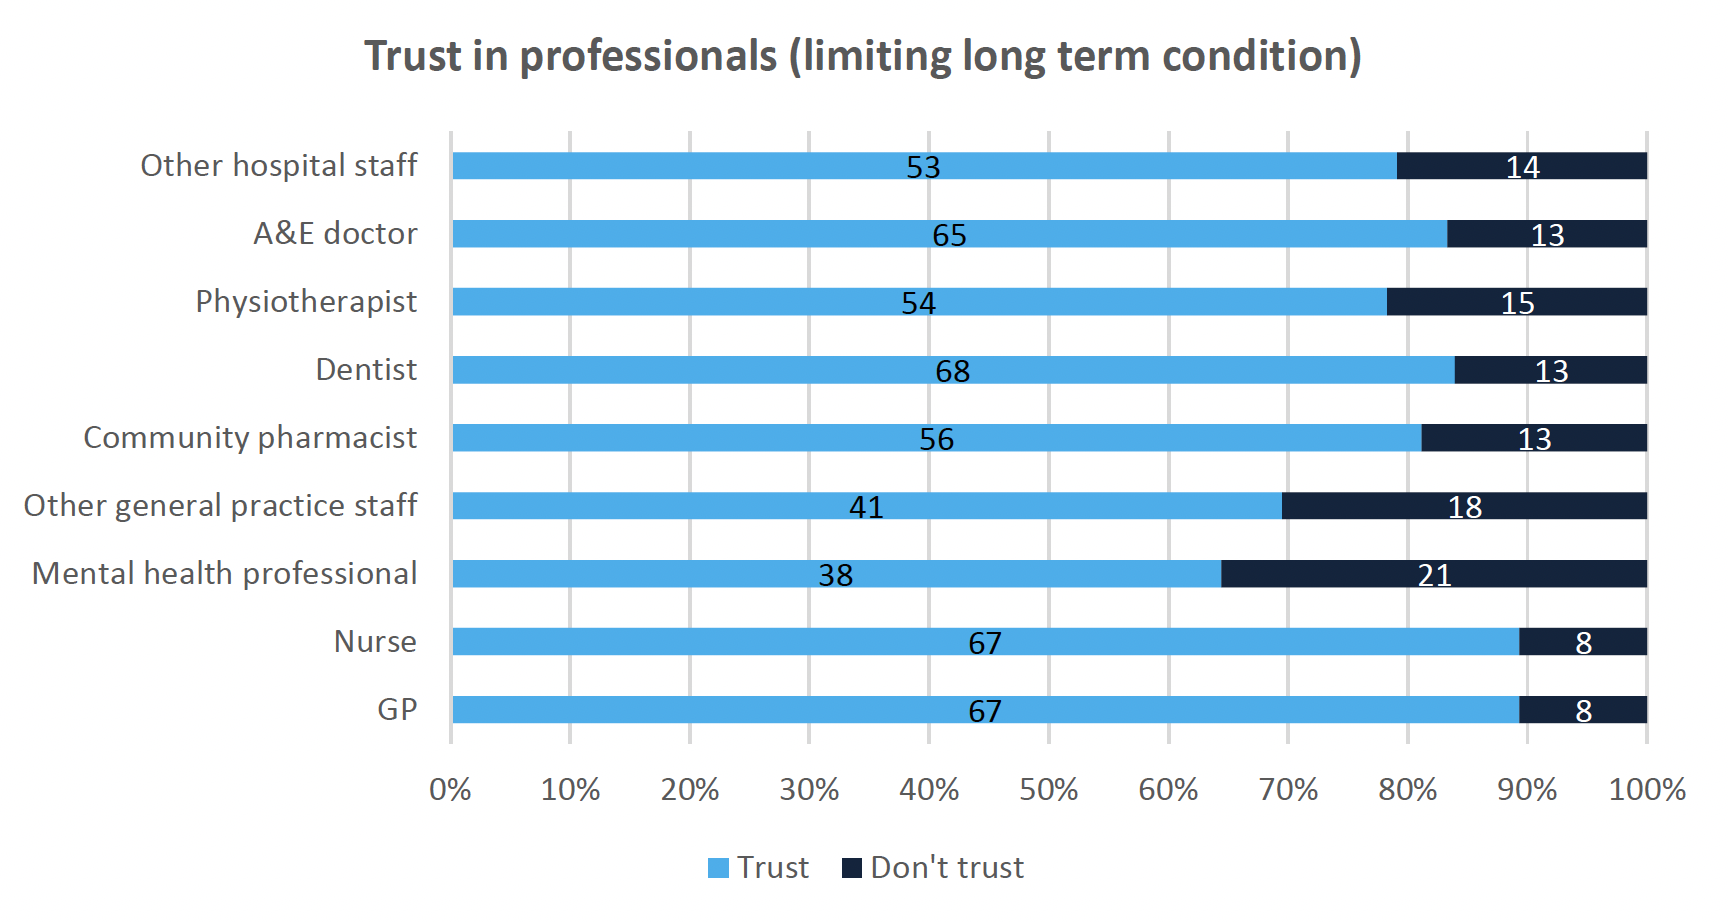
- Lower levels of trust across professions, as compared in figures 16 and 17 (excluding pharmacists based in general practice and NHS 24 where no significant difference was observed).
- Greater difficulty expressing their concerns and asking questions of health professionals.
- Greater availability for appointments.
Socio-economic deprivation
Some differences were noted based on respondents' social and/or economic status:
- Those with no or few qualifications were less likely to treat themselves first or using the internet before contacting their general practice
- People from the most deprived SIMD decile were more likely to report feeling confident they knew about a range of NHS services such as 111 and minor injuries, but those on lower incomes reported less confidence knowing who to contact when their general practice was closed. This may represent a discrepancy between confidence and competence.
- Respondents from more deprived areas reported less trust in GPs compared to other respondents and were more likely to say they would go to A&E and call 111 in response to a new, non-life threatening health concern.
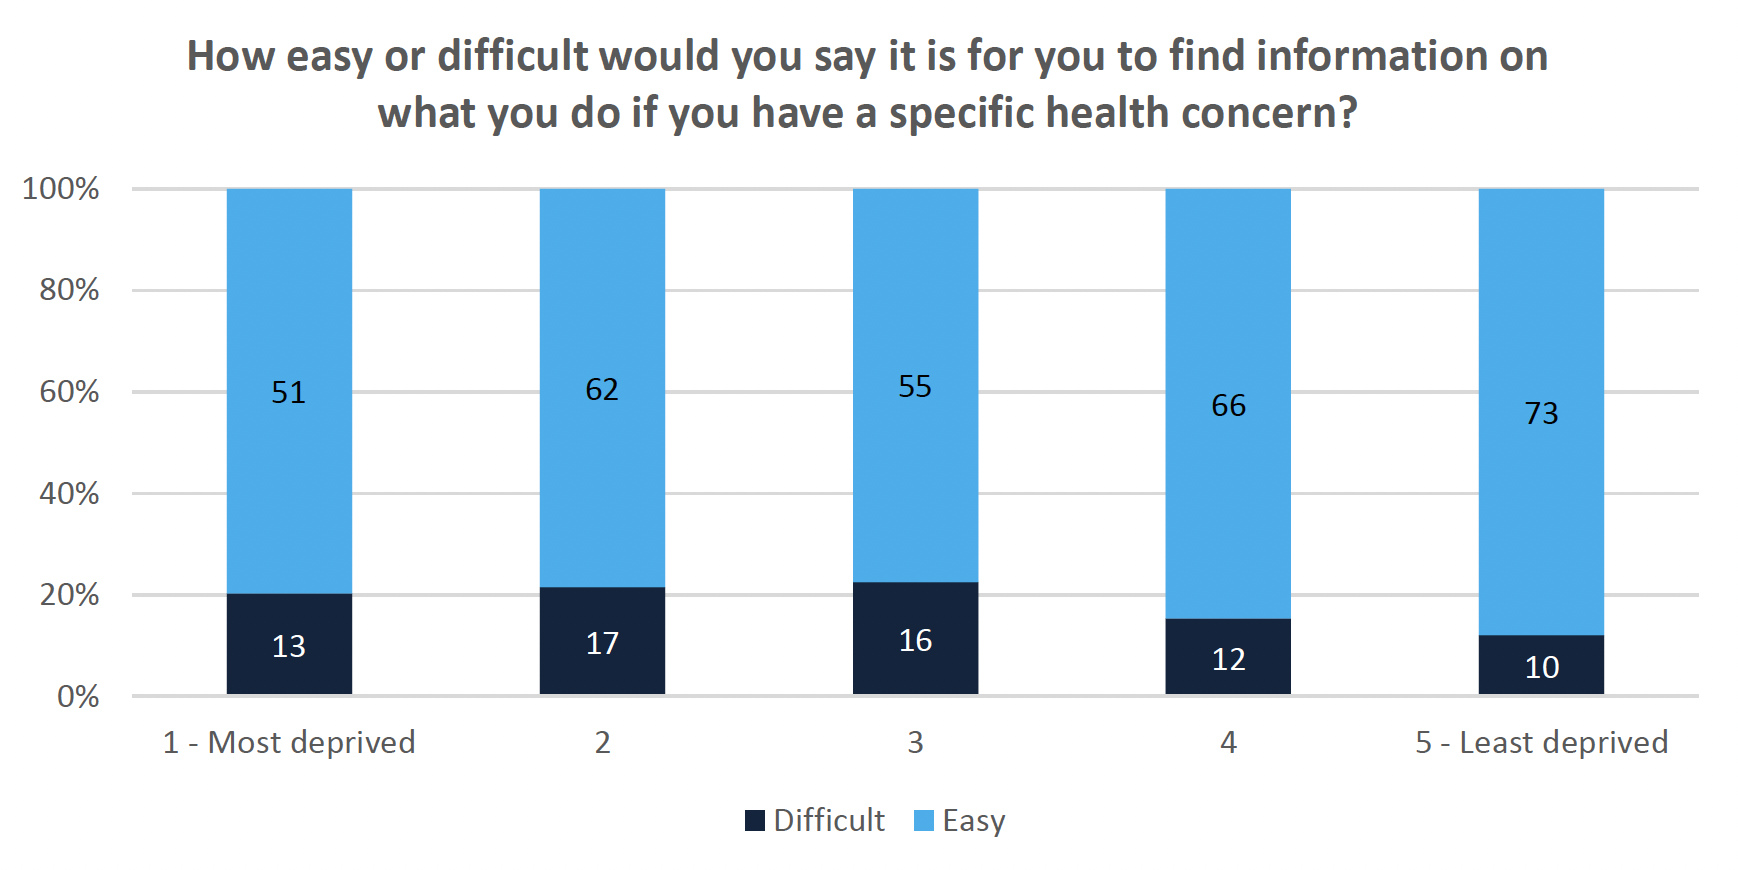
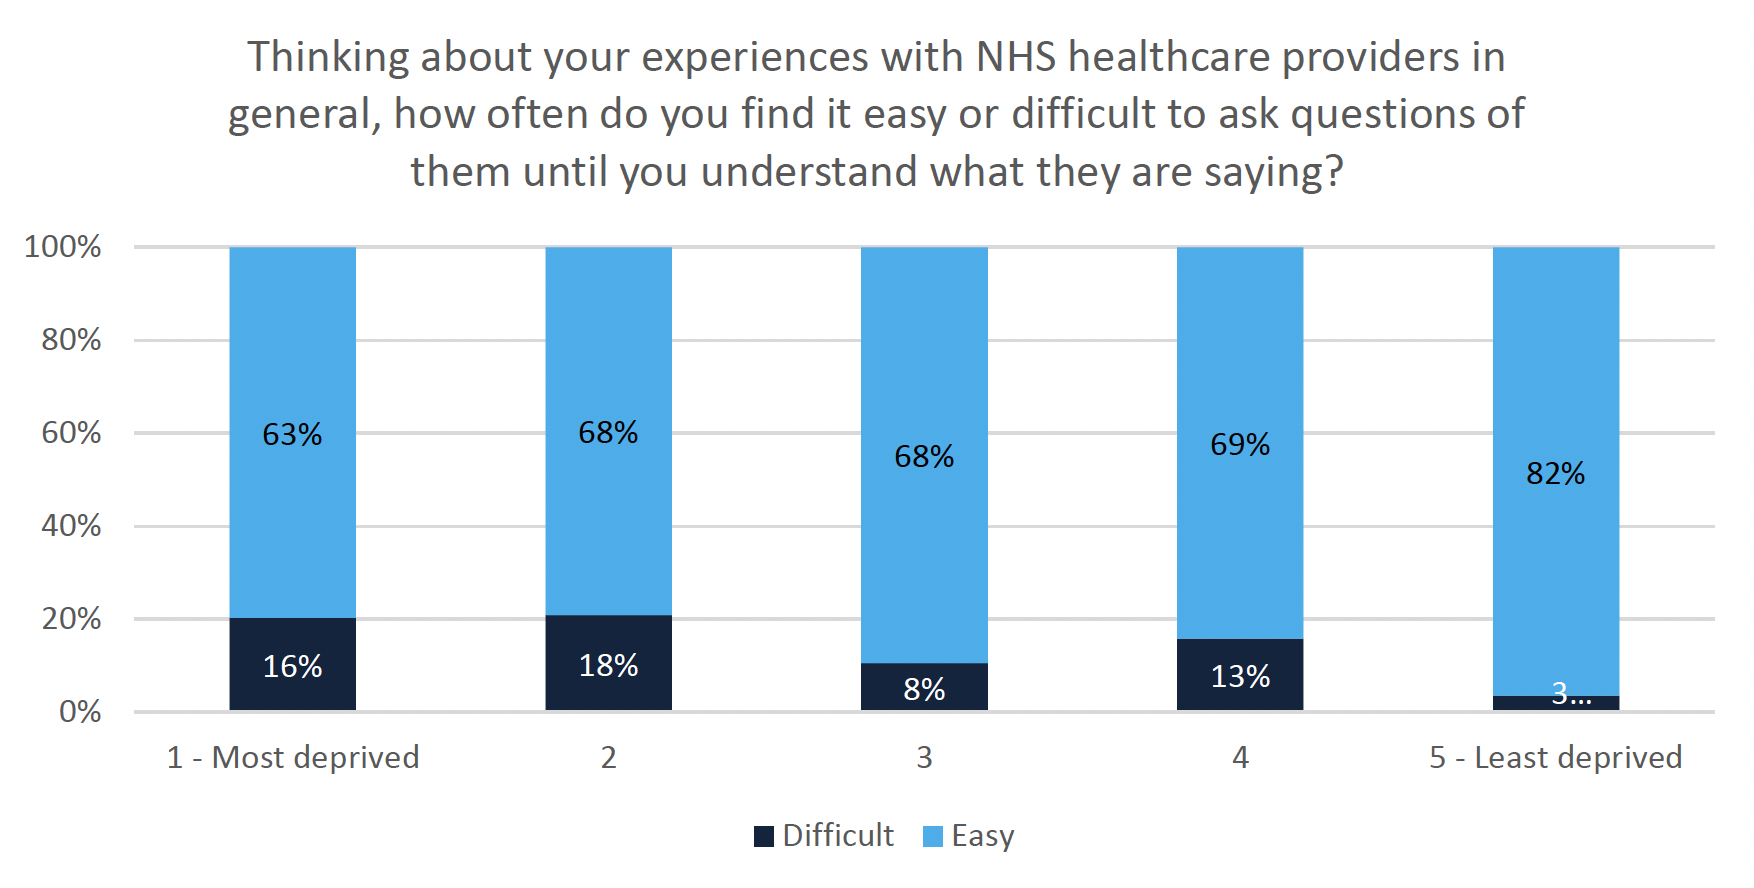
- Those living in the least deprived SIMD decile reported finding it easy to engage in their health care: they were more likely to report finding it easy to find information about specific health problems (Figure 18), express their health concerns, understand healthcare professionals and to ask questions of them until they understand (Figure 19).
Single-parent households
The survey indicated that single adults living in households with children may report being:
- More likely to visit a local pharmacy than other respondents
- More likely to receive care over the phone
- Less likely to be happy with a receptionist making a decision about who they should see
- And lower satisfaction with their most recent interaction with primary care.
However, as this group had a weighted sample size of only 32, these results may not be as generalizable or robust as other findings and should be treated with caution.
Other
The only differences found for other variables were:
- People living in rural areas were more likely to recommend their local pharmacy and think it was an appropriate place to receive care
- Females were more likely to use the internet as a source of health information and advice.
Contact
Email: socialresearch@gov.scot