Primary care - public understanding and perceptions survey: analysis report
Findings from a survey run by the Scottish Government and The Scottish Centre for Social Research to understand public perceptions of primary care in Scotland.
4. Results
Results are presented for each research theme in turn, followed by a summary of differences between demographic groups.
What & Where: Finding health and service information
The majority of people surveyed have accessed primary care in the last 12 months
Respondents were asked if they had contacted, visited or had an appointment with a range of primary care services in the last 12 months. The results are shown in Figure 1.
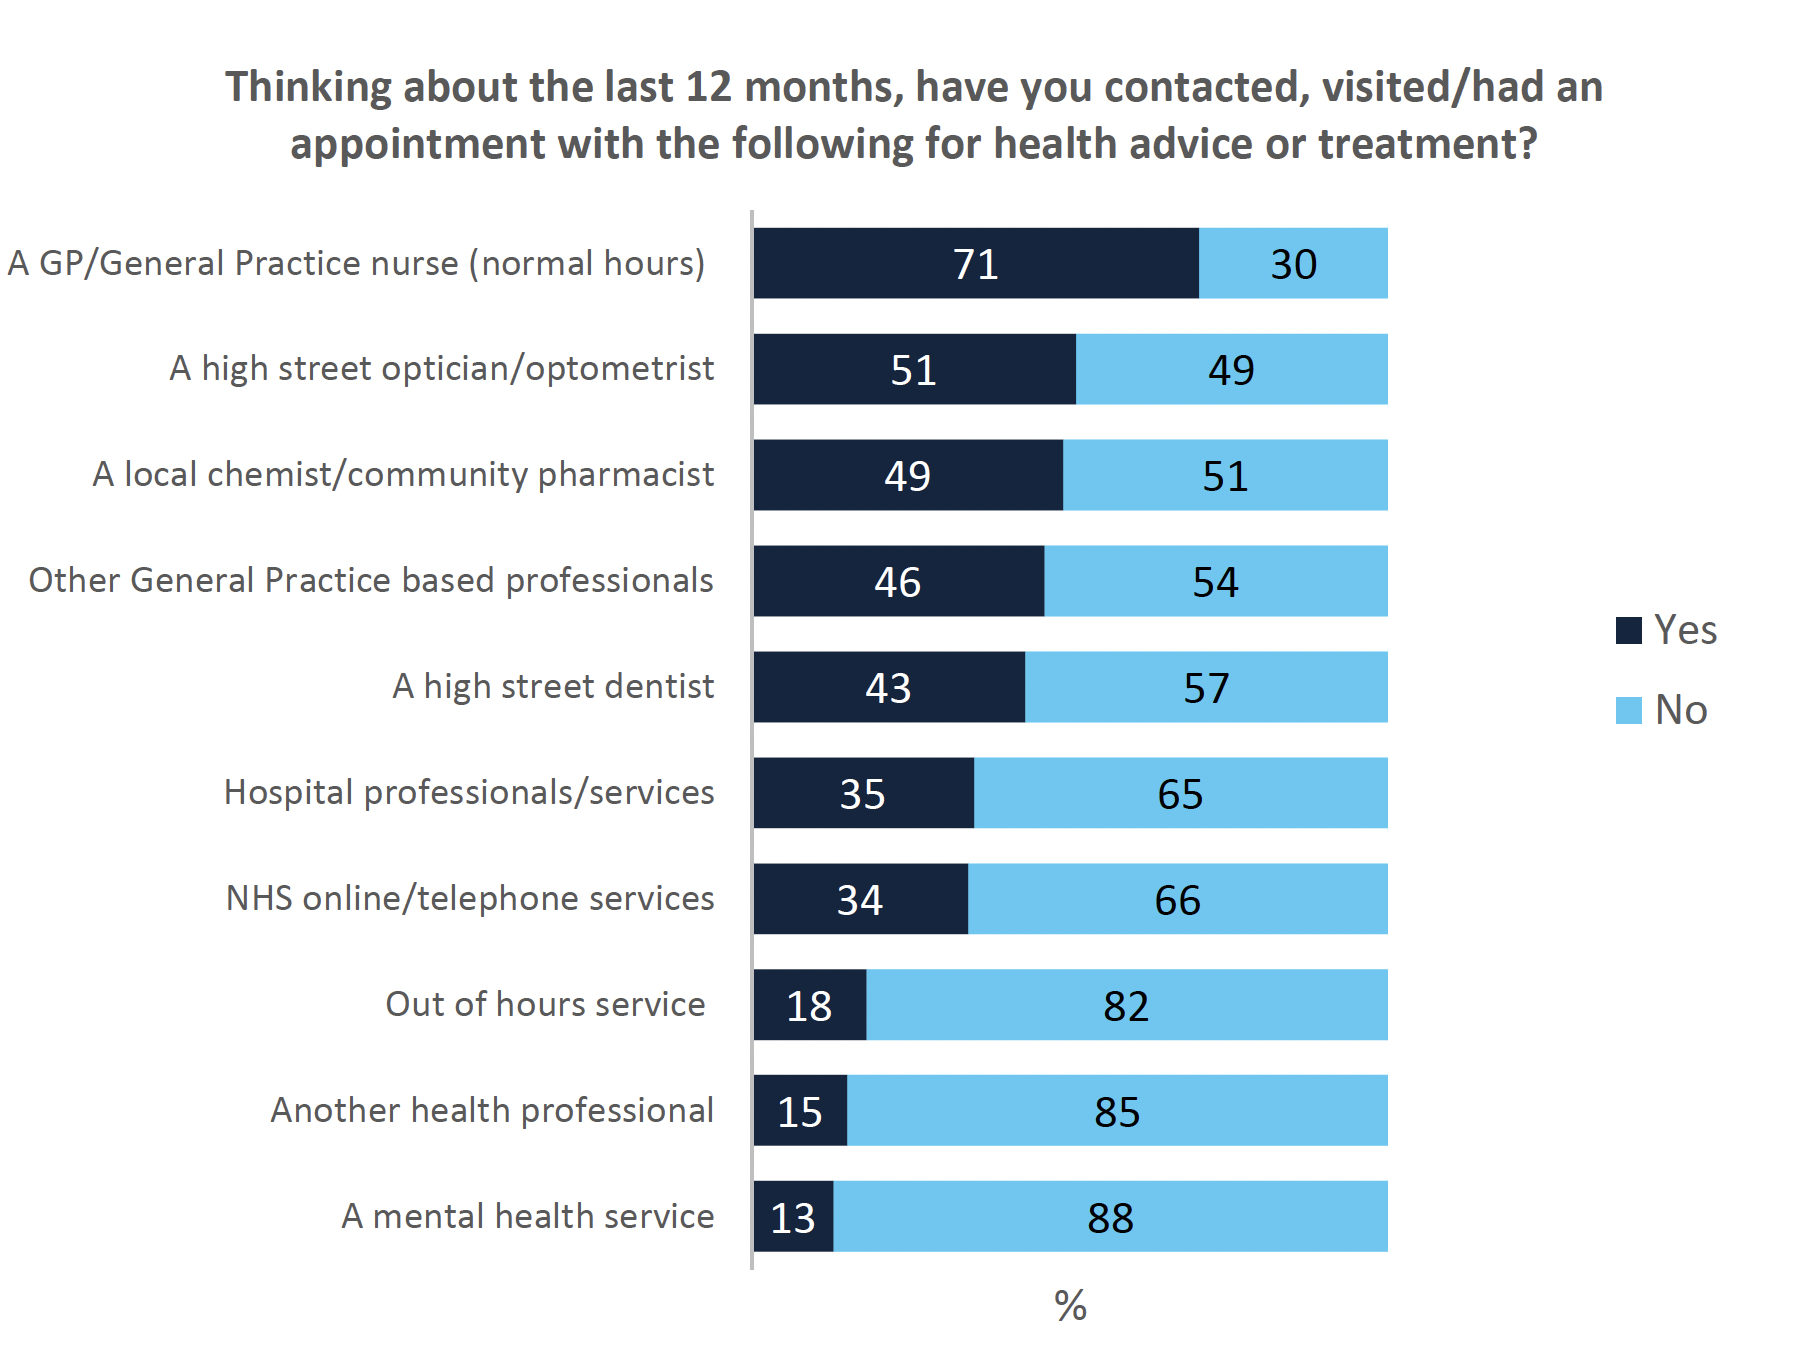
Most people (92%, n=1040) reported contacting at least one healthcare service in the last 12 months. The largest proportion of respondents had contacted a GP or a general practice nurse (71%), which is slightly lower than the number reported in HACE (77%). Contact was lowest for mental health services (13%).
Some variation between groups was noted:
- Contact with healthcare professionals was higher across services for those who were aged 60 and above and for people with limiting long term illnesses.
- Use of community pharmacy services was higher for those who had not contacted their GP in the last 12 months (57%) than those who had (20%).
- Single adult households with children were more likely to report seeing a local chemist than other respondents, however this was a small sample.
Friends and family are a common source of initial health advice
When asked what they would do about a hypothetical, non-threatening unexpected health concern, around seven in ten respondents (69%) indicated that they would ask family or friends what they should do about it. This varied by age and health status:
- This proportion was lower for those with a limiting long-term condition (60%).
- People aged 60 and above were less likely (61%) to ask friends and family for advice than those aged 39 and below (78%).
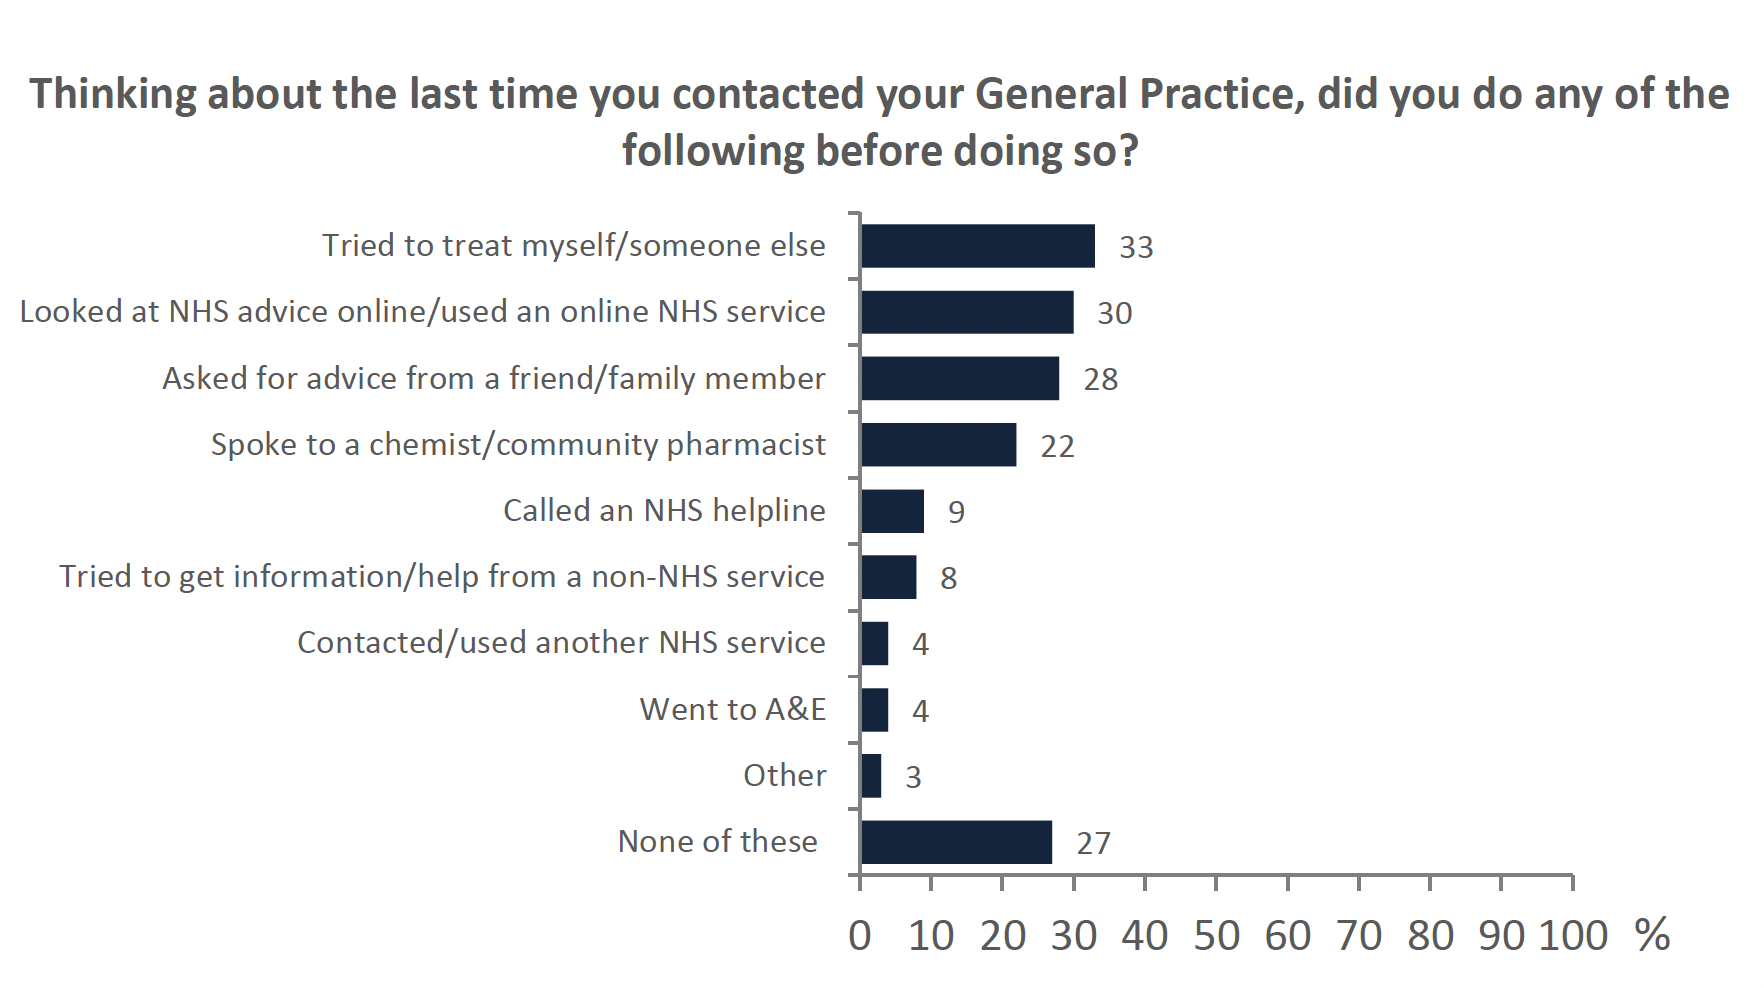
Those who had contacted a general practice in the last 12 months (71%, n=899), were asked if they had done anything else before they had visited their practice. Figure 2 shows these results.
- 28% indicated that they had asked for advice from a family member or a friend
- Around a third of respondents tried to treat themselves first (33%).
- Those educated to Advanced Highers (or equivalent) and above were more likely to treat themselves first.
The internet is a well-used source of health information
Figure 3 shows that respondents were more likely to use the internet as a source of health information rather than advice.
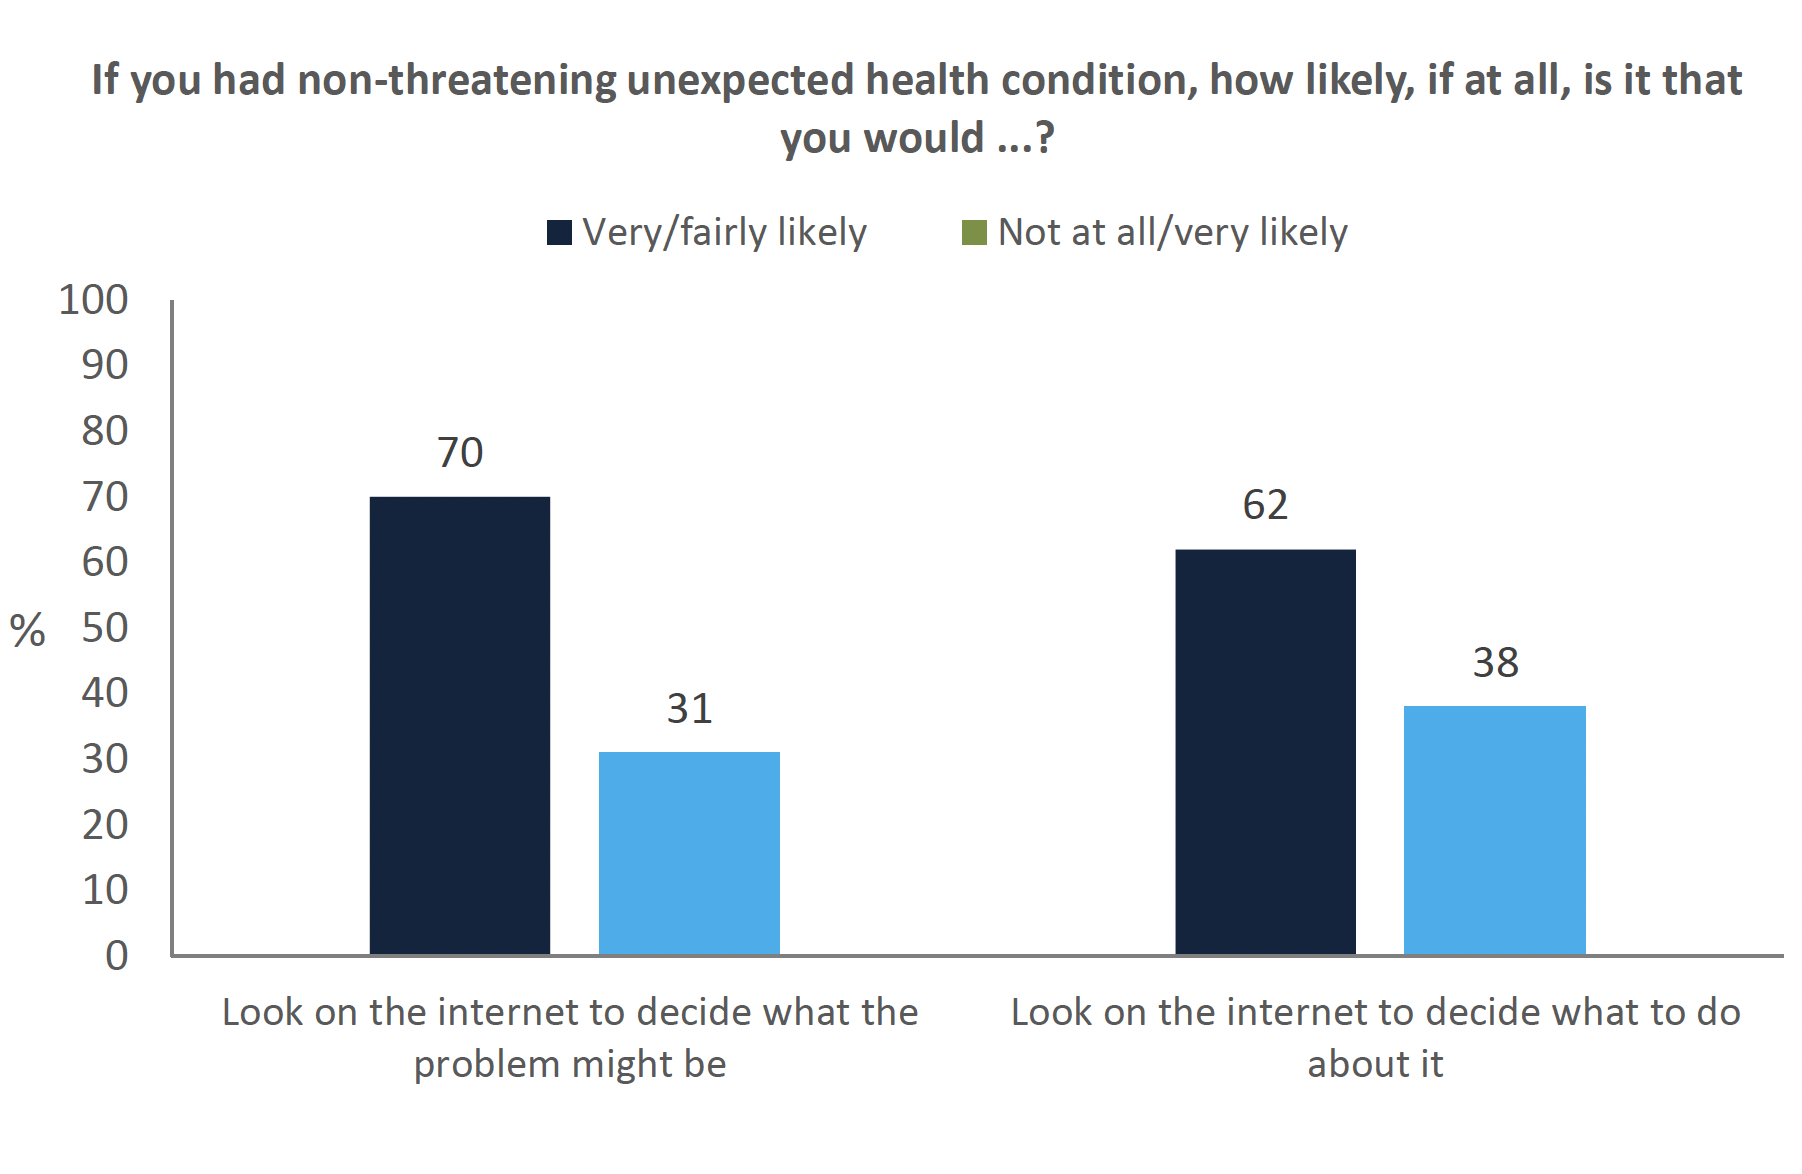
70% of respondents said they would look on the internet to find out what a new, non-life threatening health problem might be. This proportion was significantly higher for:
- Females (74%) than males (65%).
- Those qualified to degree level or above (82%) compared to those with no qualifications (43%).
- People aged 49 and below (80%) compared to those aged 60 and above (57%).
Respondents were less likely to use the internet to decide what to do about a new health problem (62%). This also varied by demographics:
- As above, females (67%) were more likely to report this than males (57%).
- Those educated to degree level or higher were more likely to use the internet to decide what to do about a new health problem (76%) than those with no qualifications (35%).
- Those aged 60 and above were much less likely to use the internet (47%) than those aged 18-29 (71%), 30-39 (83%) or 40-49 (69%).
- Households with 2 adults and 2 children were significantly more likely than other household types to use the internet. No differences were detected for other households with children but these groups had smaller sample sizes.
Those who had actually visited a general practice in the last 12 months were asked if they had done anything else before they had visited their practice (Figure 2). Three in ten had looked online for NHS advice first (30%). This varied by age and ranged from 49% of those aged 18-29 to 14% of those aged 70 and over. Just 2% of those who used the internet on a weekly basis or less often had done so compared with 34% who used the internet several times a day and 28% who used it on a daily basis.
Mixed confidence finding information about specific health problems
When asked how easily respondents could find information about a specific health problem, a small majority of people found this easy (61%) whereas 14% found it difficult. This varied by:
- Health status - fewer people with a limiting long-term illness found it easy to find information compared to those without long-term illness (49%).
- Socio-economic deprivation - those with no qualifications (41%) found it harder to find information than those educated to degree level or above (71%). Similarly, fewer people on a household income of £1000 or less per month reported finding it easy to find information (51%) than those on an income of £2500 or more (74%).
- Responses did not very with internet use, suggesting that digital access was not a key barrier to finding information about health problems.
High confidence in finding information about NHS services
Respondents were asked questions on their knowledge of the range of services, opening hours and where to go when NHS services were closed. Figure 4 shows these results. Respondents reported greatest confidence in finding opening hours (90%). This varied by internet use from 93% among those who used the internet several times a day versus 80% who used it weekly or less often.
The majority of respondents also knew about the range of services available such as NHS 111, minor injuries, local pharmacy etc. (79%) and where to go when their practice was closed (78%). Those living in the most deprived SIMD decile were more likely to report feeling confident that they knew about the range of services available (90%).
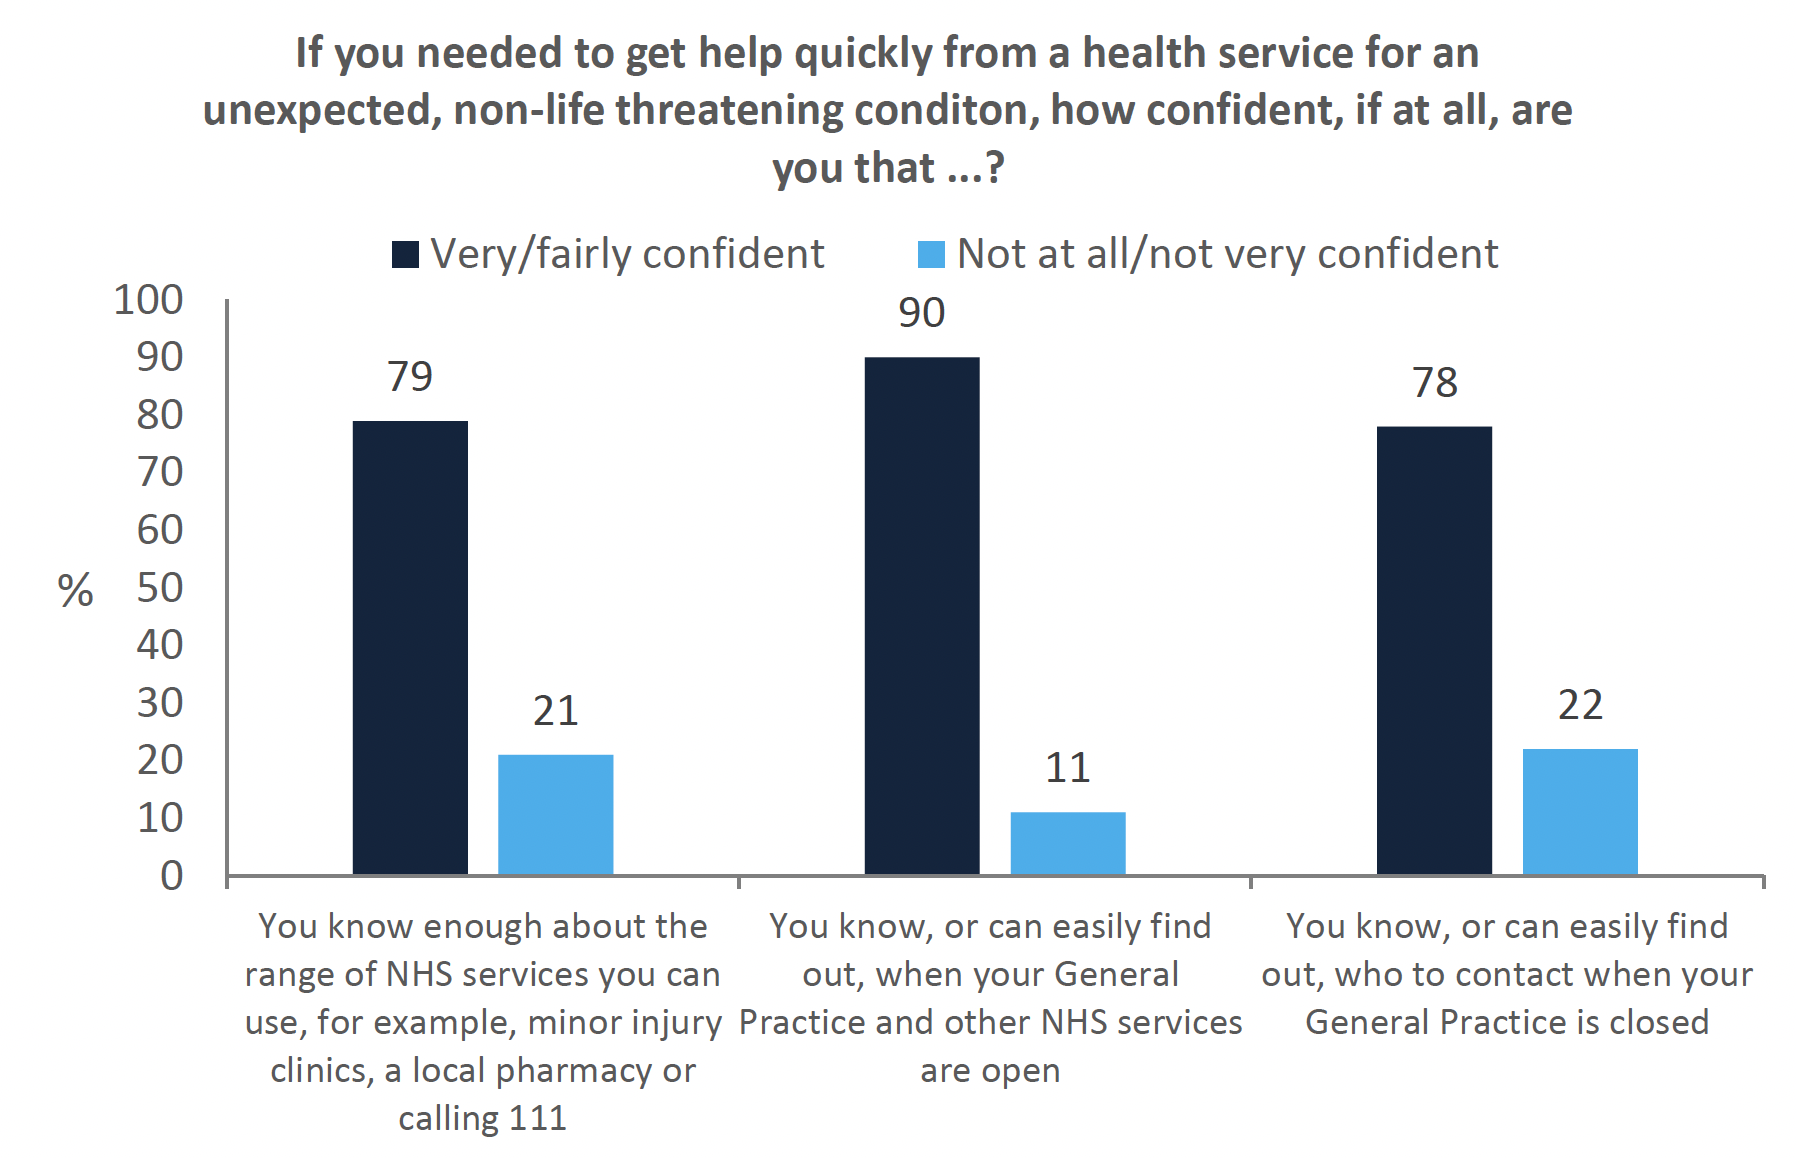
22% of respondents reported not knowing who to contact when their general practice was closed, which may be a factor contributing to unnecessary trips to hospital accident and emergency departments (A&E). This figure was higher for those on a household income of £1,500 or less per month (26%) than those on an income of £2,500 or more (14%). This may suggest a discrepancy between confidence and competence in accessing services for some.
General Practitioners are still seen as the first point of contact
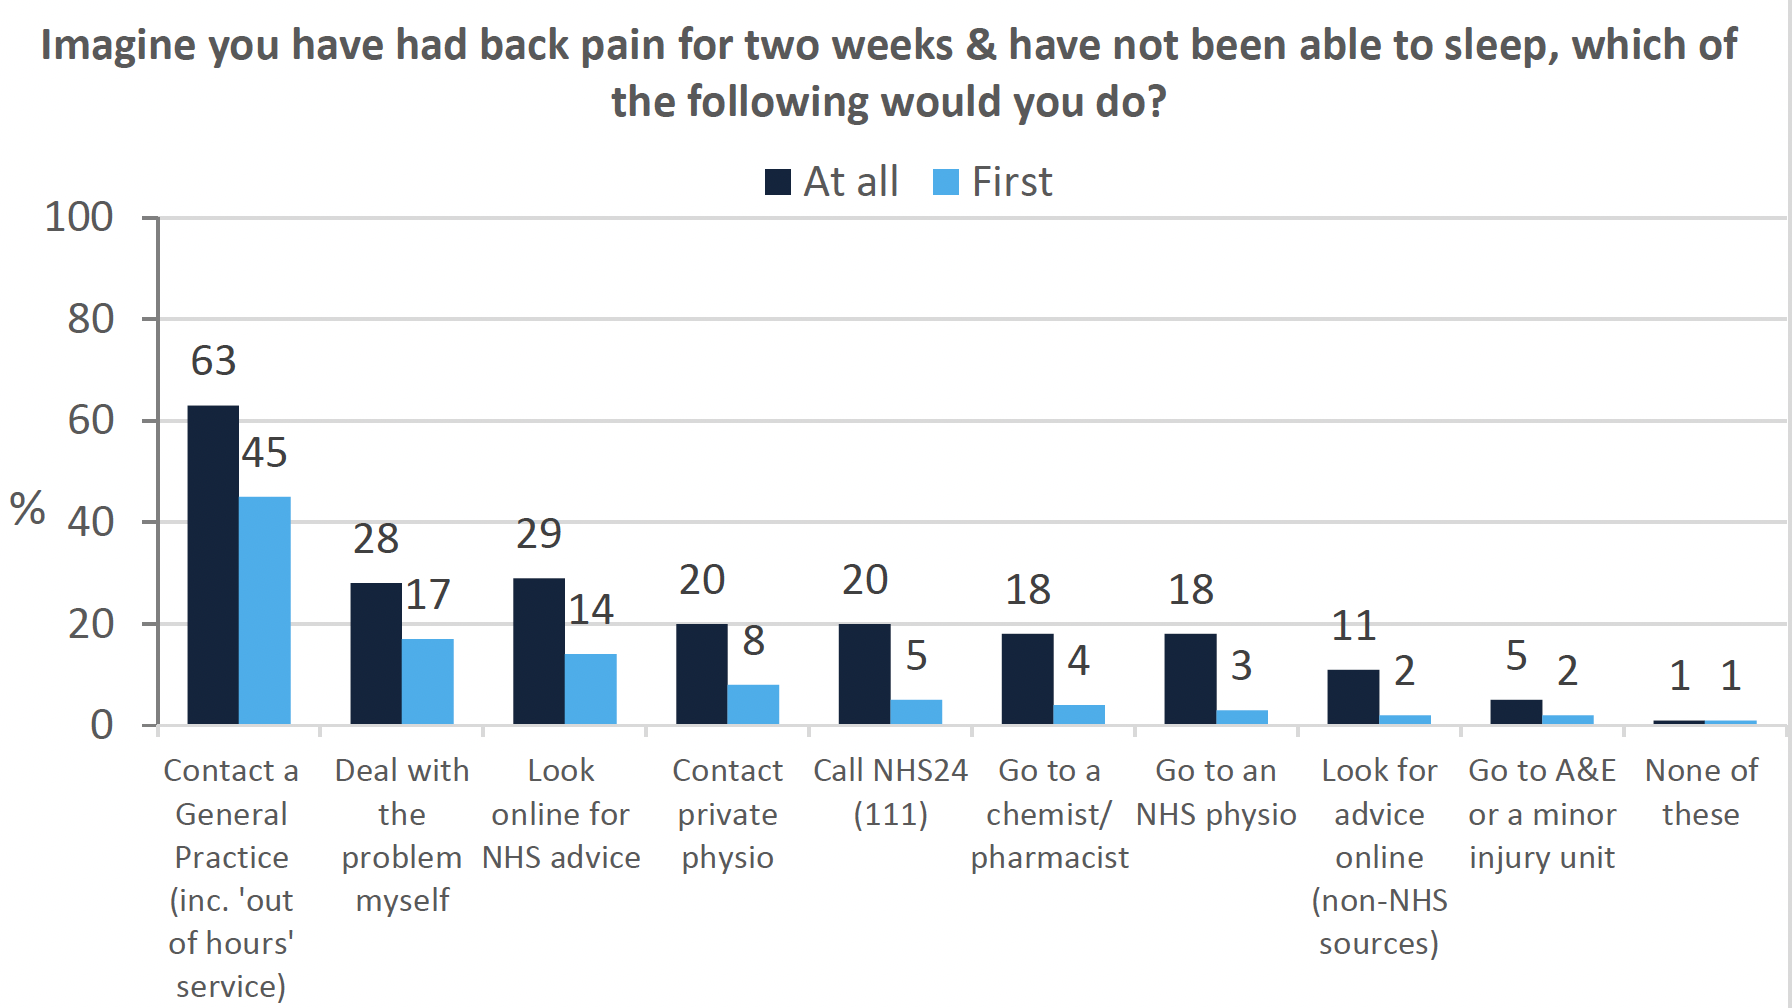
When asked to imagine what respondents would do if they had back pain that prevented them from sleeping (Figure 5), the most common response was still to see a GP (63%) rather than self-refer directly to a physio (either privately (20%) or through the NHS (18%)).
People educated to degree level or above were more likely to treat the problem themselves (33%) than those with no qualifications (15%), who were significantly more likely to go A&E (13%) than other respondents (5%). People living in the most deprived SIMD decile and in urban areas were more likely to call 111.
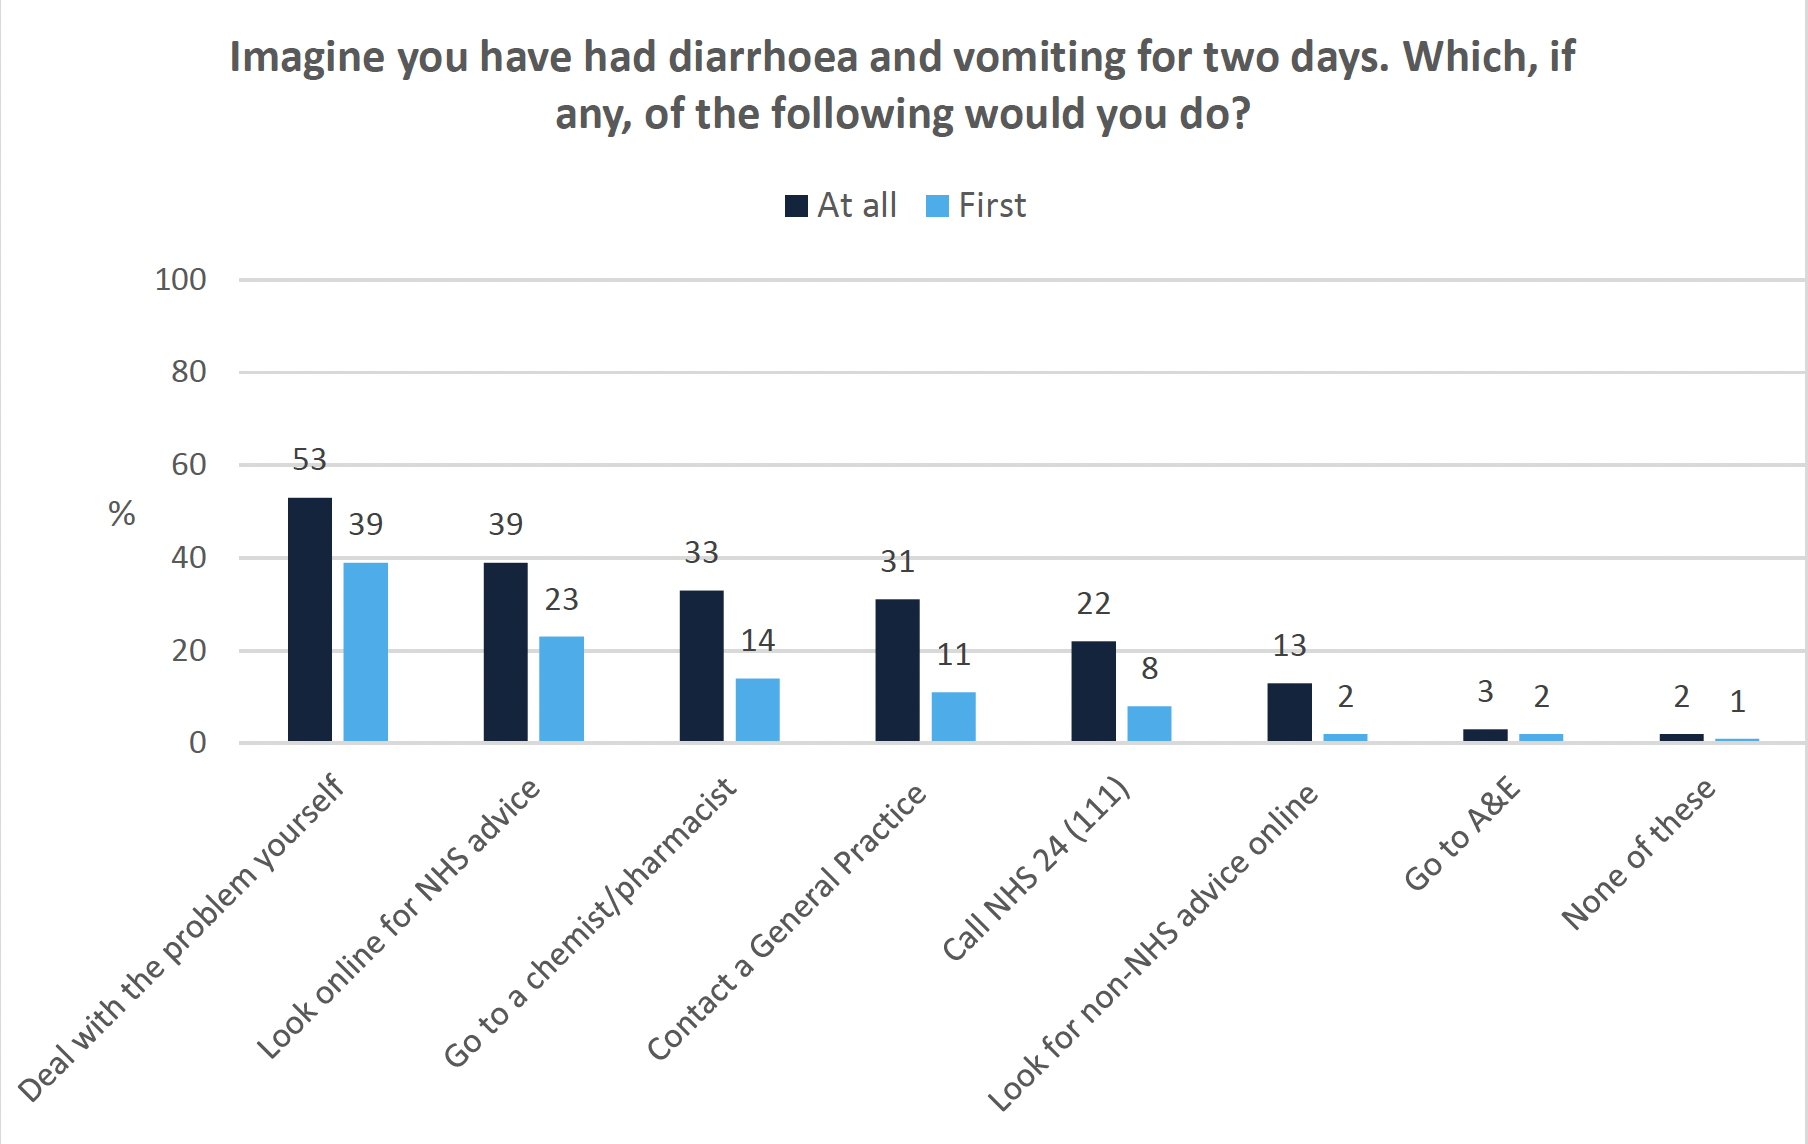
Responses also varied depending on the scenario presented, for example, when people were asked to imagine they had vomiting and diarrhea for two days (Figure 6), they were more likely to deal with the problem themselves (51%) or look on the internet (39%) than see a GP (31%).
Seeing a GP at all was more likely for those living in the least deprived SIMD decile and people aged over 70. In this scenario, 14% would contact their GP first. One third (33%) of people said they would go to a chemist at all, and this was significantly more likely for those aged over 70 (50%) and those living with a limiting long term illness (76%). However, only 11% of people said they would go to their chemist first and a higher proportion (14%) would still go to their GP first.
The respondents who had visited a general practice in the last 12 months (71%, n=899) were asked if they had used any other services first (Figure 2). One third of people (27%) did nothing else first and relied solely on their GP. 22% of people said they had gone to see a chemist first, which is higher than the hypothetical scenario above (11%). This may be due to different responses depending on the condition, or issues around availability and accessibility.
This interpretation is supported by the fact that people living in rural areas were more likely to agree that their chemist/community pharmacist was an appropriate place to access treatment. Those living as single adults with children were also more likely to have visited their local pharmacy in the last 12 months. However both these groups had small sample sizes and the results should be interpreted with caution. Overall, when accessing primary care, most people across a range of scenarios were more likely to go to their GP than directly to another service.
Who: Trust, Confidence and Experience with Professionals
Mixed awareness of professionals in general practice
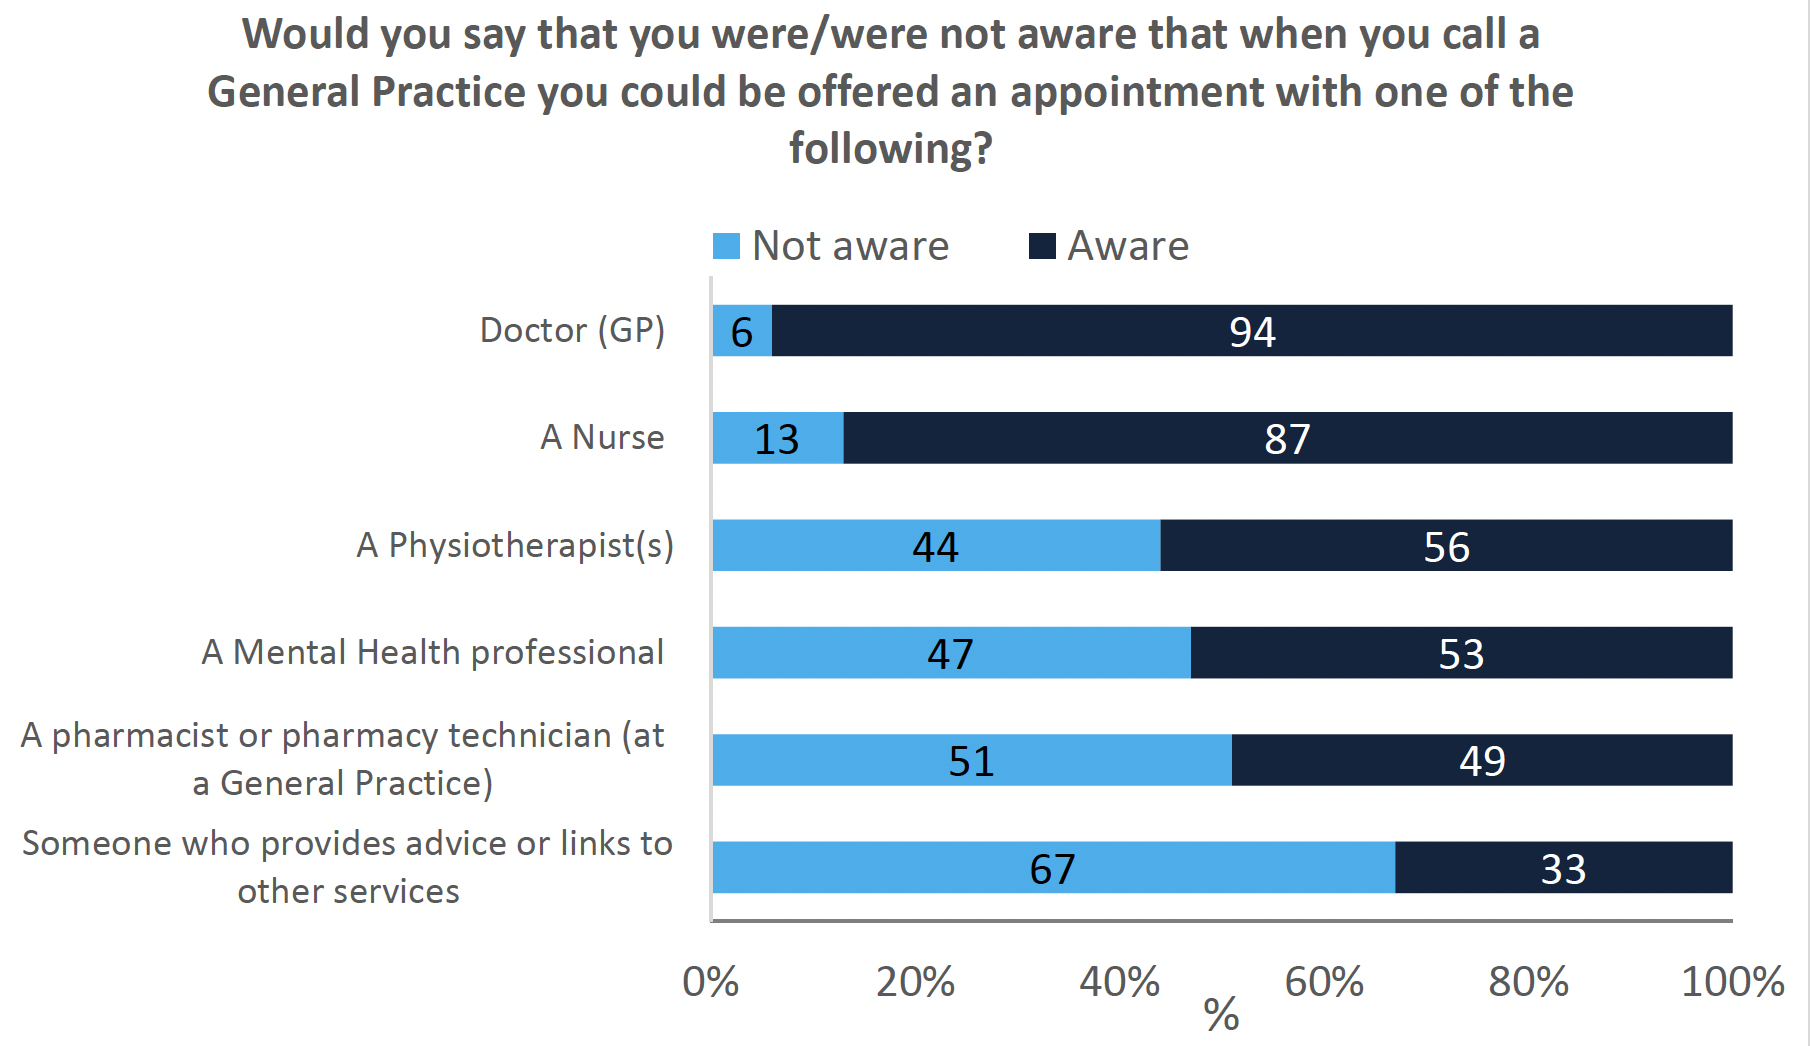
Respondents were asked if they were aware of the range of professionals they may be offered an appointment with at a general practice, depending on their health condition (Figure 7).The vast majority of the respondents were aware that they could be offered an appointment with a doctor (94%) or with a nurse (87%). 17% of those with no formal qualifications were not aware they could be offered an appointment with a doctor.
Around half of respondents were aware that they could be offered an appointment with a physiotherapist (56%), a mental health professional (53%) and/or a pharmacist/pharmacy technician (51%) based at the practice. Respondents were least aware that they could be offered an appointment with a member of the multi-disciplinary team who provides advice or links to other services (33%).
Awareness may be shaped by both experience and prevalence of services. For example, community link workers provide information about, and support patients to access, social and community services. They are mainly (but not exclusively) located in areas of deprivation and not every practice has access to one. Awareness of these roles was significantly higher for those with a limiting long term illness (78%) but did not vary by education or income.
Some groups had more awareness of mental health professionals than others. Awareness was higher among those aged 18-29 (75%) compared with those aged 70 and over (41%). This could be related to the higher rates of diagnosis[7] and awareness[8] of mental health conditions in younger people.
High trust in doctors, nurses and dentists
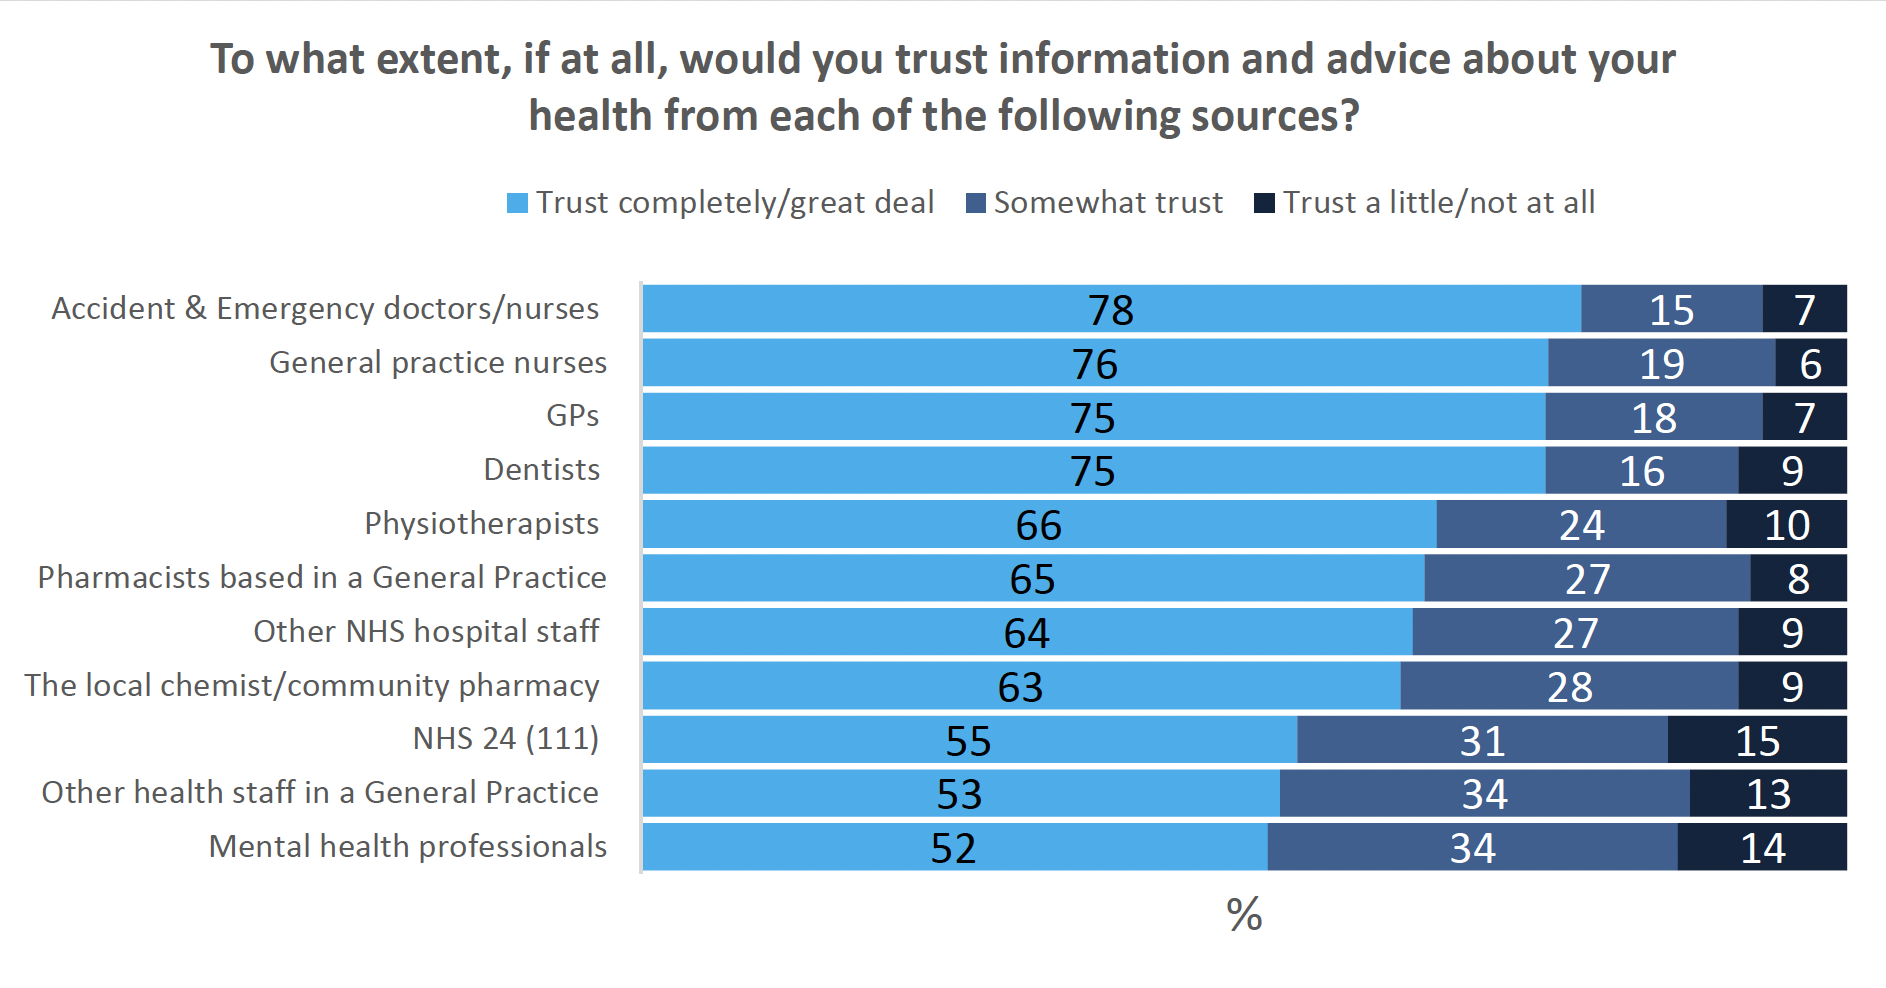
Figure 8 shows trust in information and advice provided by different professionals. High levels of trust were reported in A&E doctors and nurses (78%), general practice nurses (76%), GPs (75%) and dentists (75%). Trust was lower across professional groups for those with a limiting long-term illness.
Trust in GPs varied across deprivation and income levels. Trust was higher among those living in the least deprived areas (84%) and with a household income of £2,500 or more per month (86%).
Mixed trust in the broader multi-disciplinary team
Trust in multi-disciplinary team staff was mixed, with around two thirds saying they trusted physiotherapists (66%) and pharmacists (65% for those based in practice versus 63% in the community). However, in response to a later question, 79% of people said they felt confident that the staff in community pharmacies could provide health advice and care while 13% did not think their community pharmacy was an appropriate place to access care.
Differences in trust were reported for non-clinical staff such as receptionists depending on location (64% in hospitals versus 53% in practices). Despite high reported usage of NHS 24 (which includes online and telephone information), respondents reported lower levels of trust in this service (55%).
The lowest level of trust was in mental health professionals, with 52% of people stating that they trusted them completely or a great deal. This varied by age, with those aged 60 and above and/or with a limiting long term illness reporting lower levels of trust.
Trust may be related to awareness and/or experience (e.g. professional groups that had higher levels of awareness also had higher levels of trust), however this survey did not gather sufficient data to test this statistically. No differences in satisfaction were found between professional groups.
Preference for signposting by a General Practitioner
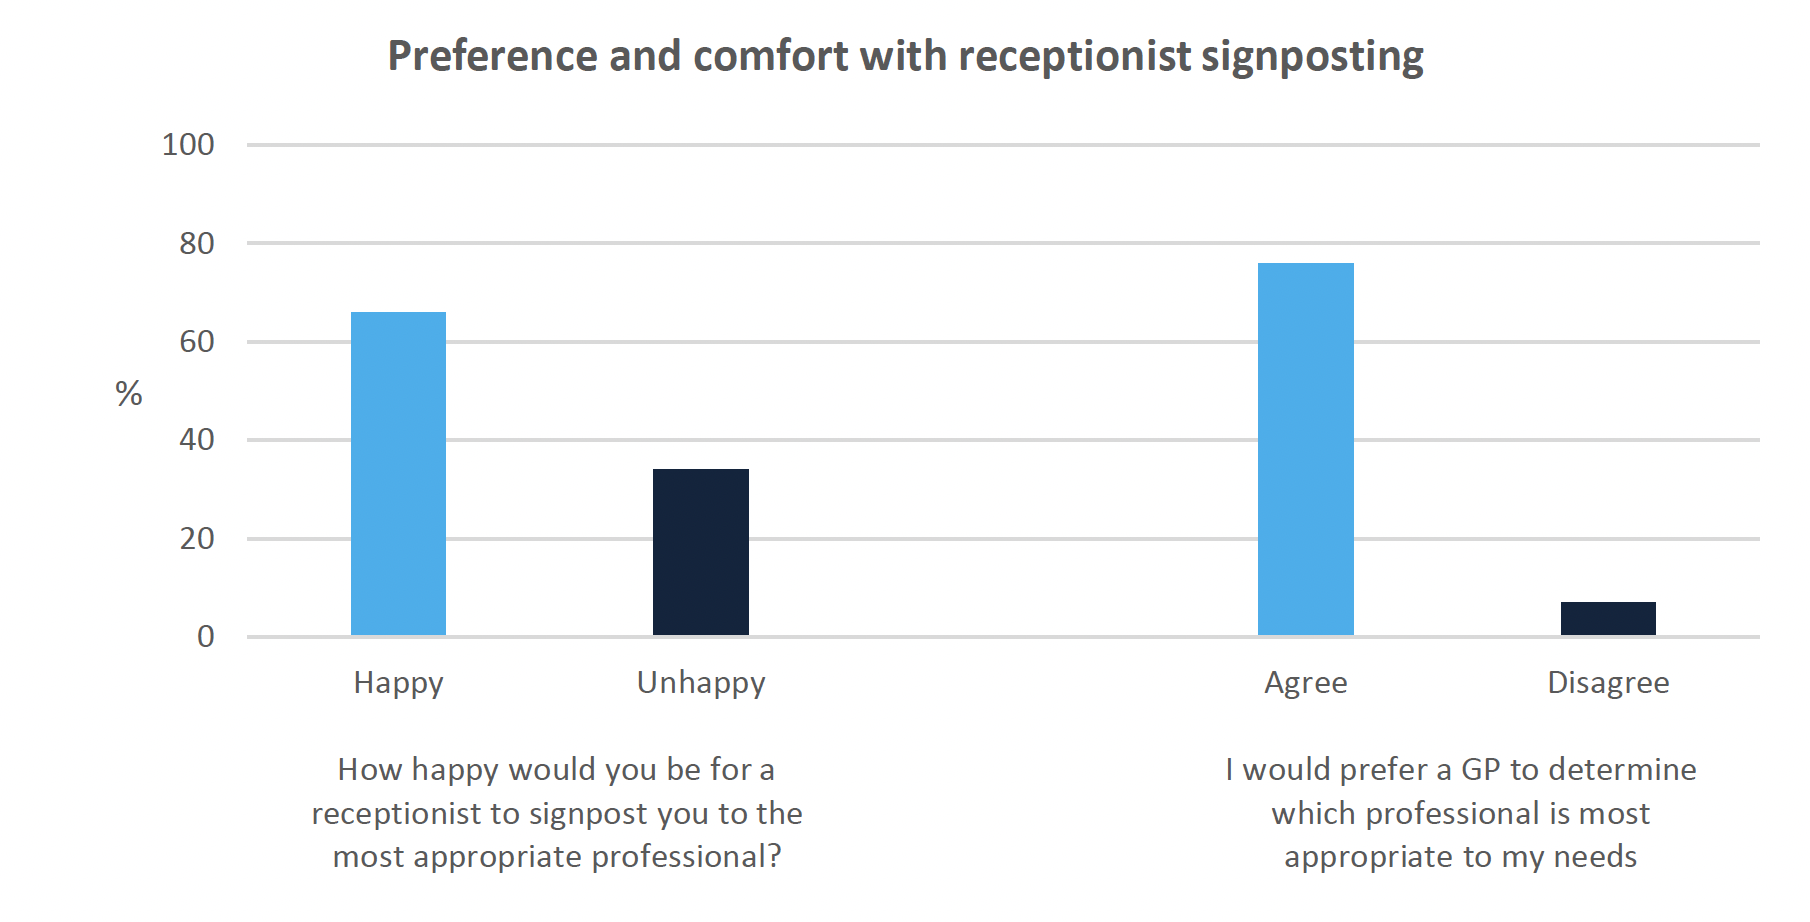
Trust in non-clinical general practice staff was mixed (53%). Despite this, the majority of people (66%) said they were happy for a receptionist to signpost them to the most appropriate person to meet their needs. However, around a third (34%) reported they were quite or very unhappy about this. This was more likely for households with a single adult and children (note: small sample size). Although many people were happy for this decision to be made by a receptionist, the majority (76%) would still prefer a GP to make this decision, as shown in Figure 9.
Most people feel listened to, while not everyone feels understood
Figure 10 shows how easy or difficult respondents found communicating with healthcare professionals. Most respondents understood the healthcare advice and treatment given to them by providers in general (78%). Understanding healthcare advice was reported as more difficult among those with no qualifications (18%) than the overall sample (5%).
By contrast, 84% of respondents said that, on their most recent visit to primary care, the professional they saw made sure they understood the information they were being given. This suggests that a small proportion of respondents do not communicate when they don't fully understand the information given.
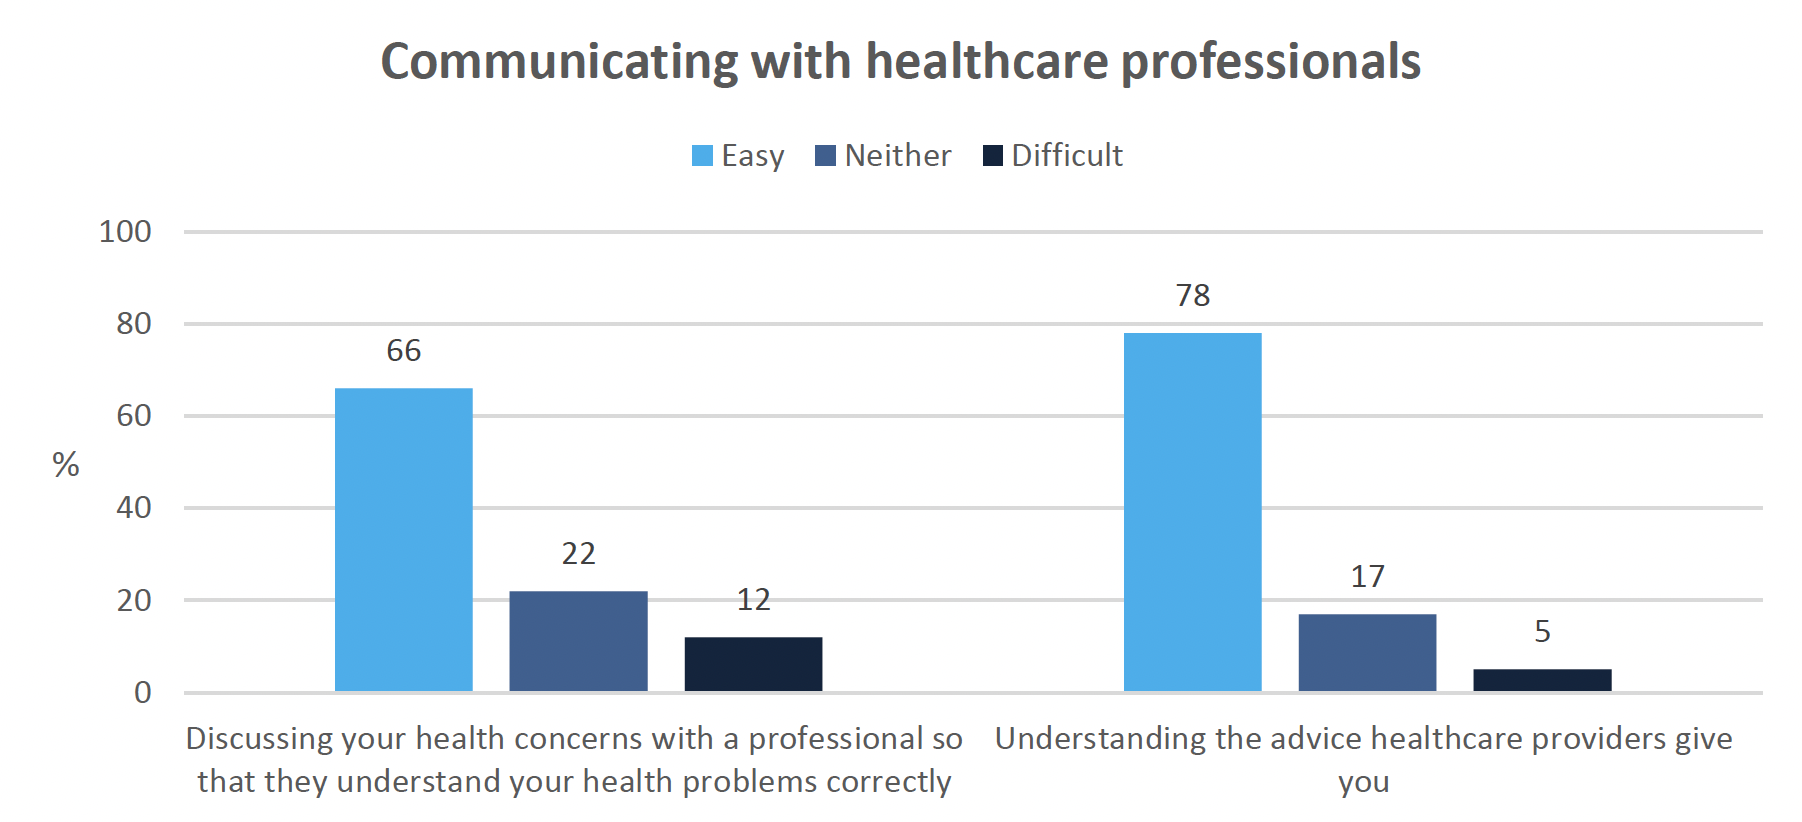
Whilst the vast majority of respondents (92%) indicated that they felt listened to on their most recent interaction with a primary care professional, only 66% of people generally found it easy to discuss their health concerns so that they were understood correctly, while 12% of respondents reported this being difficult (Figure 10). Those living with a limiting long-term condition reported greater levels of difficulty expressing their concerns whilst those living in the least deprived SIMD decile reported finding this significantly easier.
Asking questions may be difficult, even when given the opportunity
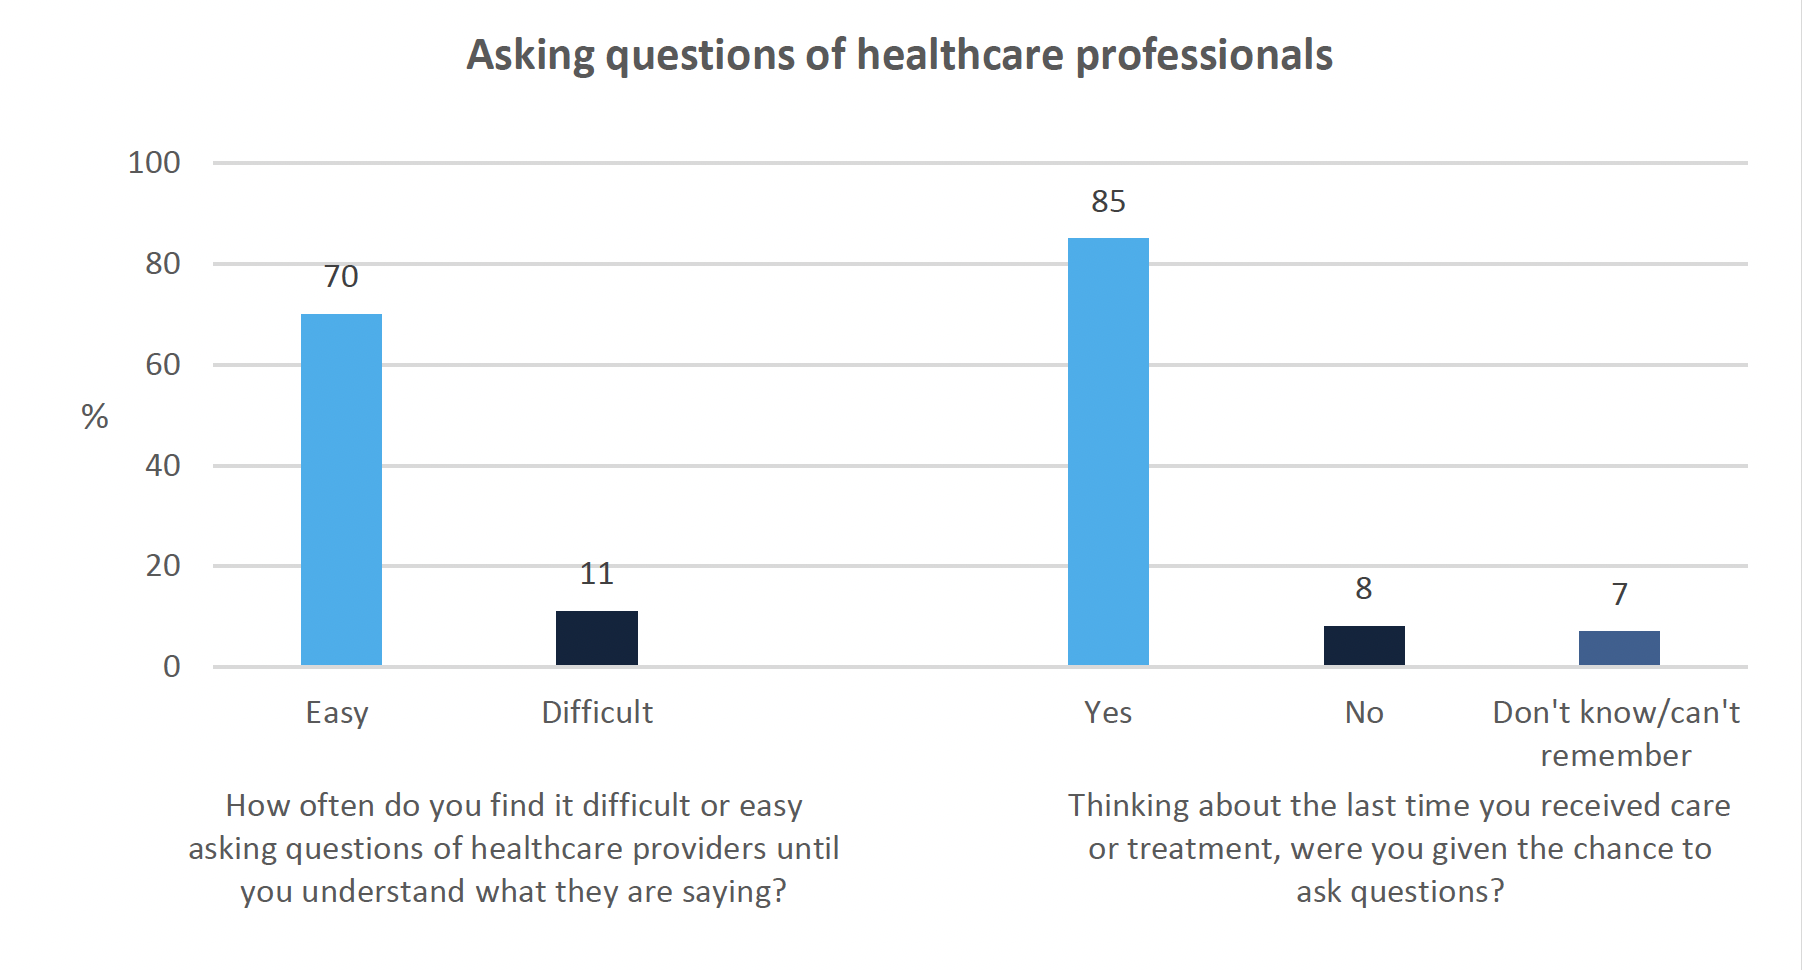
Figure 11 shows how respondents felt about asking questions of healthcare providers. 85% of people who had contacted primary care in the last 12 months (n=1040) reported being given the chance to ask questions about their care and treatment on their most recent visit. However, in general, only 70% of all respondents (n=1136) reported finding it easy to ask questions of healthcare providers until they understood the information they were being given. People living with a limiting long term illness reported finding this more difficult while those living in the least deprived SIMD decile reported finding this easier.
This suggests that respondents may not feel comfortable or able to ask questions, even when they are given the opportunity to do so. This result should be interpreted with caution however, as these questions have slightly different samples – one based on a specific experience and one generalising across experience – and are therefore not directly comparable.
High satisfaction overall
When asked how satisfied or dissatisfied they were with their most recent experience, generally good levels of satisfaction were reported, with 78% either very satisfied or satisfied with this experience. This is more positive than results from HACE, where 67% of respondents rated the overall care provided by their general practice as positive (note: slightly different wording of the question used). Respondents living in single adult households with children were less likely (56%) than the overall proportion to indicate that they were very satisfied/satisfied (note: small sample).
How: Access and Barriers
Availability of services may be limiting access for some
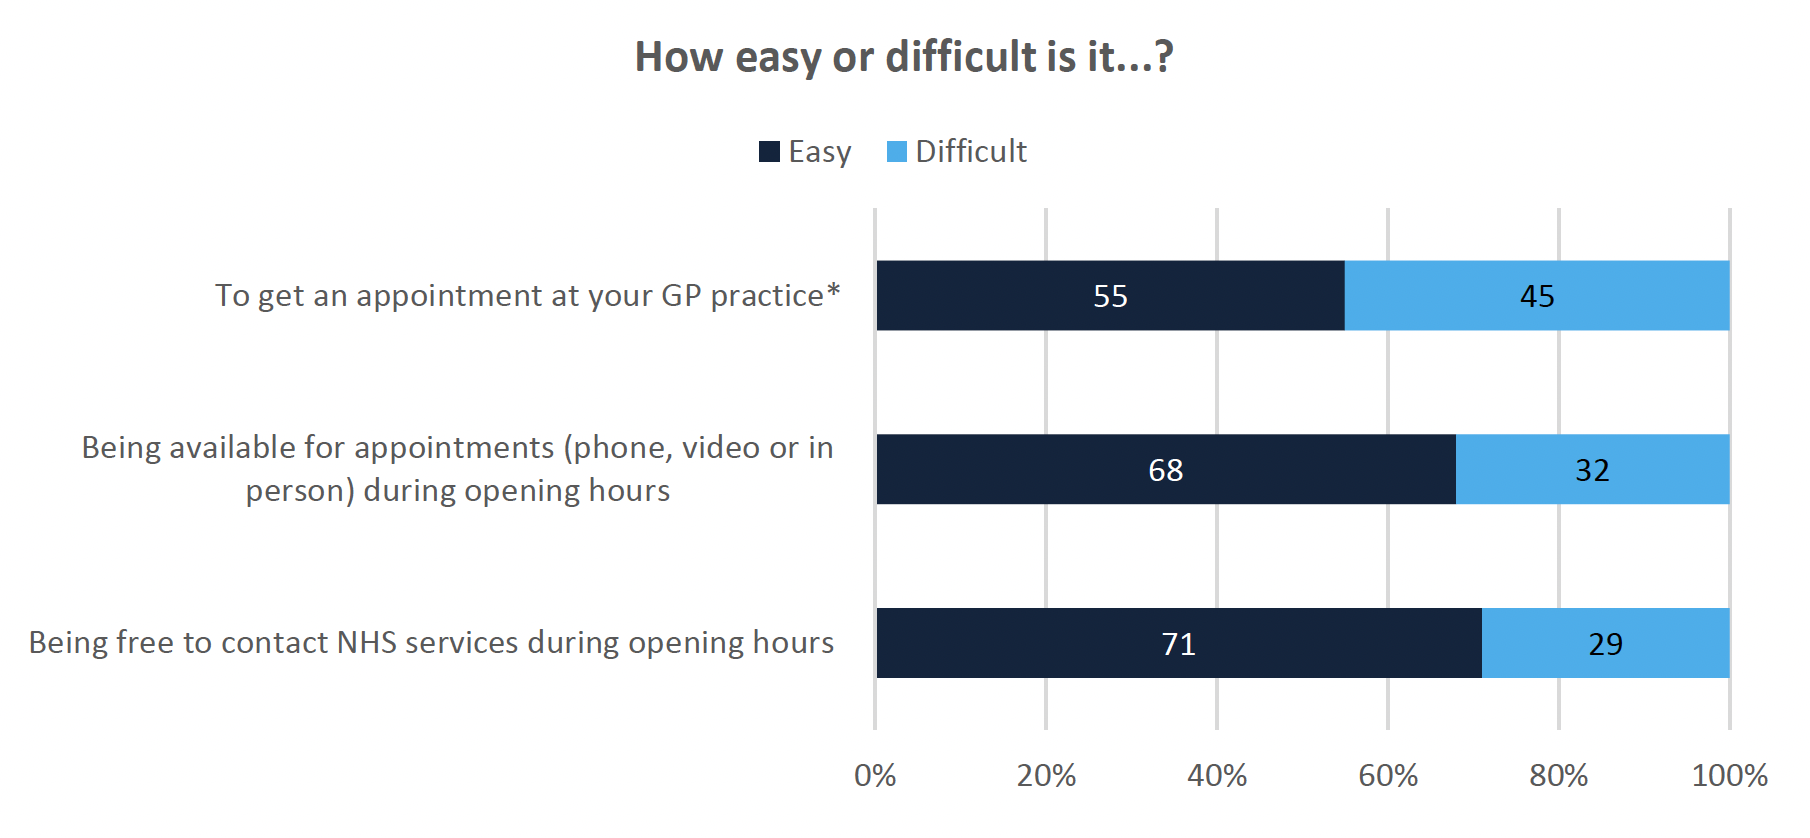
Nearly half of respondents (46%) reported that it was fairly or very difficult to get an appointment at their GP practice, suggesting that the availability of services was limiting access for some people (Figure 12). Around one third (29-32%) of respondents found it difficult to be available to contact or have an appointment with NHS services (by any mode of consultation) during regular opening hours.
A lower proportion of those aged 18-29 indicated that it was easy to contact a GP practice during regular opening hours (51%) compared with those aged 70 and over (85%). Those with a limiting (73%) or non-limiting long-term condition (81%) were more likely to report it being easy to be available for appointments.
Avoidance and anxiety prevent access for some
29% (n=224) of respondents reported that they had not contacted a GP practice in the last 12 months. Of those:
- The majority (70%) said it was because they hadn't needed to.
- 24% said they had accessed other services: this was primarily using online (10%), friends and family (7%), other services (not online, 4%) or private services (3%).
- However, other reasons for not contacting a practice included not wanting to burden the NHS (17%), general avoidance (14%) and anxiety (10%).
- No variations were found between groups, but this could be due to the small sample size for this question.
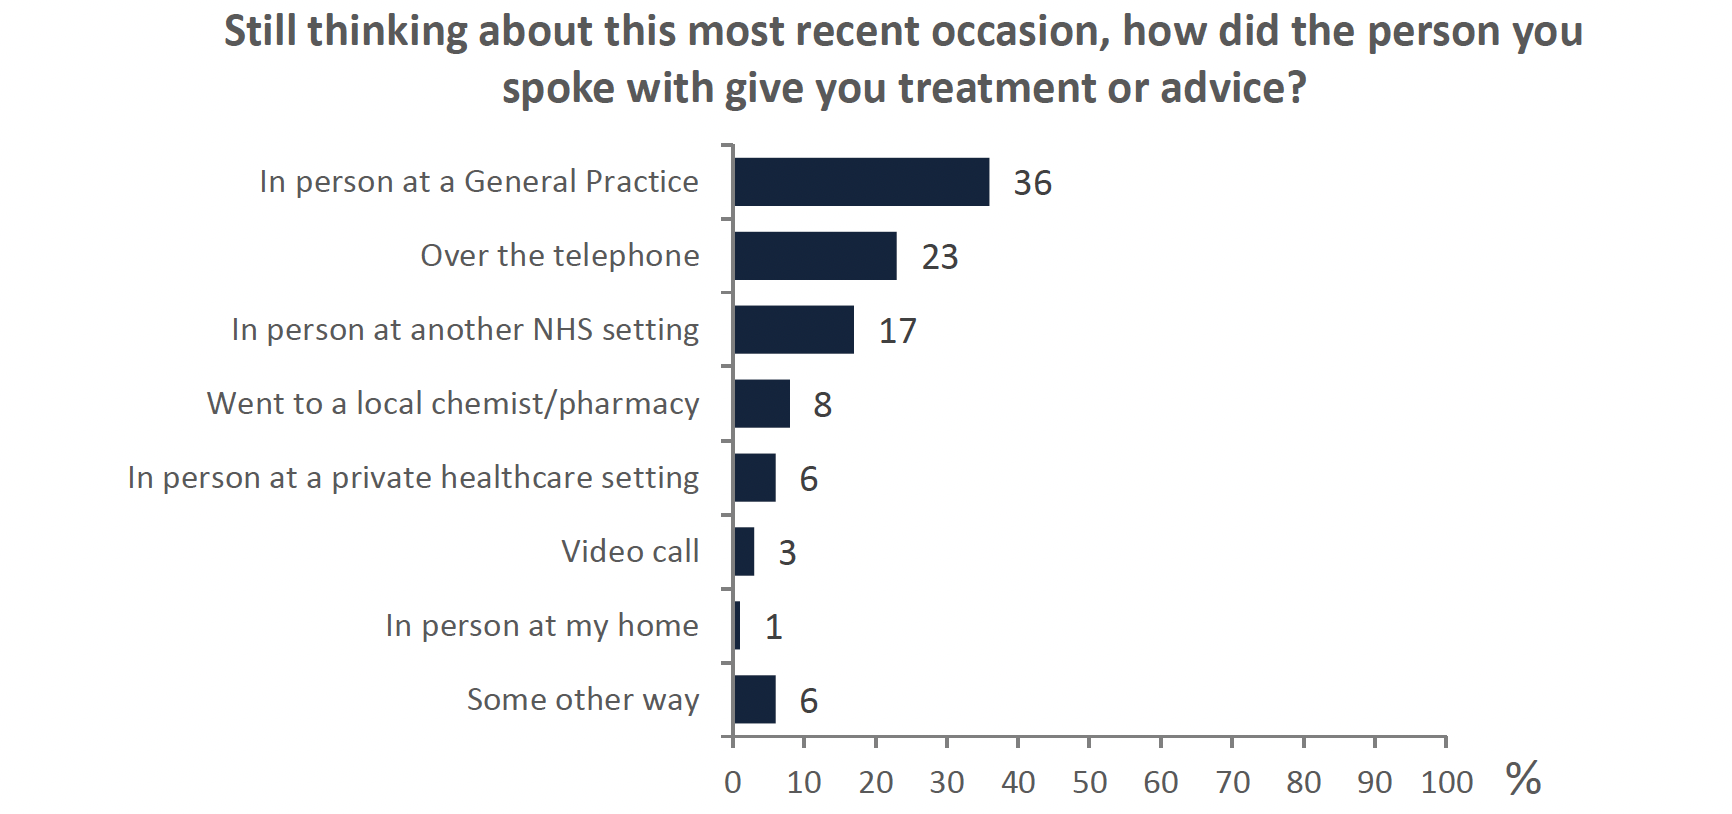
Some return to face-to-face consultation
Figure 13 shows the consultation mode of the most recent interaction respondents had. 68% of respondents reported having their most recent meeting face to face. This is higher than the number reported in HACE (37%), suggesting there have been more face to face appointments happening across primary care than in general practice. 23% of respondents received a consultation over the phone while only 3% (n=14) had an appointment using a video call.
Respondents with a limiting long-term illness were more likely than the overall total to report that their most recent mode of treatment/advice was by telephone (32%). This is in line with the preference for clinicians to use telephone appointments for ongoing conditions than new diagnoses[9]. The data was also indicative of a higher proportion of those in single adult households with children having received treatment or advice by phone, but this was a small sample.
Satisfaction higher for in-person consultations
Satisfaction was significantly higher for face to face consultations (84%) than over the phone (68%) or video appointments (64%). Satisfaction was lowest for video appointments, with around one third of respondents feeling very or quite dissatisfied with this mode of interaction. However, this should be interpreted with caution due to the very small sample size (n=14).
Dental costs clear but not necessarily reasonable
Whilst the majority of primary care services are free in Scotland, respondents were asked questions about dentistry and the related costs of treatment. The majority of participants felt they were given clear information about their treatment options and the costs involved (75%). 54% of respondents felt that the cost of treatment was reasonable whereas 16% felt it was unreasonable. 13% reported this was not applicable.
Contact
Email: socialresearch@gov.scot