Public attitudes to coronavirus: March update
This report presents findings from polling work, conducted in January and February 2021, on public attitudes to the coronavirus pandemic in Scotland.
3. Compliance
As well as tracking the impacts of Coronavirus on people's finances and health, the surveys have been used to capture people's attitudes to the Coronavirus response. This section presents data about public awareness of, and reaction to, Coronavirus guidance and restrictions.
Views on guidance
Respondents were provided with statements about government advice and guidance, and asked about the extent to which they agreed or disagreed with each. Figure 13 shows that the percentage of respondents who agreed that the best thing to do is to follow the government's advice, has remained high and stable through January and February. The proportion of respondents finding it hard to always stick to the government guidelines has increased through January and February, to around a quarter at the end of February.
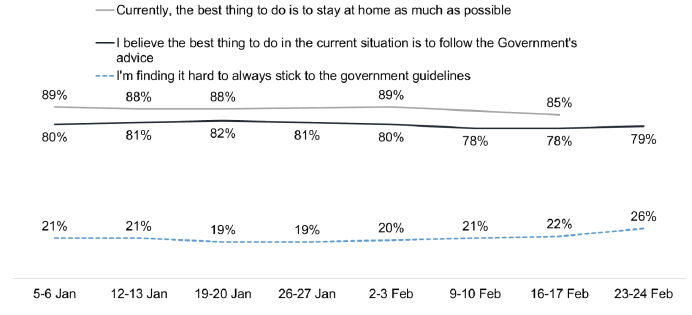
Source: YouGov weekly Scotland survey. Base (n=1000-1038)
Views on recent restrictions
The country went into a national lockdown on 5th January.[5] Under this guidance the public were asked to 'stay at home' and only leave their home for essential reasons such as to buy food, provide support to a vulnerable person or to exercise.
Respondents were asked to what extent they agreed with statements about these restrictions. In January, at first, a majority (81%) agreed that it was more important now than ever to stick to the rules. This remained stable for 3 weeks but then fell at the end of February to 75%. Those who 'strongly agreed' has decreased from 57% in January to 40% in February.
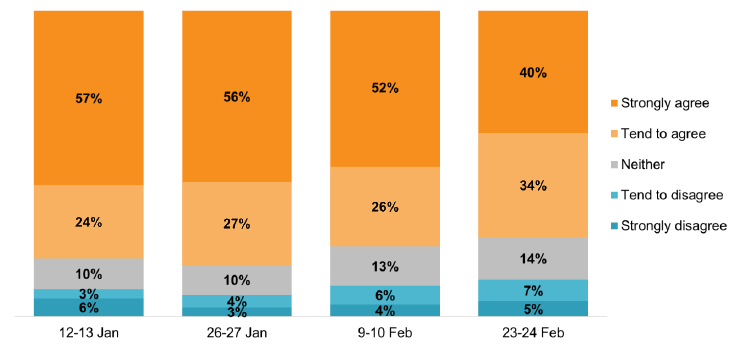
Source: YouGov weekly Scotland survey. Base (n=1000-1038)
Compliance with restrictions
Respondents were asked, thinking about all of the guidance[6] from the Scottish Government, on what to do and not do (including protection measures and distancing) to what extent did they feel they were following the regulations and guidance on a scale from 1 to 7, where 1 is 'not at all' and 7 is 'completely'. The proportion rating their compliance as 6 or 7 remained stable between 79-84% throughout January and February. 14-20% rated their compliance lower with a score between 1 and 5 in February, although the proportion was slightly lower in January.
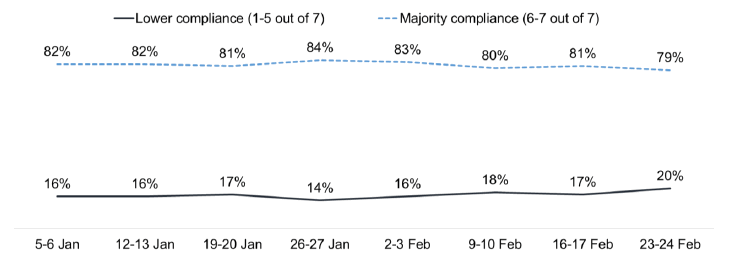
Source: YouGov weekly Scotland survey. Base (n=1000-1038)
As shown in Figure 16, 13% in January and in February 16%, agreed they had been adapting the guidance as they did not think everything was necessary. However, the majority of respondents indicated that they had not been adapting the guidance.
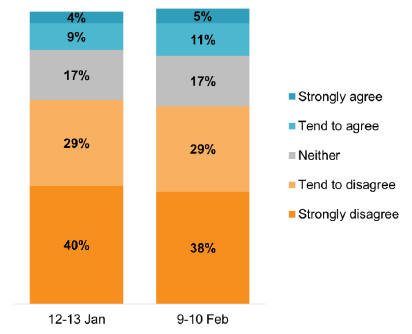
Source: YouGov weekly Scotland survey. Base (n=1029-1038)
Respondents were asked if they agreed (or not) with how important they felt different activities and interventions are for keeping Coronavirus under control. There was high agreement (between 88-96%) through January and February.
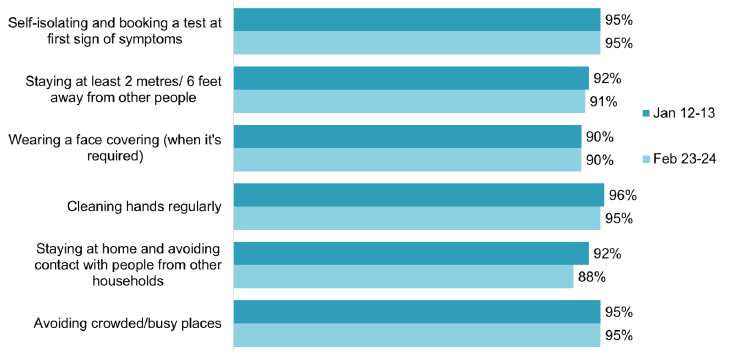
Source: YouGov weekly Scotland survey. Base (n=1000-1038)
Respondents were asked how well they thought they were doing various activities. The majority agreed they were doing each well, and there was little change over January and February. The activity that people were less likely to feel they were doing well was carrying and using hand sanitiser.
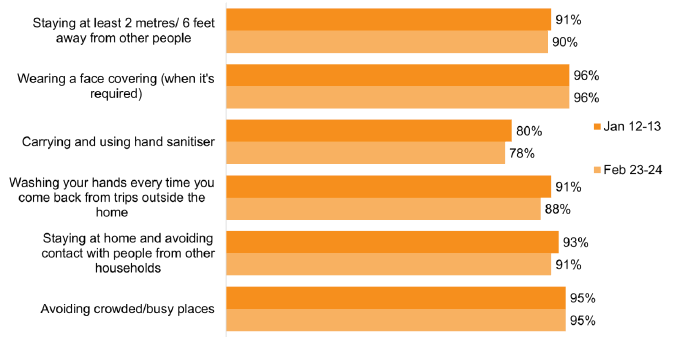
Source: YouGov weekly Scotland survey. Base (n=1000-1038)
Respondents were asked to what extent, if at all, they feel that they and others are wearing face coverings when required in shops, public transport and other indoor places. The majority stated ' completely' or 'mostly' for themselves and for their friends/family. A lower proportion (three quarters) felt that others were following this rule.
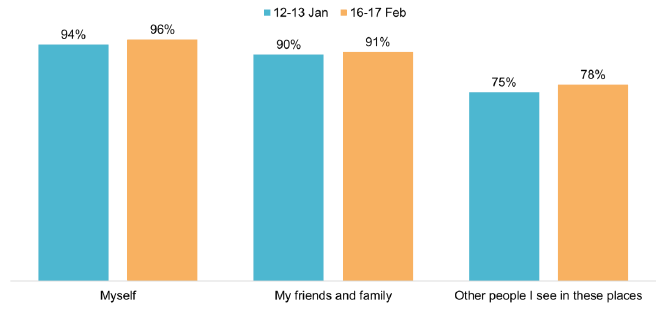
Source: YouGov weekly Scotland survey. Base (n=1007-1038)
Non-compliant activities
We asked respondents to indicate which activities from a list they had undertaken in the previous week. Separate questions covered indoor meetings, outdoor meetings, travel and transport. We then grouped together as 'non-compliant' anything in contravention of the 'stay at home' rules that were brought in at the start of January. The proportion of respondents admitting to any non-compliant activity has increased from 23% at the beginning of January to 33% at the end of February. As shown in Figure 20, of those admitting to a non-compliant activity, the most common activity was to meet others indoors, but non-compliant activity in all categories increased over the period.
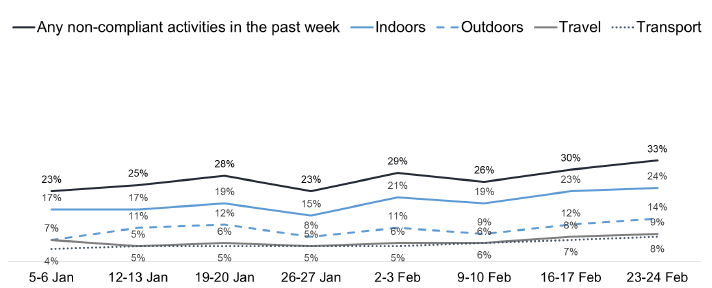
Source: YouGov weekly Scotland survey. Base (n=1029-1038)
Views on symptoms and Test and Protect
When asked at the beginning of February to think about the last three months, 14% had had some experience of Coronavirus in terms of at least one of those shown in Figure 21 - 5% had symptoms themselves or had tested positive; 4% said this applied to someone else in their household and 4% had been in close contact with someone who had symptoms or had tested positive.
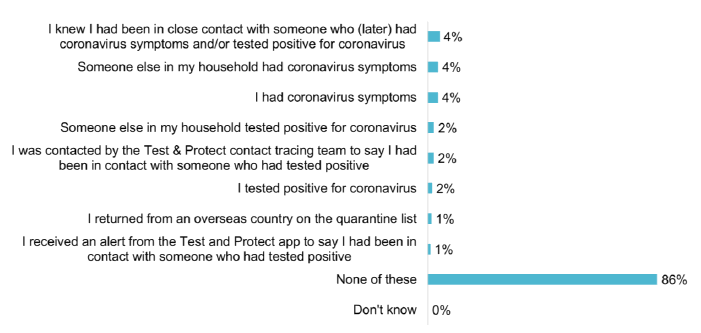
Source: YouGov weekly Scotland survey, 2-3 February. Base (n=999)
Of the small number (n=127) who said that they had some experience of, or possible contact with, Coronavirus in the last 3 months (i.e. since the beginning of November 2020), over half (55%) reported to self-isolating immediately, while a further 13% were self-isolating/shielding already. The remainder did not self-isolate or delayed the start of self-isolation.
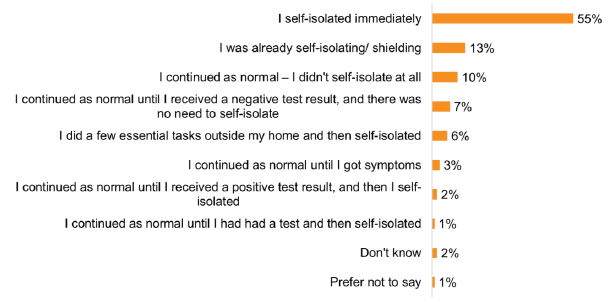
Source: YouGov weekly Scotland survey, 2-3 February. Base (n=127)
At the end of January respondents were asked if they knew what symptoms of Coronavirus to watch out for. Most were aware of being asked to look out for each of the three main symptoms.
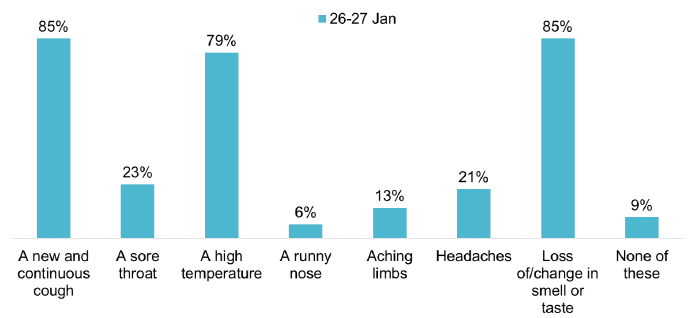
Source: YouGov weekly Scotland survey, 26-27 January. Base (n=1022)
When asked at the end of January how much they know about the Test and Protect programme, just under half (48%) stated they 'know a fair amount'. Only 2% said they had not heard of it.
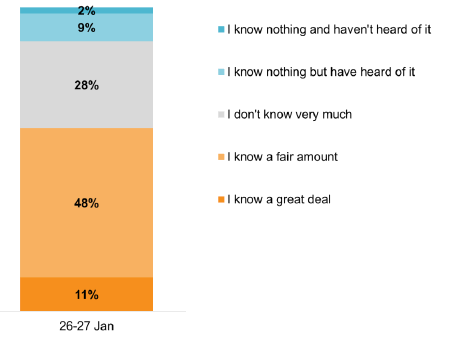
Source: YouGov weekly Scotland survey, 26-27 January. Base (n=1022)
Further questions about Test and Protect asked if people would be willing to provide details of those they had come into contact with or self-isolate if asked to do so. 87% agreed with each of these.
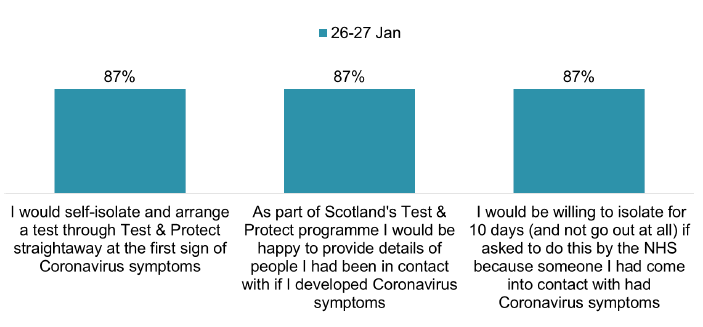
Source: YouGov weekly Scotland survey, 26-27 January. Base (n=1022)
Contact
Email: covid-19.behaviours@gov.scot