Private Sector Rent Statistics, Scotland, 2010 to 2022
This publication presents statistics on average private sector rent levels in Scotland by Broad Rental Market Area and size of property, for the years 2010 to 2022.
Part of
9. Broad Rental Market Area Profiles
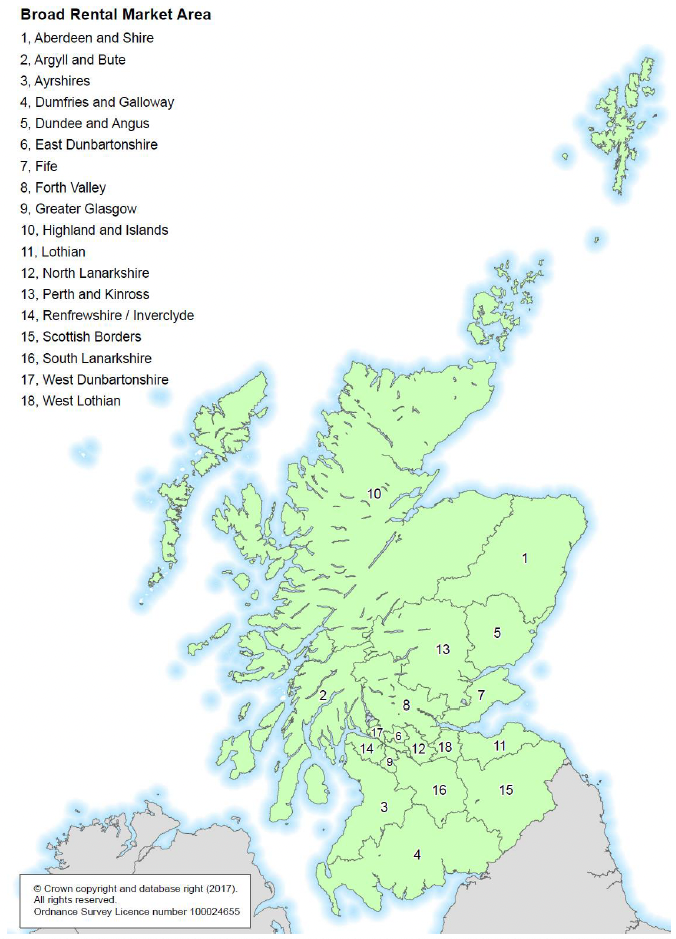
This section provides profiles for private rents in each of the 18 Broad Rental Market Areas[7].
The commentary focusses on annual changes and 12 year cumulative changes for average (mean) rents by property sizes, as well as changes over time to the bottom end (lower quartile) and top end (upper quartile) of the rental markets.
The commentary doesn't cover changes to median rents given that these often show similar trends to mean rents, however users may also wish to look at the median figures and trends in the Supporting Documents Excel Tables and Charts[8].
The map on the following page illustrates the different geographical areas covered by each Broad Rental Market Area. It is also possible to search for the Broad Rental Market Area associated with a particular postcode[9] including the provision of detailed PDF maps of each area.
Excel versions of each of the Broad Rental Market Area Profiles along with an online Interactive Excel Workbook, in which different rental measures, Broad Rental Market Areas and property sizes can be selected and compared in the same chart, are both available from Supporting Documents Excel workbooks.
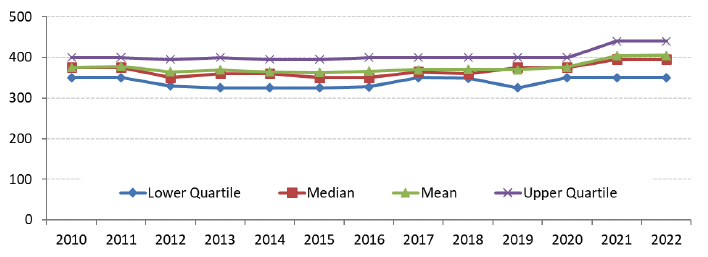
Broad Rental Market Area Profile – Aberdeen and Shire
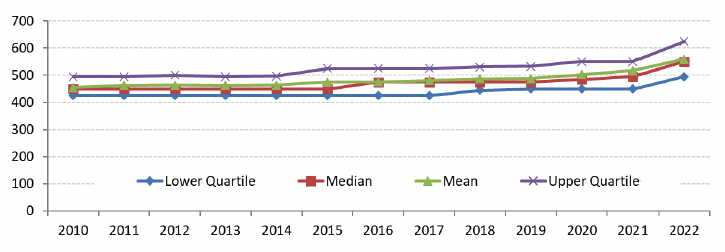
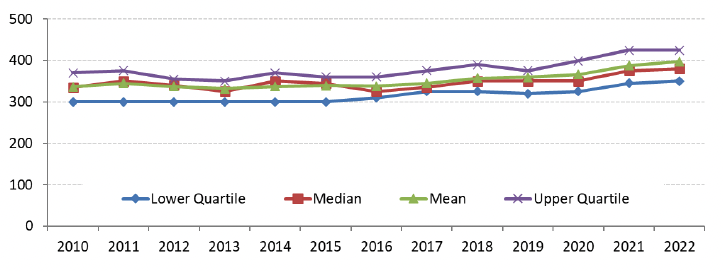
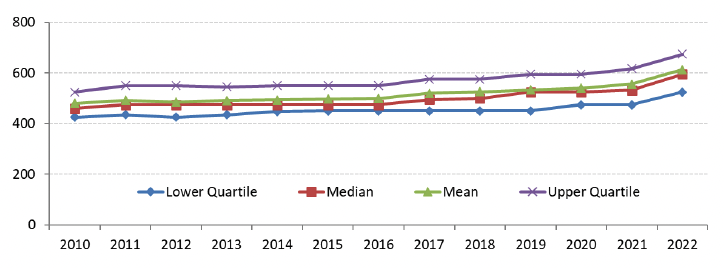
Note in the following text and charts that average rents that have changed within +/- 0.5% could be considered as being fairly similar to previous periods.
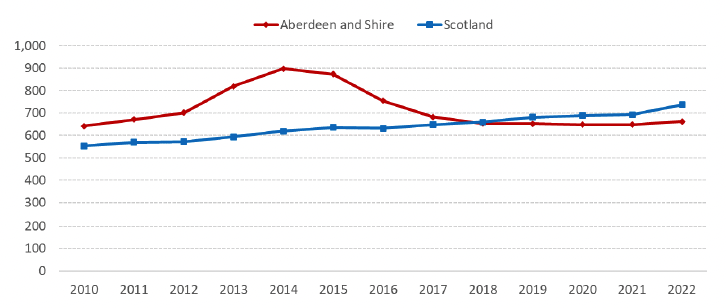
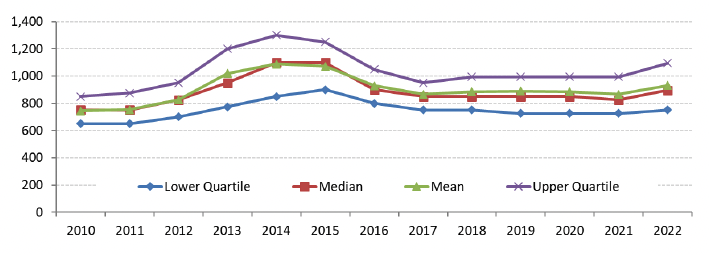
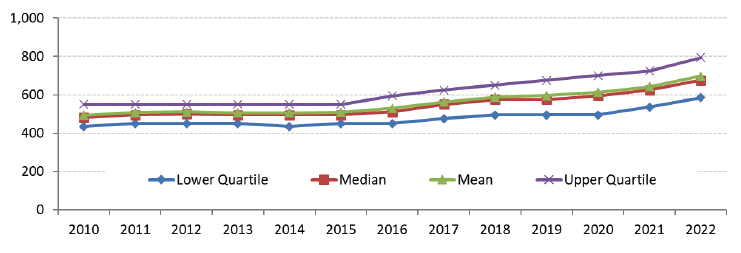
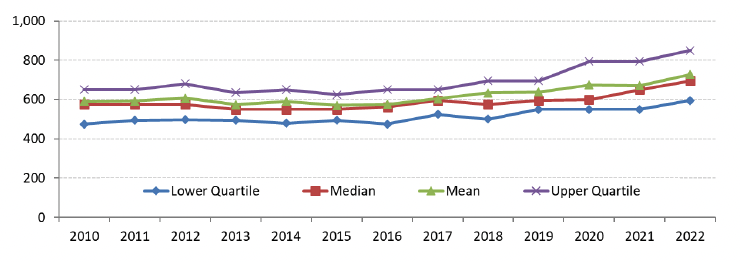
The average (mean) 2 bedroom rent in Aberdeen and Shire in 2022 was £663 per month, lower than the Scotland average of £736, and which is a reflection of rents in Aberdeen and Shire falling since 2014 due to the downturn in the oil industry, and remaining relatively stable from 2018 onwards while the Scotland average has increased each year over this time period.
Average rents in Aberdeen and Shire in the latest year compared to the previous year have increased for 1 bedroom (3.0%), 2 bedroom (2.1%), 3 bedroom (7.4%), and 4 bedroom (3.9%) properties, and have showed little change for 1 bedroom shared properties (0.1%), which compares to CPI inflation of 7.6% across this time period.
This follows decreases between 2015 and 2017 in average rents across all property size categories, likely to be due to decreased demand for rental properties following the downturn in the oil industry. Average rents in 2022 are still higher than in 2010 except for 1 bedroom properties, for which rents are now 11.3% lower than in 2010. For 4 bedroom properties, rents in 2022 are 45.3% higher than in 2010, which is higher than CPI inflation (33.7%) over this period.
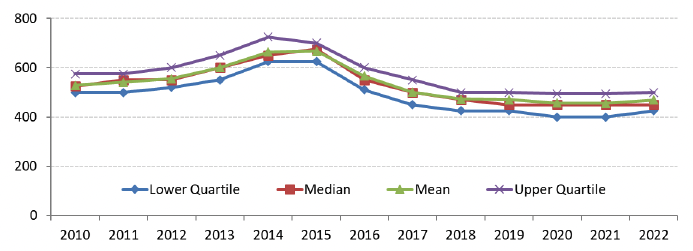
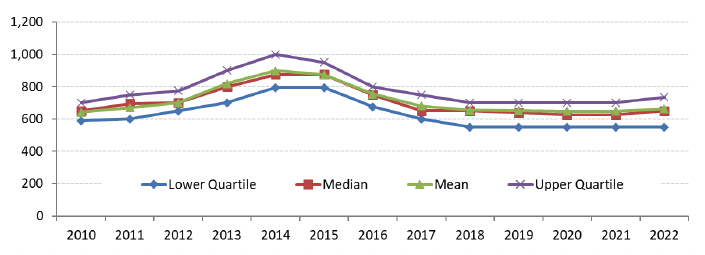
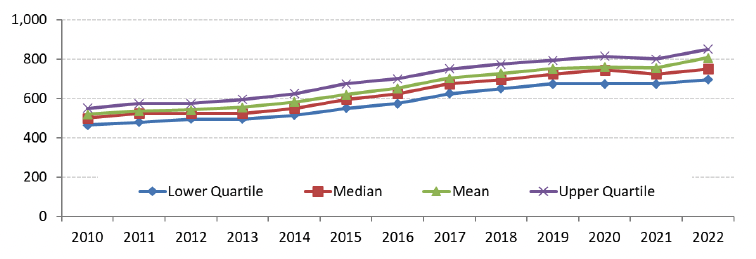
For 3 and 4 bedroom properties, greater increases at the top end (upper quartile) than the bottom end (lower quartile) between 2012 and 2014 caused the gap between the top and bottom ends to widen. This gap since narrowed, although it slightly increased again in the latest year for 2 and 3 bedroom properties.
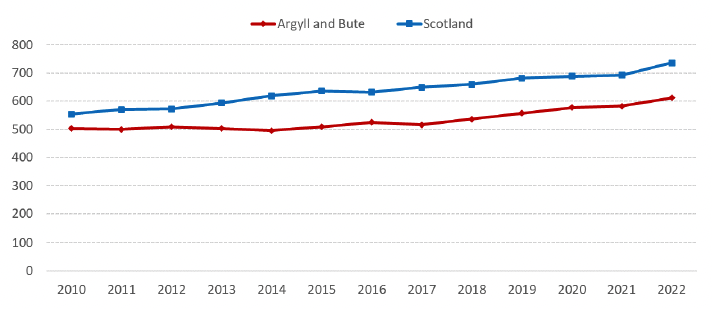
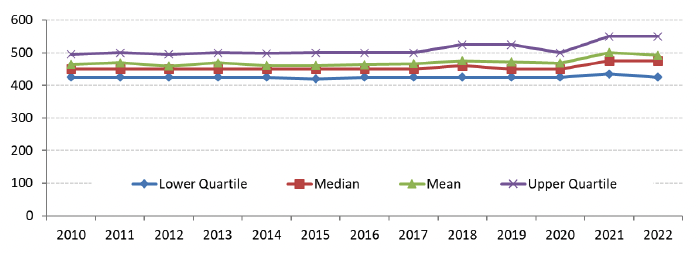
Broad Rental Market Area Profile – Argyll and Bute
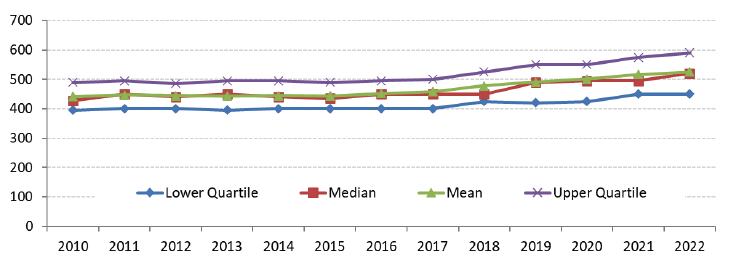
Note in the following text and charts that average rents that have changed within +/- 0.5% could be considered as being fairly similar to previous periods.
Average (mean) 2 bedroom rents in Argyll and Bute have been lower than the Scotland average in each year since 2010. The gap has grown since 2010, with the average rent in 2022 being £612 per month, compared to the Scotland average of £736.
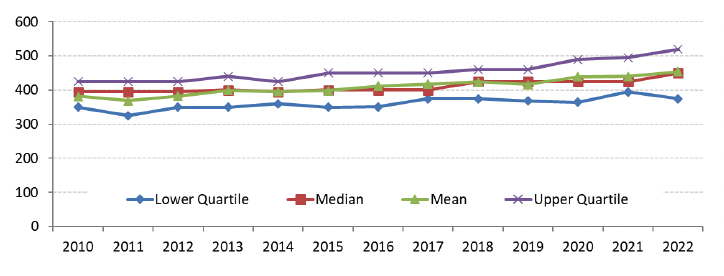
Between 2021 and 2022, average rents have increased across all property sizes, with increases for 1 bedroom (3.2%), 2 bedroom (5.0%), 3 bedroom (26.5%), 4 bedroom (27.7%) and 1 bedroom shared properties (2.2%), which compares to CPI inflation of 7.6% across this time period.
Note that some caution is needed when interpreting the changes over time for 3 bedroom, 4 bedroom and 1 bedroom shared properties given the smaller sample numbers for these categories, which can lead to greater volatility in the results presented, particularly for year on year trends.
Between 2010 and 2022, average rents have increased below the rate of CPI inflation of 33.7% for 1 bedroom (18.8%), 2 bedroom (21.6%), 3 bedroom (30.9%) and 1 bedroom shared properties (23.4%), whilst the average rent for 4 bedroom properties (46.9%) has increased above inflation.
3, 4 and 1 bedroom shared properties have each seen some variation each year since 2010 in the gap between the higher end (upper quartile) and lower end (lower quartile) of the market, although some of this is likely to be due to the smaller sample numbers for these categories.
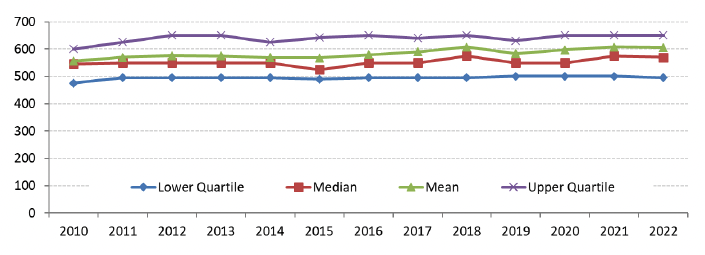
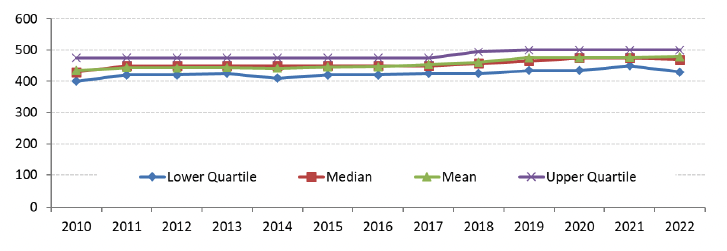
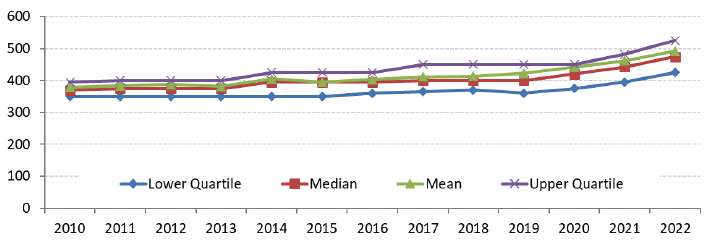
Broad Rental Market Area Profile – Ayrshires
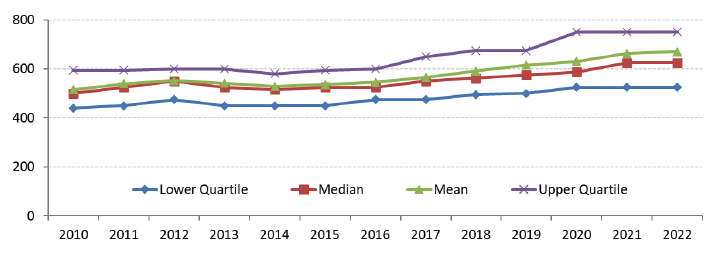
Note in the following text and charts that average rents that have changed within +/- 0.5% could be considered as being fairly similar to previous periods.
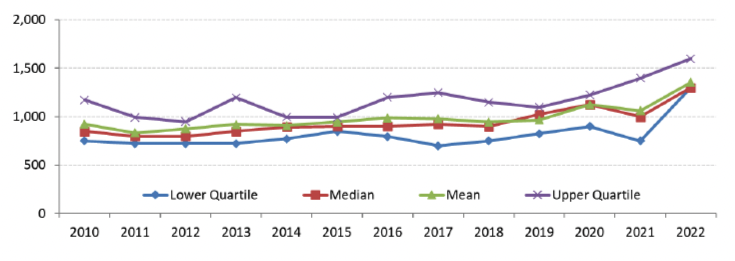
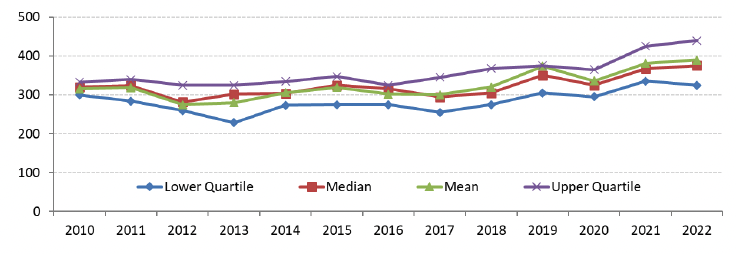
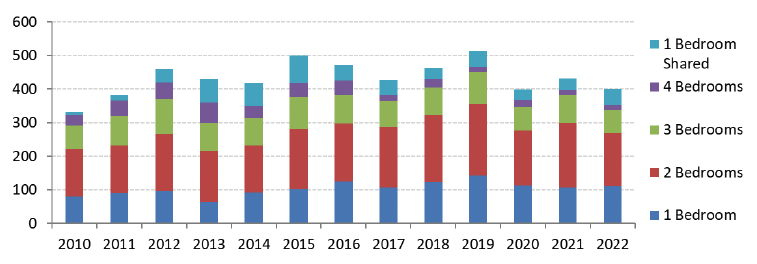
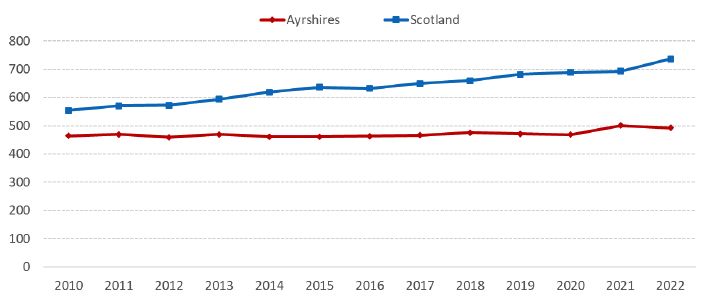
Average (mean) 2 bedroom rents in the Ayrshires have been lower than the Scotland average in each year since 2010, with the gap generally growing over the years, with the average rent in 2022 being £493 per month, compared to the Scotland average of £736.
Between 2021 and 2022 average rents have increased for 1 bedroom shared properties (4.2%), have shown little change for 1 bedroom (0.2%) and 3 bedroom (-0.3%) properties, and have decreased for 2 bedroom (-1.5%) and 4 bedroom (-9.1%) properties, which compraes to CPI inflation of 7.6% across this time period.
Between 2010 and 2022, average rents have increased well below the rate of CPI inflation of 33.7% for 1 bedroom (7.8%), 2 bedroom (6.1%), 3 bedroom (8.9%) and 4 bedroom properties (19.2%), whilst the average rent for 1 bedroom shared properties (32.4%) has increased just below the rate of inflation.
For 1 bedroom shared properties, a greater increase at the top end (upper quartile) than the bottom end (lower quartile) has caused the gap between the top end and bottom ends to widen in recent years, with 1 and 2 bedroom properties also seeing a slight widening in the gap over the latest two years.
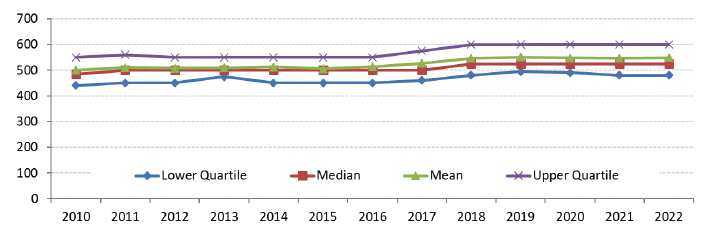
Broad Rental Market Area Profile – Dumfries and Galloway
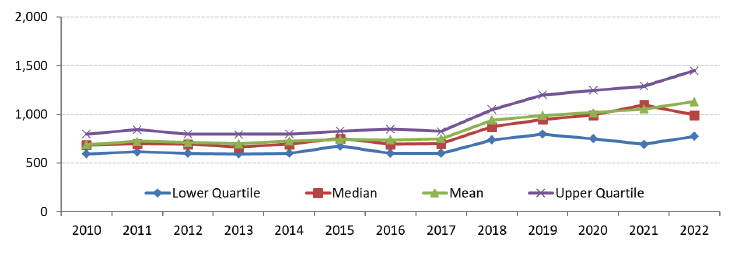
Note in the following text and charts that average rents that have changed within +/- 0.5% could be considered as being fairly similar to previous periods.
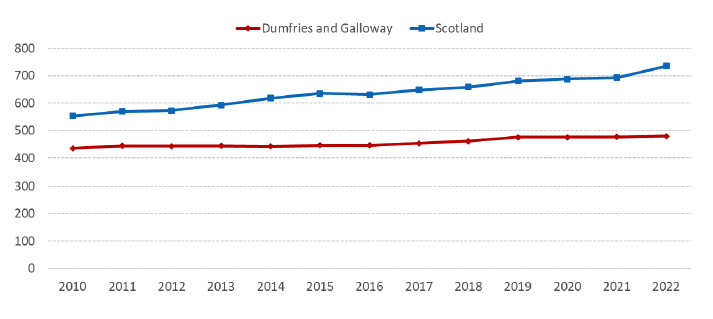
Average (mean) 2 bedroom rents in Dumfries and Galloway have been lower than the Scotland average in each year since 2010, and the gap has grown over the years, with the average rent in 2021 being £480 per month, compared to the Scotland average of £736.
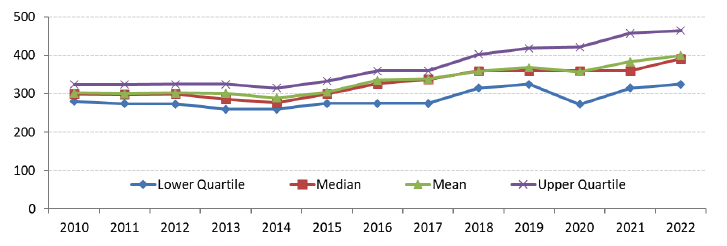
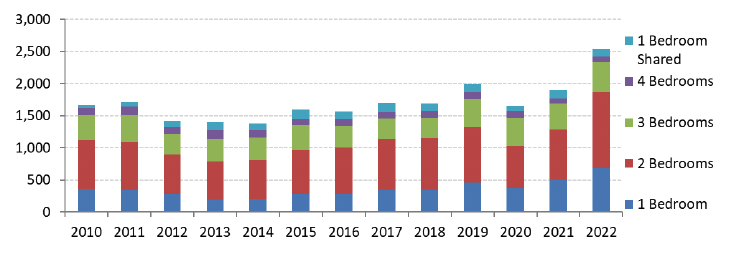
Between 2021 and 2022 average rents have increased for 2 bedroom (0.6%), 4 bedroom (4.4%) and 1 bedroom shared properties (0.6%), the average rent for 3 bedroom properties (0.3%) has shown little change, and the average rent for 1 bedroom properties has decreased by 1.8%, which compares to CPI inflation of 7.6% across this time period.
Between 2010 and 2022, average rents have increased well below the rate of CPI inflation of 33.7% for 1 bedroom (11.0%), 2 bedroom (10.2%), 3 bedroom (9.8%), and 1 bedroom shared properties (20.3%), whilst the average rent for 4 bedroom properties (33.0%) has increased just below the rate of inflation.
Over the latest two years, 4 bedroom properties have seen rents at the upper end (upper quartile) increase, slightly widening the gap between the lower end and the upper end, although some of this change may be due to the smaller sample size for this property category.
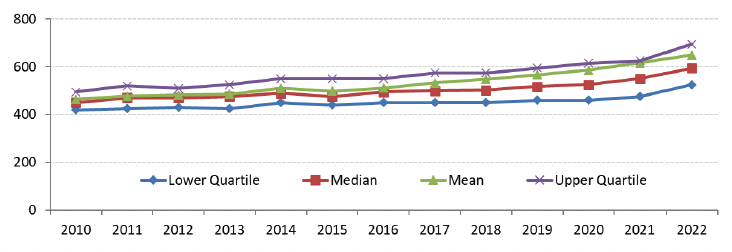
Broad Rental Market Area Profile – Dundee and Angus
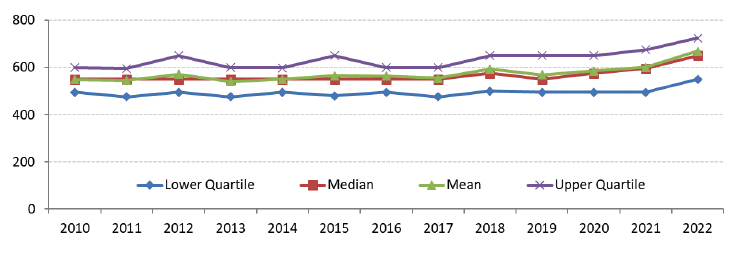
Note in the following text and charts that average rents that have changed within +/- 0.5% could be considered as being fairly similar to previous periods.
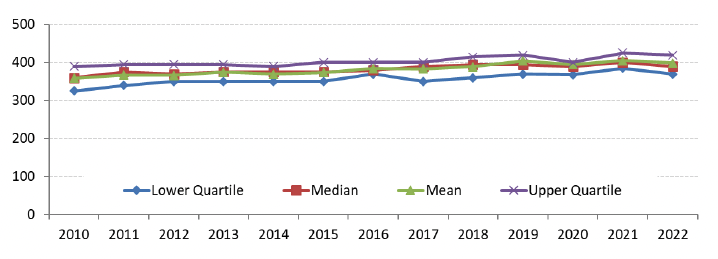
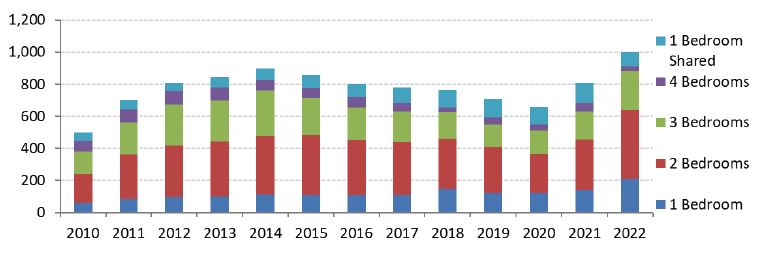
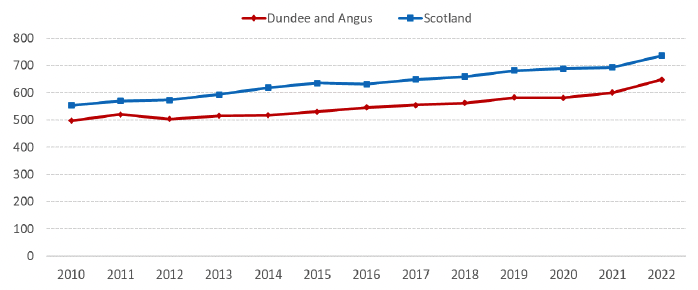
Average (mean) 2 bedroom rents in Dundee and Angus have been lower than the Scotland average in each year since 2010, although the difference has narrowed slightly in the last couple of years, with the average rent in 2022 being £648 per month, compared to the Scotland average of £736.
Between 2021 and 2022, average rents have increased across all property sizes, with increases for 1 bedroom (5.8%), 2 bedroom (8.0%), 3 bedroom (9.3%), 4 bedroom (7.6%), and 1 bedroom shared properties (9.0%), which compares to CPI inflation of 7.6% across this time period.
Between 2010 and 2022, average rents have increased below the rate of CPI inflation of 33.7% for 1 bedroom (25.0%) and 2 bedroom (30.3%) properties, whilst the average rent for 3 bedroom (39.8%) and 1 bedroom shared properties (36.6%) has increased above inflation, and the average rent for 4 bedroom properties (62.4%) has increased well above the rate of inflation.
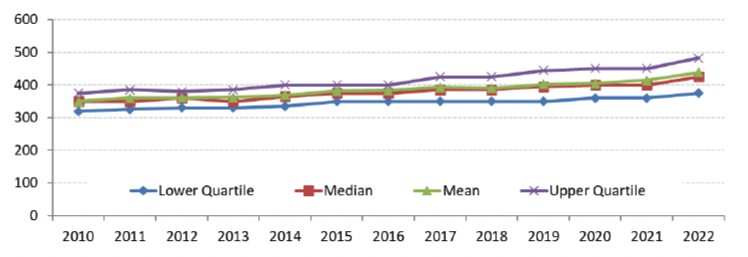
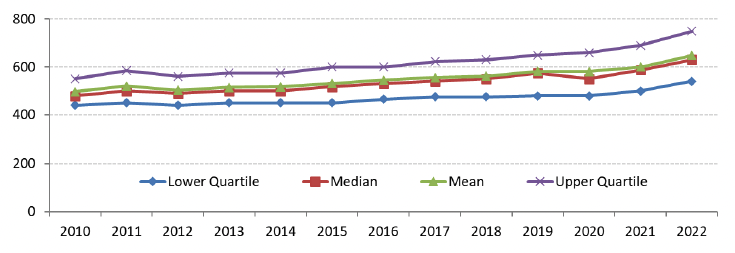
For all 1 to 4 bedroom properties, increases between 2010 and 2022 have been greater at the top end (upper quartile) than the bottom end (lower quartile), causing the gap between top and bottom ends of the market to widen.
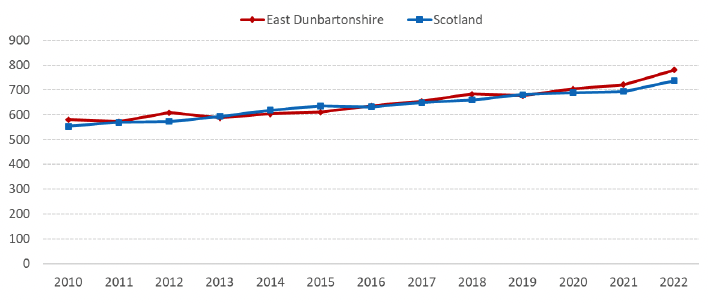
Broad Rental Market Area Profile – East Dunbartonshire
Note in the following text and charts that average rents that have changed within +/- 0.5% could be considered as being fairly similar to previous periods.
Average (mean) 2 bedroom rents in East Dunbartonshire have been broadly similar to the Scotland average in each year since 2010, with the average rent in 2022 being £780 per month, compared to the Scotland average of £736.
Between 2021 and 2022 average rents have increased for 1 bedroom (8.6%), 2 bedroom (8.2%) and 3 bedroom (11.9%) properties, but have decreased for 4 bedroom (-0.8%) and 1 bedroom shared properties (-3.7%), which compares to CPI inflation of 7.6% across this time period.
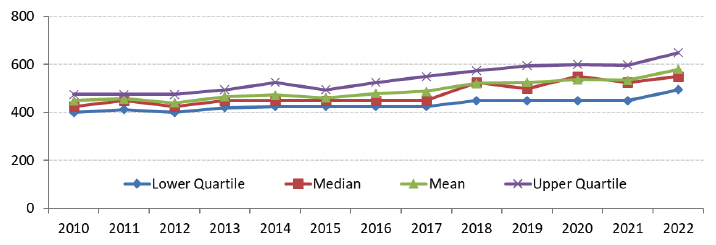
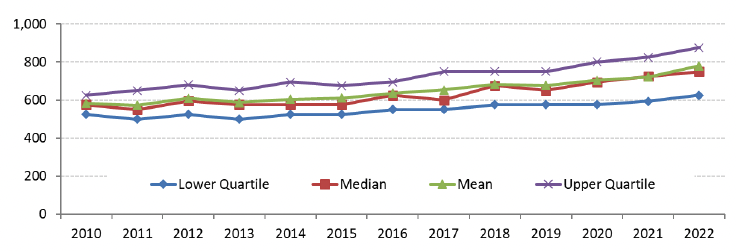
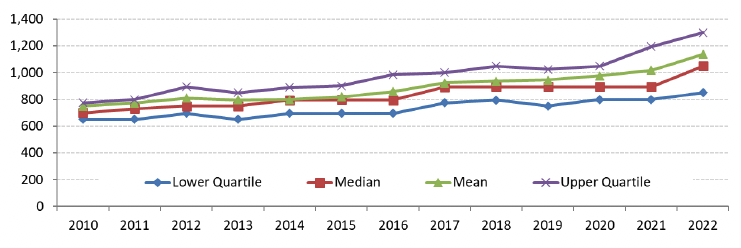
Note that some caution is needed when interpreting the changes over time for all property size categories except 2 bedroom properties, given the smaller sample numbers for most categories, which can lead to greater volatility in the results presented, particularly for year on year trends.
Between 2010 and 2022, average rents have increased slightly below the rate of CPI inflation of 33.7% for 1 bedroom properties (29.1%), slightly above the rate of inflation for 2 bedroom (34.2%) properties, and have increased higher than the rate of inflation for 3 bedroom (51.7%), 4 bedroom (44.2%) and and 1 bedroom shared properties (39.8%).
For 1 bedroom, 2 bedroom, 3 bedroom and 1 bedroom shared properties, rents between 2010 and 2022 have increased more at the top end (upper quartile) that at the bottom end (lower quartile) of the market, causing a slight widening of the gap between the top and bottom end of the market.
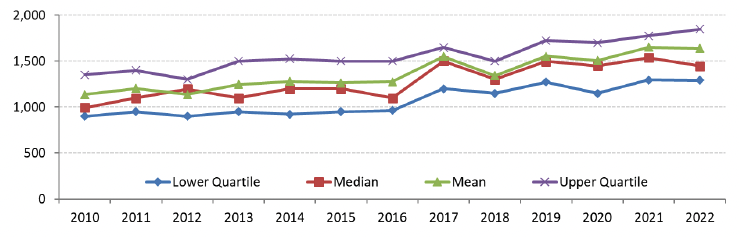
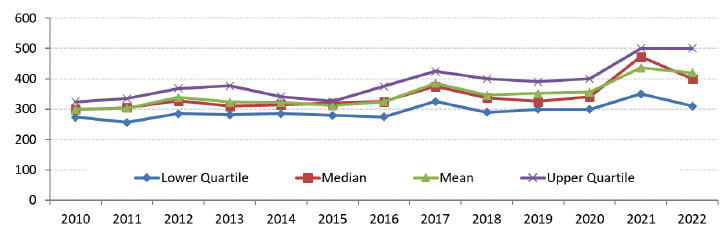
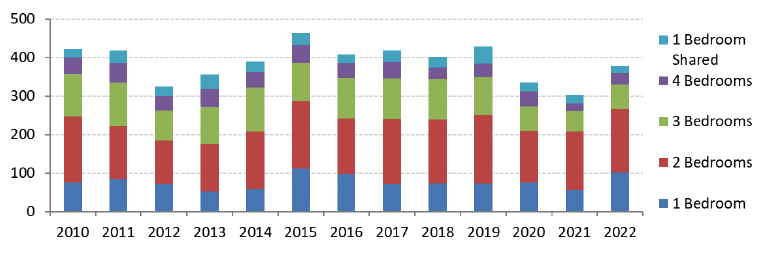
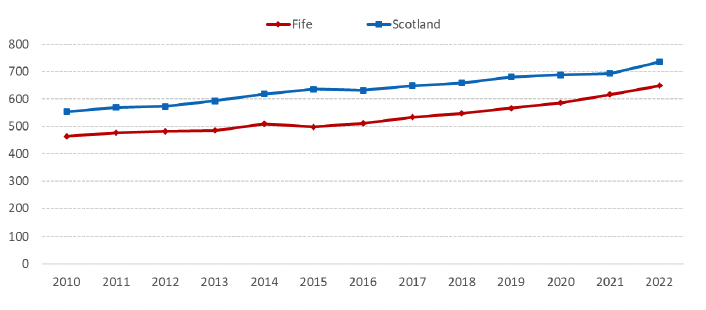
Broad Rental Market Area Profile – Fife
Note in the following text and charts that average rents that have changed within +/- 0.5% could be considered as being fairly similar to previous periods.
Average (mean) 2 bedroom rents in Fife have been lower than the Scotland average in each year since 2010, although the gap has generally narrowed over the latest three years, with the average rent in 2022 being £649 per month, compared to the Scotland average of £736.
Between 2021 and 2022, average rents have increased across all property sizes, with increases for 1 bedroom (6.4%), 2 bedroom (5.3%), 3 bedroom (7.8%), 4 bedroom (1.1%) and 1 bedroom shared properties (8.5%), which compares to CPI inflation of 7.6% across this time period.
Between 2010 and 2022, average rents have increased slightly below the rate of CPI inflation of 33.7% for 1 bedroom properties (29.8%), have increased above the rate of inflation for 2 bedroom (39.9%), 3 bedroom (49.0%) and 1 bedroom shared properties (44.9%), and have increased well above the rate of inflation for 4 bedroom properties (73.9%).
Between 2019 and 2021, 4 bedroom properties saw increases in the top end (upper quartile) of rents compared with the bottom end (lower quartile) which widened the gap in rents between the top and bottom ends of the market, although this gap has narrowed in the latest year to 2022.
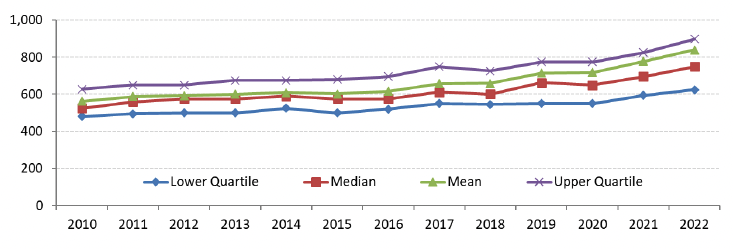
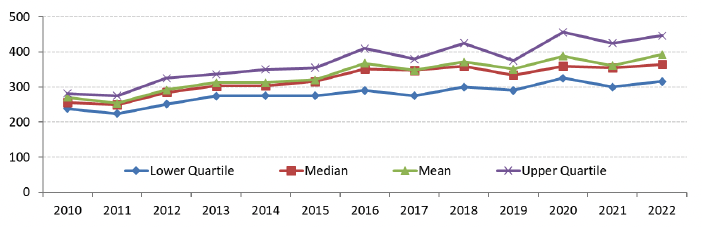
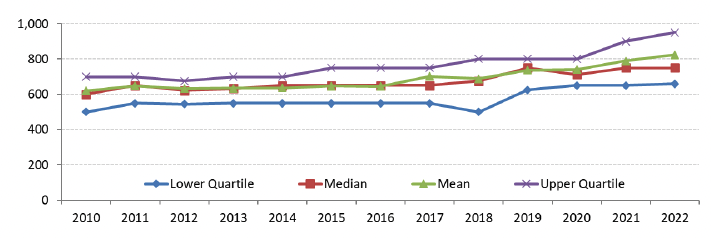
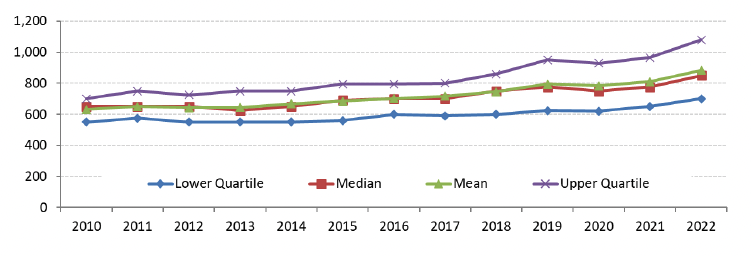
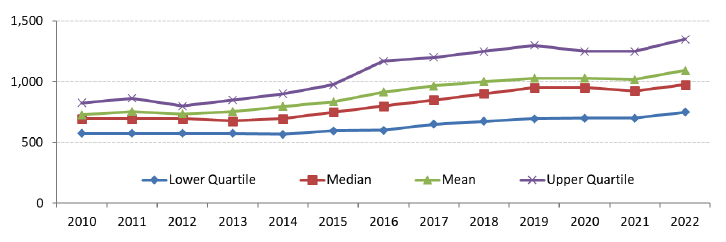
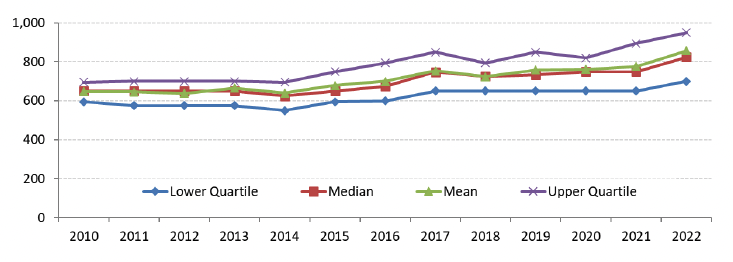
Broad Rental Market Area Profile – Forth Valley
Note in the following text and charts that average rents that have changed within +/- 0.5% could be considered as being fairly similar to previous periods.
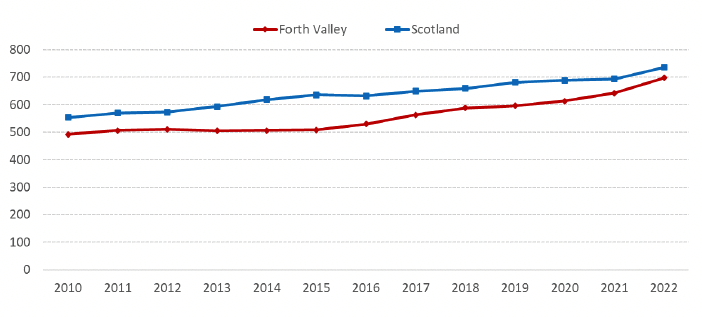
Average 2 (mean) bedroom rents in Forth Valley have been lower than the Scotland average in each year since 2010, with the average rent in 2021 being £697 per month, compared to the Scotland average of £736. The gap grew between 2012 and 2015, but has since narrowed, particularly over the latest two years.
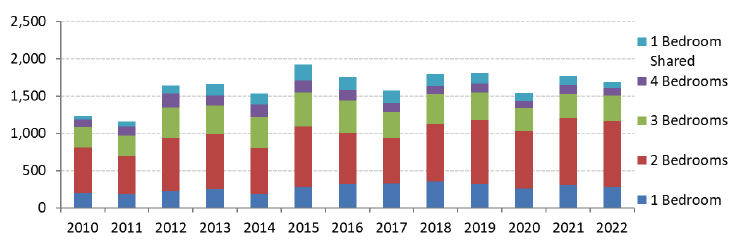
Between 2021 and 2022, average rents have increased across all property sizes, with increases for 1 bedroom (9.2%), 2 bedroom (8.7%), 3 bedroom (8.9%), 4 bedroom (19.9%), and 1 bedroom shared properties (19.6%), which compares to CPI inflation of 7.6% across this time period.
Note that some caution is needed when interpreting the changes over time for 4 bedroom and 1 bedroom shared property size categories, given the smaller sample numbers for these categories, which can lead to greater volatility in the results presented, particularly for year on year trends.
Between 2010 and 2022, average rents have increased slightly below the rate of CPI inflation of 33.7% for 1 bedroom properties (32.0%), have increased above the rate of inflation for 2 bedroom (41.6%), 3 bedroom (52.3%) and 1 bedroom shared properties (54.9%), and have increased well above the rate of inflation for 4 bedroom properties (71.4%).
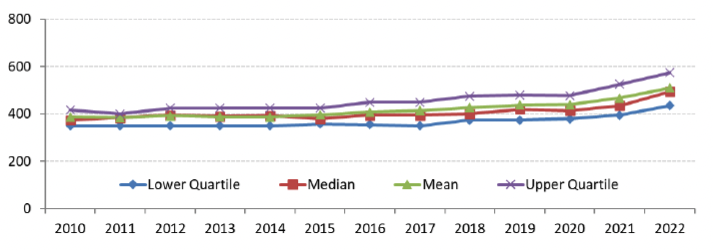
Across 2 bedroom, 3 bedroom and 4 bedroom properties, since 2010 there have generally been greater increases in the top end rents (upper quartile) than the bottom end (lower quartile), resulting in the gap between top and bottom ends of the market widening.
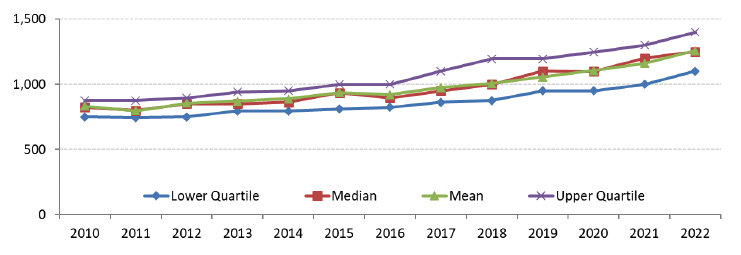
Profile Chart A – average 2 bedroom rents compared to the Scotland average: Forth Valley
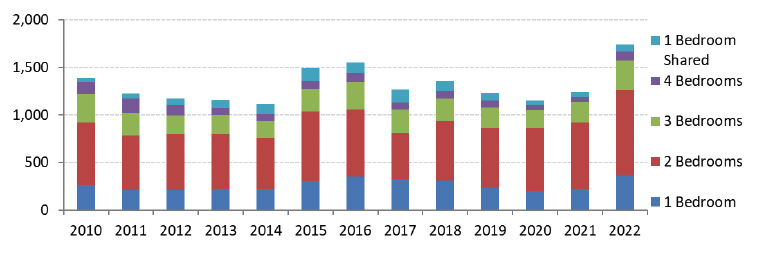
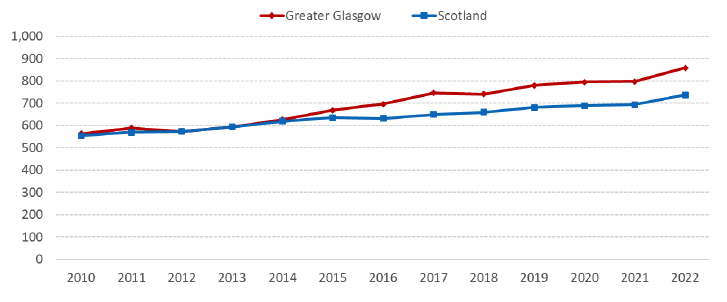
Broad Rental Market Area Profile – Greater Glasgow
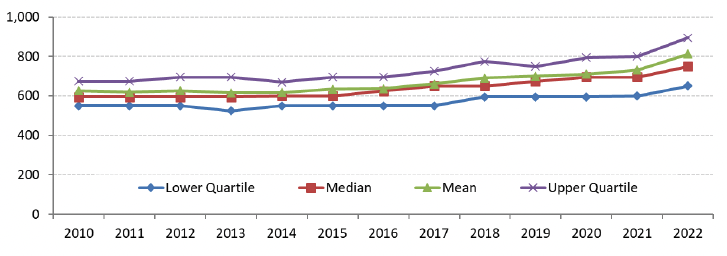
Note in the following text and charts that average rents that have changed within +/- 0.5% could be considered as being fairly similar to previous periods.
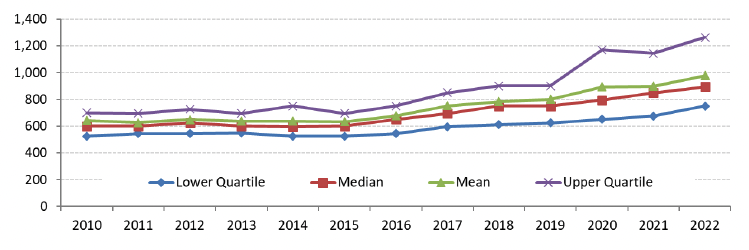
Average (mean) 2 bedroom rents in Greater Glasgow have been higher than the Scotland average since 2014, with the gap generally increasing over the past 8 years. The average rent in 2022 was £858 per month, compared to the Scotland average of £736.
Between 2021 and 2022, average rents have increased across all property sizes, with increases for 1 bedroom (7.2%), 2 bedroom (7.7%), 3 bedroom (7.6%), 4 bedroom (5.7%) and 1 bedroom shared properties (8.3%), which compares to CPI inflation of 7.6% across this time period.
Between 2010 and 2022, average rents have increased above the rate of CPI inflation of 33.7% for 1 bedroom (48.3%), 2 bedroom (52.3%), 3 bedroom (50.1%) and 1 bedroom shared properties (36.8%), and have increased well above the rate of inflation for 4 bedroom properties (66.2%).
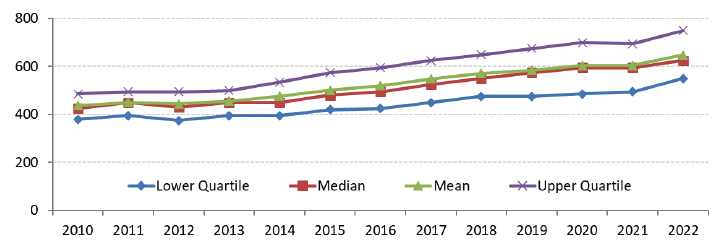
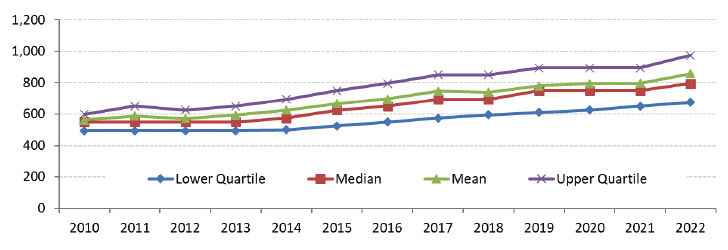
For most property sizes there have generally been greater increases in the top end (upper quartile) of rents between 2010 and 2022, which has widened the gap in rents compared to the bottom end of the market (lower quartile).
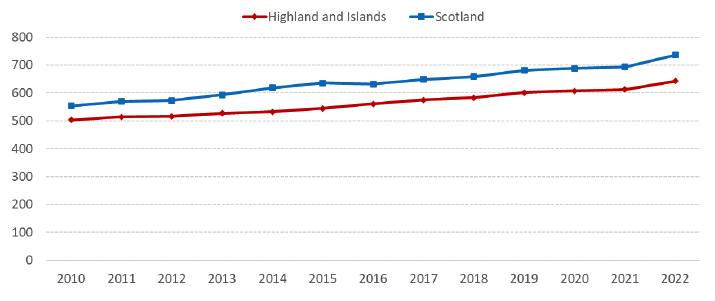
Broad Rental Market Area Profile – Highland and Islands
Note in the following text and charts that average rents that have changed within +/- 0.5% could be considered as being fairly similar to previous periods.
Average (mean) 2 bedroom rents in Highland and Islands have been lower than the Scotland average in each year since 2010, with the average rent in 2022 being £643 per month, compared to the Scotland average of £736.
Between 2021 and 2022, average rents have increased across all property sizes, with increases for 1 bedroom (6.1%), 2 bedroom (4.9%), 3 bedroom (4.5%), 4 bedroom (7.9%) and 1 bedroom shared properties (9.1%), which compares to CPI inflation of 7.6% across this time period.
Note that some caution is needed when interpreting the changes over time for the 4 bedroom property size category, given the smaller sample numbers for this category, which can lead to greater volatility in the results presented, particularly for year on year trends.
Between 2010 and 2022, average rents have increased below the rate of CPI inflation of 33.7% for 1 bedroom (26.3%), 2 bedroom (27.6%) and 3 bedroom (29.5%) properties, and have increased above the rate of inflation for 4 bedroom (35.2%) and 1 bedroom shared properties (45.0%).
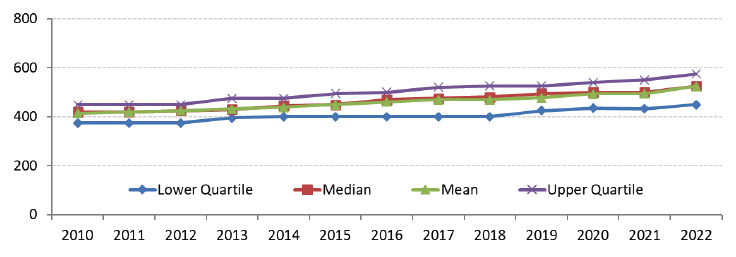
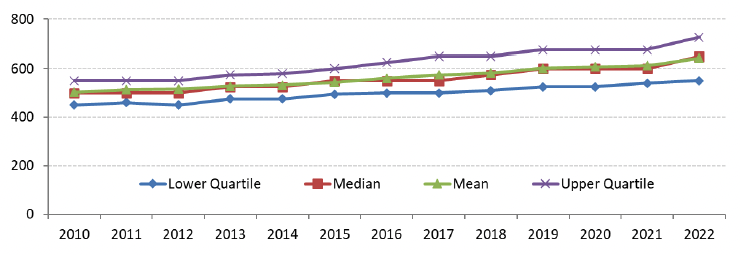
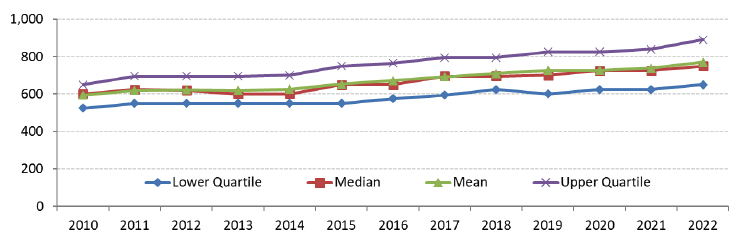
For all property sizes there have generally been slightly greater increases at the top end (upper quartile) than the bottom end (lower quartile) of the market between 2010 and 2022, which has resulted in a widening gap between top and bottom ends of the market.
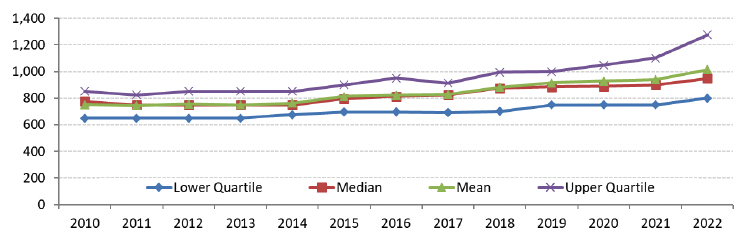
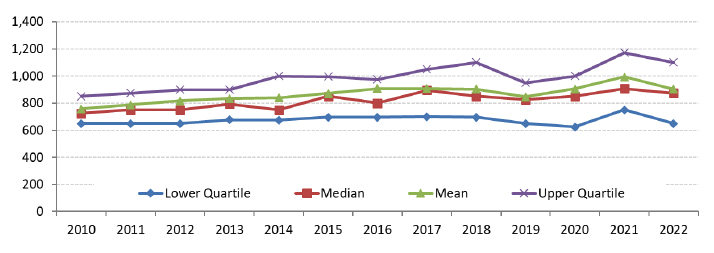
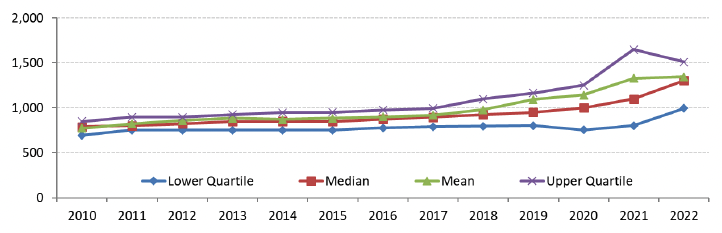
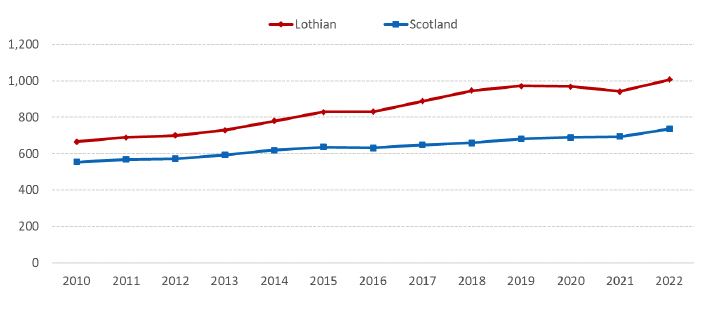
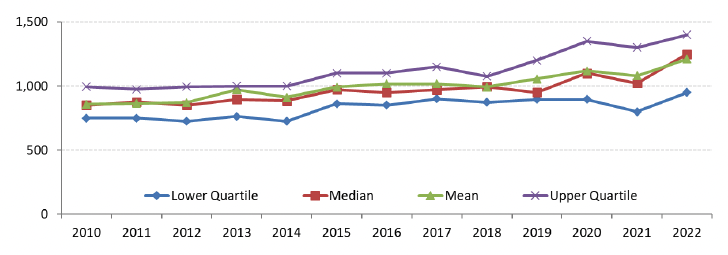
Broad Rental Market Area Profile – Lothian
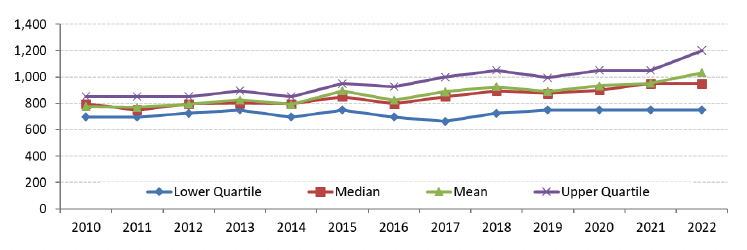
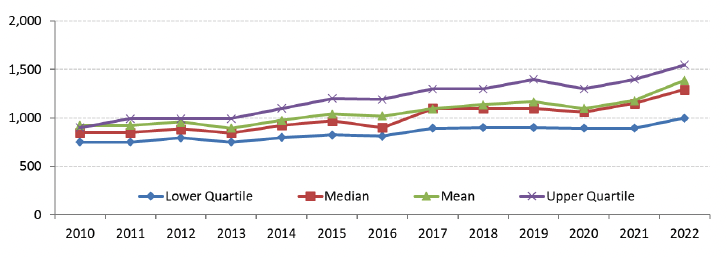
Note in the following text and charts that average rents that have changed within +/- 0.5% could be considered as being fairly similar to previous periods.
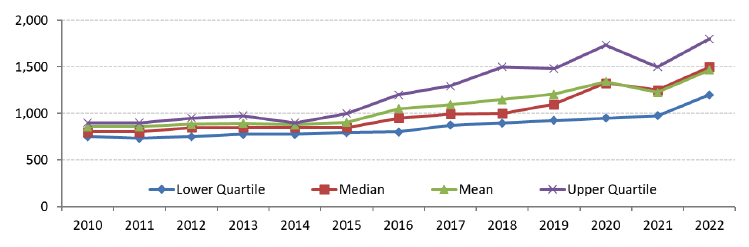
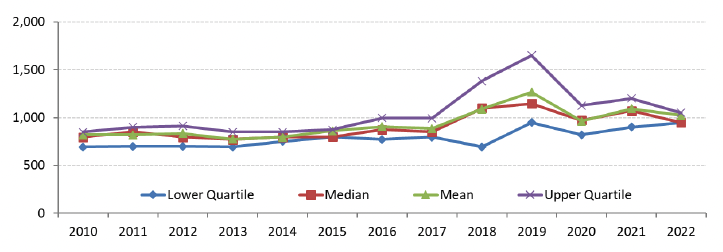
Average (mean) 2 bedroom rents in the Lothian area have been higher than the Scotland average in each year since 2010. This difference has grown more sharply since 2013, although has stabilised to some extent since 2018, with the average rent in 2022 being £1,006 per month, compared to the Scotland average of £736.
Between 2021 and 2022, average rents have increased across all property sizes, with increases for 1 bedroom (6.8%), 2 bedroom (6.9%), 3 bedroom (6.2%), 4 bedroom (8.8%) and 1 bedroom shared properties (4.9%), which compares to CPI inflation of 7.6% across this time period.
Between 2010 and 2022, average rents have increased above the rate of CPI inflation of 33.7% across all property sizes, with average rents increasing for 1 bedroom (55.1%), 2 bedroom (51.5%), 3 bedroom (50.6%), 4 bedroom (58.3%), and 1 bedroom shared properties (54.3%).
For all property sizes, since 2010 increases in the top end (upper quartile) of rents have generally been greater than increases in the bottom end (lower quartile), which has widened the gap in rents, although the gap narrowed slightly in 2021 for 2, 3, and 4 bedroom properties.
Broad Rental Market Area Profile – North Lanarkshire
Note in the following text and charts that average rents that have changed within +/- 0.5% could be considered as being fairly similar to previous periods.
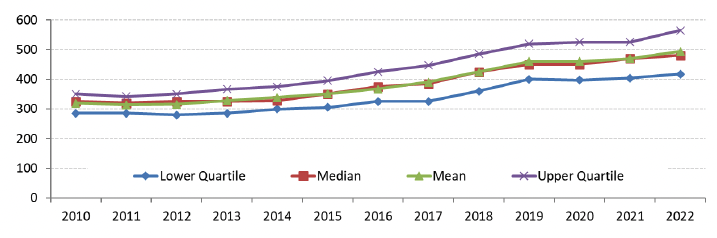
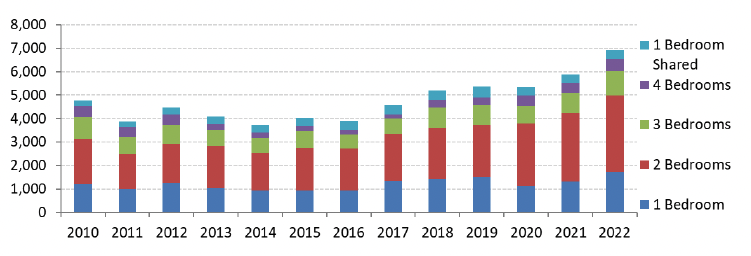
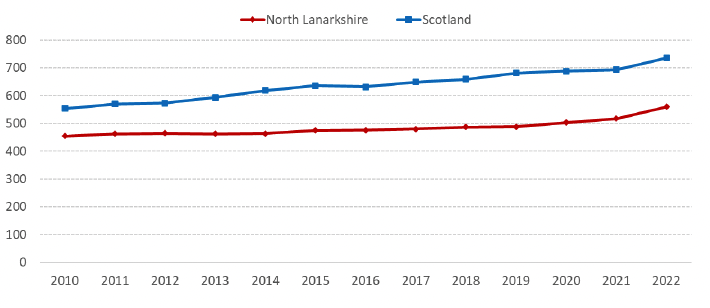
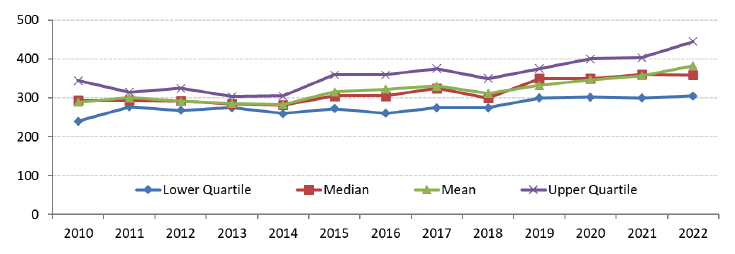
Average (mean) 2 bedroom rents in North Lanarkshire have been lower than the Scotland average in each year since 2010. This gap has widened since 2012, although has since narrowed slightly over the latest three years, with the average rent in 2022 being £560 per month, compared to the Scotland average of £736.
Between 2021 and 2022, average rents have increased for all property sizes, with increases seen for 1 bedroom (12.1%), 2 bedroom (8.3%), 3 bedroom (11.4%), 4 bedroom (8.5%) and 1 bedroom shared (10.2%) properties, which compares to CPI inflation of 7.6% across this time period.
Note that some caution is needed when interpreting the changes over time for 4 bedroom and 1 bedroom shared property size categories, given the smaller sample numbers for these categories, which can lead to greater volatility in the results presented, particularly for year on year trends.
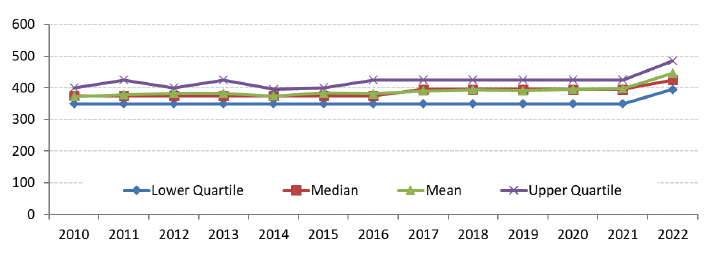
Between 2010 and 2022, average rents have increased below the rate of CPI inflation of 33.7% for 1 bedroom (19.7%), 2 bedroom (23.1%), 3 bedroom (21.8%) and 1 bedroom shared properties (26.8%), and have increased just below the rate of inflation for 4 bedroom properties (33.1%).
For 4 bedroom properties, since 2010 increases in the top end (upper quartile) of rents have generally been greater than increases in the bottom end (lower quartile), which has widened the gap in rents, although some caution is needed in interpreting this trend given the smaller sample numbers for this category.
Broad Rental Market Area Profile – Perth and Kinross
Note in the following text and charts that average rents that have changed within +/- 0.5% could be considered as being fairly similar to previous periods.
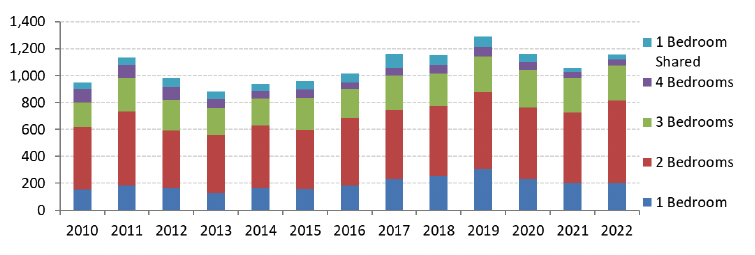
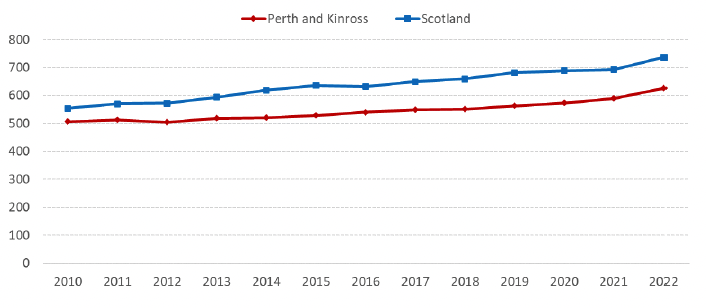
Average (mean) 2 bedroom rents in Perth and Kinross have been lower than the Scotland average in each year since 2010. The gap has widened since 2010, although has narrowed slightly in the latest two years, with the average rent in 2022 being £626 per month, compared to the Scotland average of £736.
Between 2021 and 2022, average rents have increased across all property sizes, with increases for 1 bedroom (4.3%), 2 bedroom (6.1%), 3 bedroom (10.3%), 4 bedroom (12.1%) and 1 bedroom shared properties (20.2%), which compares to CPI inflation of 7.6% across this time period.
Note that some caution is needed when interpreting the changes over time for 4 bedroom and 1 bedroom shared property size categories, given the smaller sample numbers for these categories, which can lead to greater volatility in the results presented, particularly for year on year trends.
Between 2010 and 2022, average rents have increased below the rate of CPI inflation of 33.7% for 1 bedroom (21.2%) and 2 bedroom (23.6%) properties, have increased by just under the rate of inflation for 3 bedroom (32.4%) properties, and and have increased above the rate of inflation for 4 bedroom (41.2%) and 1 bedroom shared properties (47.1%).
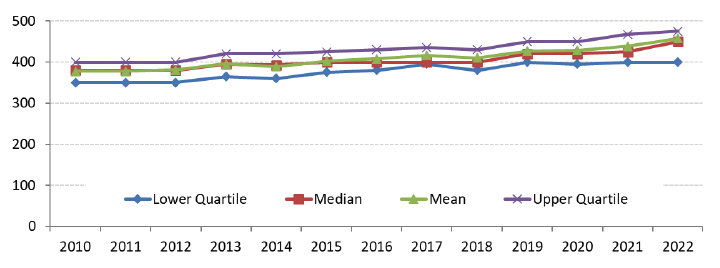
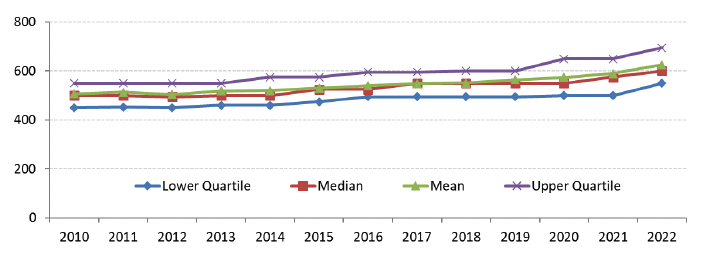
For 2, 3 and 4 bedroom properties, since 2019 there has been a greater increase in the top end (upper quartile) rents compared to the bottom end (lower quartile), which has caused a slight increase in the gap between the top and the bottom of the market.
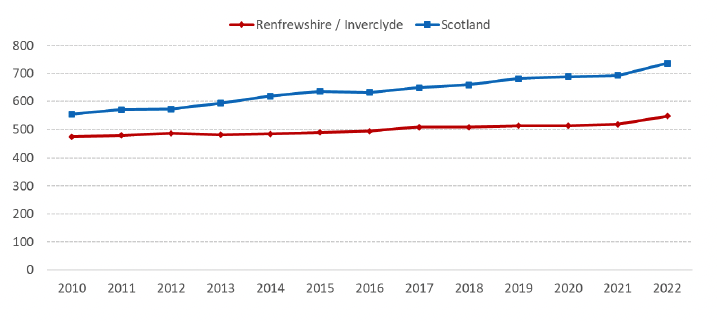
Broad Rental Market Area Profile – Renfrewshire / Inverclyde
Note in the following text and charts that average rents that have changed within +/- 0.5% could be considered as being fairly similar to previous periods.
Average (mean) 2 bedroom rents in Renfrewshire / Inverclyde have been lower than the Scotland average in each year since 2010, and the gap has widened since 2012, with the average rent in 2022 being £547 per month, compared to the Scotland average of £736.
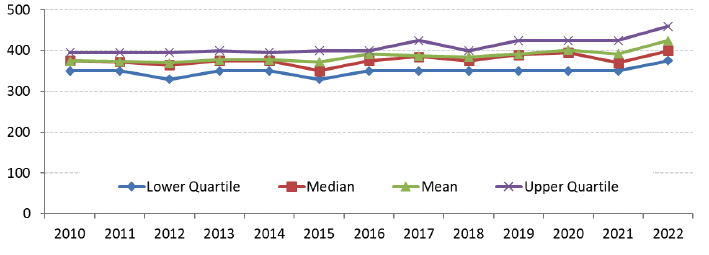
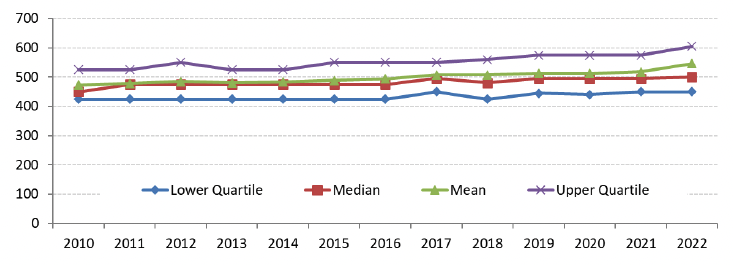
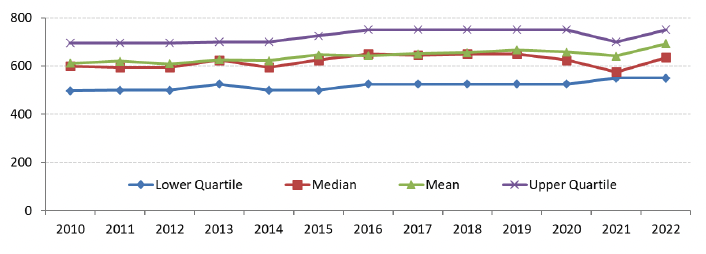
Between 2021 and 2022, average rents have increased across all property sizes, with increases for 1 bedroom (8.4%), 2 bedroom (5.6%), 3 bedroom (8.1%), 4 bedroom (5.5%) and 1 bedroom shared properties (11.7%), which compares to CPI inflation of 7.6% across this time period.
Note that some caution is needed when interpreting the changes over time for 4 bedroom and 1 bedroom shared property size categories, given the smaller sample numbers for these categories, which can lead to greater volatility in the results presented, particularly for year on year trends.
Between 2010 and 2022, average rents have increased below the rate of CPI inflation of 33.7% for 1 bedroom (13.4%), 2 bedroom (15.6%), 3 bedroom (13.4%) and 1 bedroom shared properties (25.0%), and have increased above the rate of inflation for 4 bedroom properties (56.7%).
For 1 bedroom shared properties, the gap between the top (upper quartile) and the bottom (lower quartile) of the market has increased slightly since 2019.
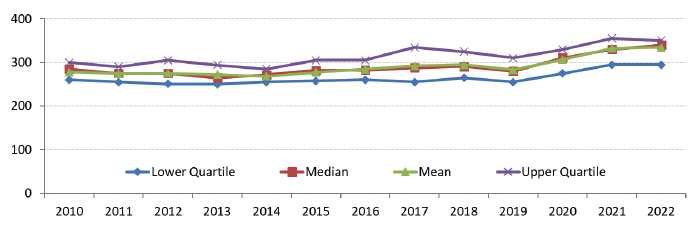
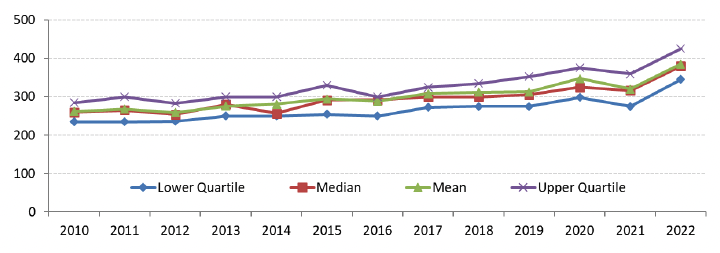
Broad Rental Market Area Profile – Scottish Borders
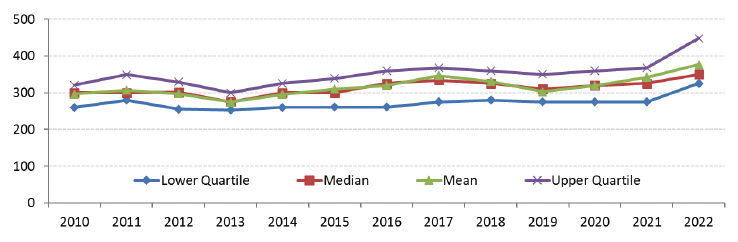
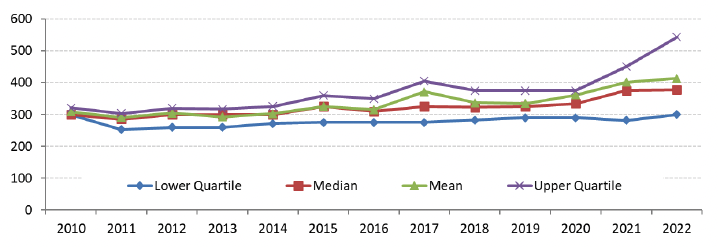
Note in the following text and charts that average rents that have changed within +/- 0.5% could be considered as being fairly similar to previous periods.
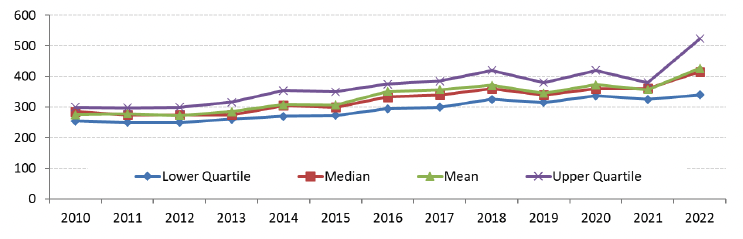
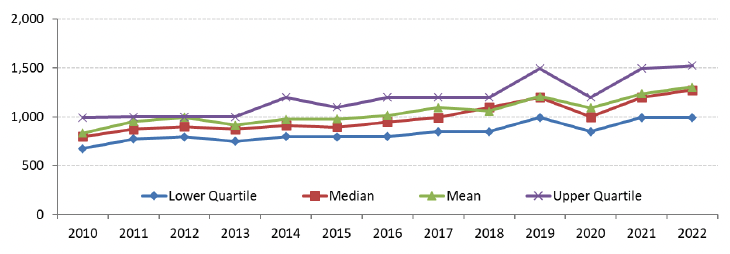
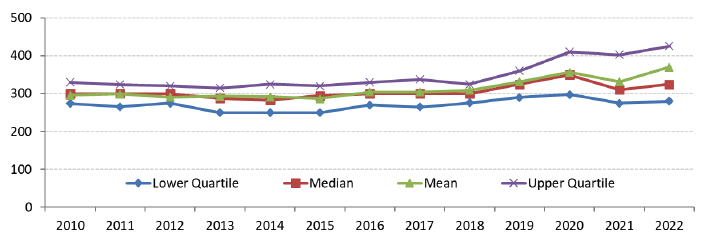
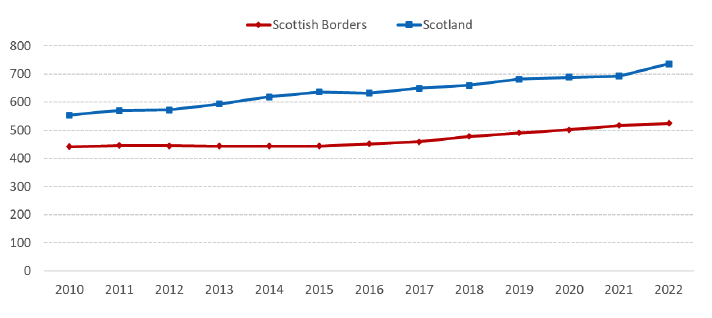
Average (mean) 2 bedroom rents in the Scottish Borders have been lower than the Scotland average in each year since 2010, with the gap widening between 2010 and 2015 and then remaining fairly stable until the latest year when it increased again.The average rent in 2022 being £525 per month, compared to the Scotland average of £736.
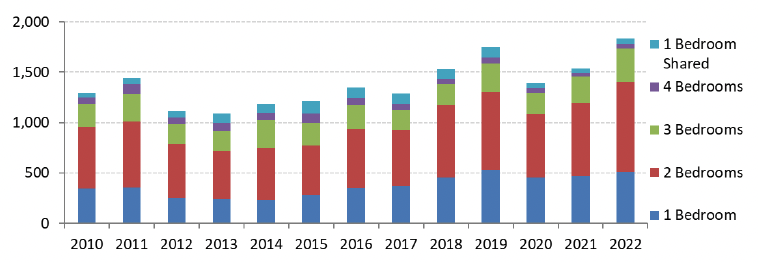
Between 2021 and 2022, average rents have increased across all property sizes, with increases for 1 bedroom (2.6%), 2 bedroom (1.7%), 3 bedroom (1.0%), 4 bedroom (7.1%) and 1 bedroom shared properties (13.9%), which compares to CPI inflation of 7.6% across this time period.
Note that some caution is needed when interpreting the changes over time for 4 bedroom and 1 bedroom shared property size categories, given the smaller sample numbers for these categories, which can lead to greater volatility in the results presented, particularly for year on year trends.
Between 2010 and 2022, average rents have increased below the rate of CPI inflation of 33.7% for 1 bedroom (18.1%) and 2 bedroom (18.9%) properties, have increased just under the rate of inflation for 3 bedroom (30.1%), have increased above the rate of inflation for 1 bedroom shared properties (39.8%), and have increased well above the rate of inflation for 4 bedroom properties (64.1%).
Since 2019, the gap between the top end rents (upper quartile) and the bottom end (lower quartile) has increased most for 3 bedroom and 4 bedroom properties.
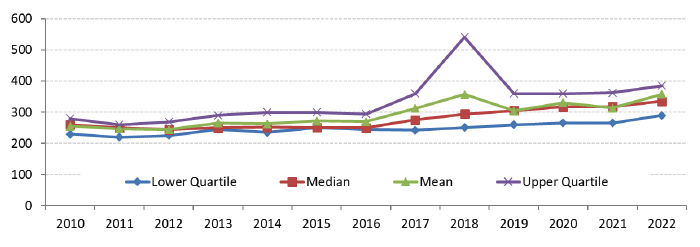
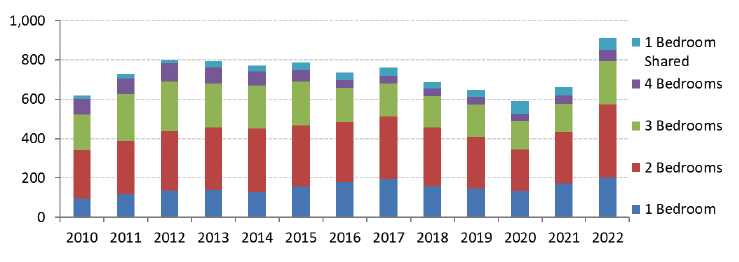
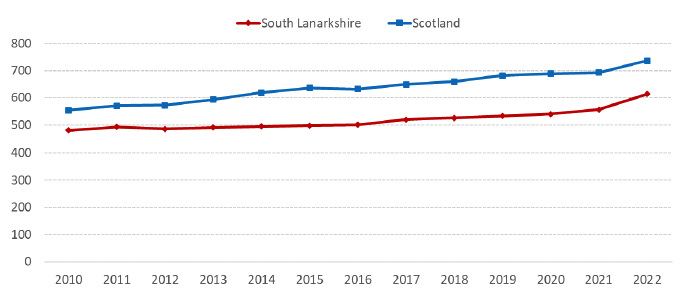
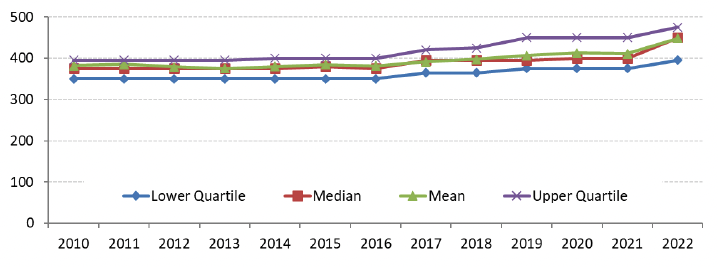
Broad Rental Market Area Profile – South Lanarkshire
Note in the following text and charts that average rents that have changed within +/- 0.5% could be considered as being fairly similar to previous periods.
Average (mean) 2 bedroom rents in South Lanarkshire have been lower than the Scotland average in each year since 2010. The gap widened after 2011 although has since narrowed slightly in the latest two years, with the average rent in 2022 being £613 per month, compared to the Scotland average of £736.
Between 2021 and 2022, average rents have increased across all property sizes, with increases for 1 bedroom (9.0%), 2 bedroom (10.3%), 3 bedroom (11.0%), 4 bedroom (17.7%) and 1 bedroom shared properties (2.9%), which compares to CPI inflation of 7.6% across this time period.
Note that some caution is needed when interpreting the changes over time for 4 bedroom and 1 bedroom shared property size categories, given the smaller sample numbers for these categories, which can lead to greater volatility in the results presented, particularly for year on year trends.
Between 2010 and 2022, average rents have increased below the rate of CPI inflation of 33.7% for 1 bedroom (17.2%), 2 bedroom (27.7%) and 3 bedroom (29.6%) properties, have increased around the same as the rate of inflation for 1 bedroom shared properties (33.6%), and have increased above the rate of inflation for 4 bedroom properties (50.4%).
For all property sizes, since 2010 increases in the top end (upper quartile) of rents have generally been slightly greater than increases in the bottom end (lower quartile), which has widened the gap in rents slightly.
Broad Rental Market Area Profile – West Dunbartonshire
Note in the following text and charts that average rents that have changed within +/- 0.5% could be considered as being fairly similar to previous periods.
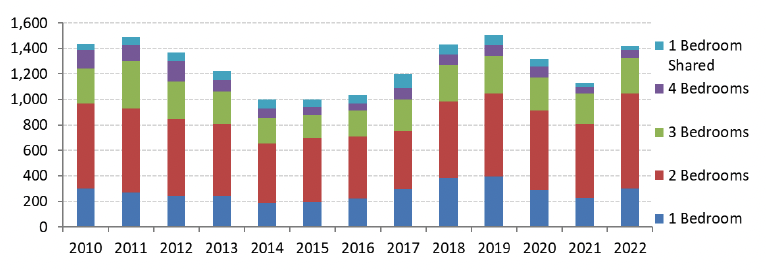
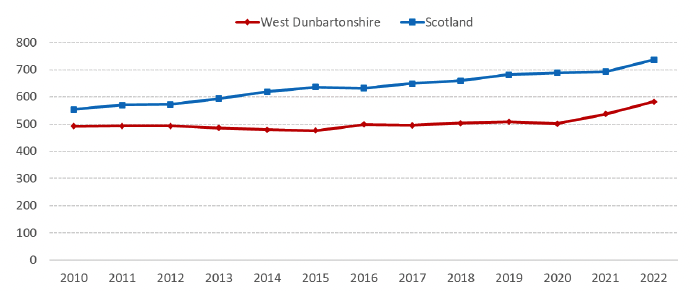
Average (mean) 2 bedroom rents in West Dunbartonshire have been lower than the Scotland average in each year since 2010. The gap has widened since 2012, although has since narrowed in the latest two years, with the average rent in 2022 being £582 per month, compared to the Scotland average of £736.
Between 2021 and 2022 average rents have increased for 1 bedroom (6.0%), 2 bedroom (8.3%), 3 bedroom (8.4%), and 1 bedroom shared (7.2%) properties, and have decreased for 4 bedroom properties (-6.2%), which compares to CPI inflation of 1.5% across this time period.
Note that some caution is needed when interpreting the changes over time for 3 and 4 bedroom and 1 bedroom shared property size categories, given the smaller sample numbers for these categories, particularly the 4 bedroom category which has seen some very small sample sizes in recent years. This can lead to greater volatility in the results presented, particularly for year on year trends.
Between 2010 and 2022, average rents have increased below the rate of CPI inflation of 33.7% for 1 bedroom (12.1%), 2 bedroom (18.2%), 3 bedroom (23.2%) and 4 bedroom (24.7%) properties, and have increased just below the rate of inflation for 1 bedroom shared properties (32.4%).
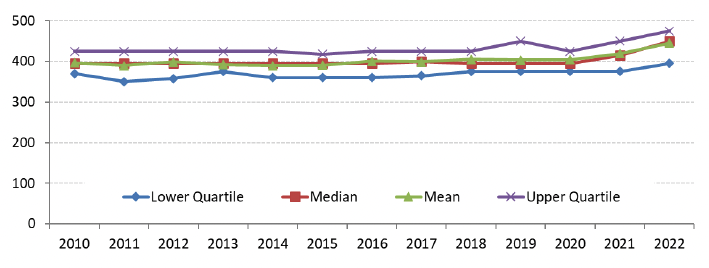
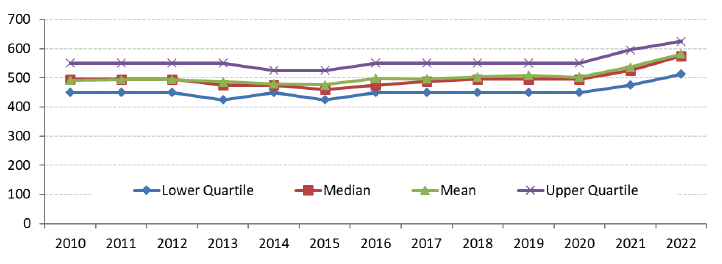
Since 2019 the gaps between rents at the top end (upper quartile) and the bottom end (lower quartile) has widened the most for 3 bedroom properties.
Broad Rental Market Area Profile – West Lothian
Note in the following text and charts that average rents that have changed within +/- 0.5% could be considered as being fairly similar to previous periods.
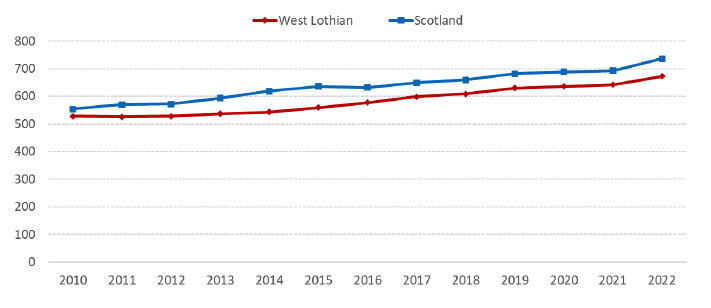
Average (mean) 2 bedroom rents in West Lothian have been lower than the Scotland average in each year since 2010, with the average rent in 2022 being £673 per month, compared to the Scotland average of £736.
Between 2021 and 2022, average rents have increased across all property sizes, with increases for 1 bedroom (3.5%), 2 bedroom (4.7%), 3 bedroom (12.1%), 4 bedroom (8.3%) and 1 bedroom shared properties (15.6%), which compares to CPI inflation of 7.6% across this time period.
Note that some caution is needed when interpreting the changes over time for 4 bedroom and 1 bedroom shared property size categories, given the smaller sample numbers for these categories, which can lead to greater volatility in the results presented, particularly for year on year trends.
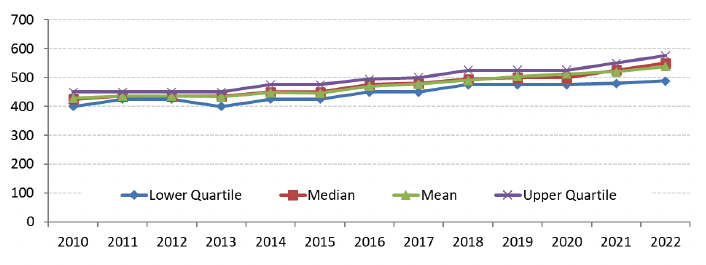
Between 2010 and 2022, average rents have increased below the rate of CPI inflation of 33.7% for 1 bedroom (25.8%) and 2 bedroom (27.5%) properties, and have increased above the rate of inflation for 3 bedroom (42.2%), 4 bedroom (50.8%) and 1 bedroom shared properties (38.7%).
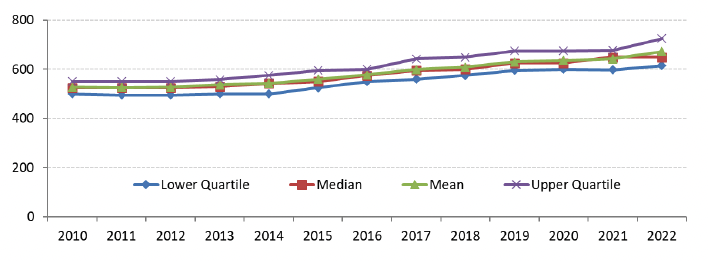
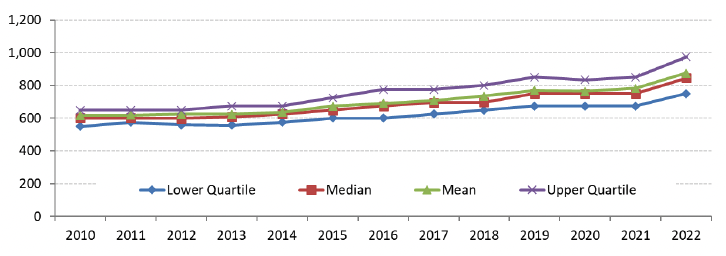
For 3 and 4 bedroom properties, increases at the top end of the market (upper quartile) between 2010 and 2021 have generally been higher than increases in the bottom end (lower quartile) increasing the gap in rents between the top and bottom of the market slightly.
Contact
Email: housingstatistics@gov.scot