Private sector rent statistics: 2010 - 2021
This publication presents statistics on average private sector rent levels in Scotland by Broad Rental Market Area and size of property, for the years 2010 to 2021.
Part of
8. Scotland-level Average Rents
Note that as with the previous publication, Scotland figures have been calculated using a weighted stock approach based on separate Scottish Household Survey data on the profile of stock by area and property size over time, although for this publication the weights used for the rental year 2020 have been rolled forward for the rental year 2021 due to the latest annual Scottish Household Survey figures being unavailable.
The use of a weighted stock approach aims to help ensure that the national average figures presented reflect the underlying composition of private rental properites over time, and to minimise any effects of changes to sample numbers achieved for particular property sizes or areas in any given years.
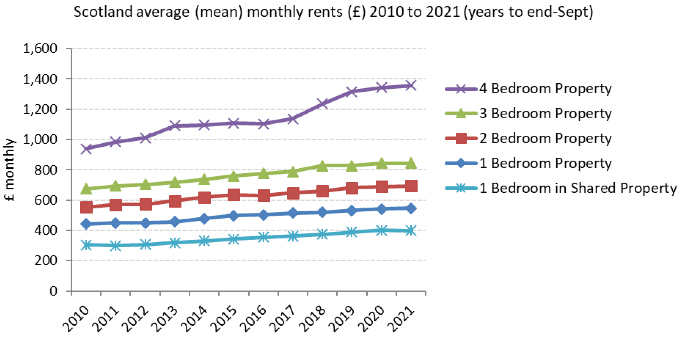
Table 6 and Chart 12 below provide a summary of Scotland level changes to average (mean) rental prices over the years 2010 to 2021.
| 2010 | 2011 | 2012 | 2013 | 2014 | 2015 | 2016 | 2017 | 2018 | 2019 | 2020 | 2021 | |
|---|---|---|---|---|---|---|---|---|---|---|---|---|
| 1 Bedroom Property | 442 | 451 | 449 | 457 | 480 | 498 | 503 | 515 | 520 | 532 | 542 | 546 |
| 2 Bedroom Property | 554 | 570 | 573 | 594 | 619 | 636 | 632 | 649 | 659 | 681 | 689 | 693 |
| 3 Bedroom Property | 674 | 693 | 704 | 717 | 737 | 759 | 776 | 788 | 827 | 826 | 844 | 844 |
| 4 Bedroom Property | 939 | 985 | 1,010 | 1,092 | 1,096 | 1,109 | 1,104 | 1,138 | 1,237 | 1,316 | 1,342 | 1,358 |
| 1 Bedroom in Shared Property | 305 | 299 | 306 | 318 | 330 | 344 | 356 | 363 | 376 | 390 | 400 | 398 |
| 2010 to 2011 | 2011 to 2012 | 2012 to 2013 | 2013 to 2014 | 2014 to 2015 | 2015 to 2016 | 2016 to 2017 | 2017 to 2018 | 2018 to 2019 | 2019 to 2020 | 2020 to 2021 | 2010 to 2021 | |
|---|---|---|---|---|---|---|---|---|---|---|---|---|
| (annual change) | (annual change) | (annual change) | (annual change) | (annual change) | (annual change) | (annual change) | (annual change) | (annual change) | (annual change) | (annual change) | (11 year cumulative change | |
| 1 Bedroom Property | 2.0% | -0.4% | 1.8% | 4.9% | 3.8% | 1.1% | 2.3% | 1.0% | 2.4% | 1.8% | 0.6% | 23.5% |
| 2 Bedroom Property | 2.9% | 0.5% | 3.7% | 4.2% | 2.7% | -0.7% | 2.7% | 1.6% | 3.3% | 1.1% | 0.6% | 25.1% |
| 3 Bedroom Property | 2.9% | 1.5% | 2.0% | 2.7% | 3.0% | 2.3% | 1.5% | 4.9% | -0.1% | 2.2% | 0.0% | 25.3% |
| 4 Bedroom Property | 4.9% | 2.6% | 8.1% | 0.3% | 1.2% | -0.5% | 3.1% | 8.7% | 6.4% | 2.0% | 1.2% | 44.7% |
| 1 Bedroom in Shared Property | -2.1% | 2.3% | 4.0% | 3.6% | 4.4% | 3.5% | 1.9% | 3.4% | 3.9% | 2.5% | -0.4% | 30.4% |
Notes:
Figures exclude any studio properties, properties with 5 or more bedrooms, or room rents associated with bed and breakfast lodgings.
Figures for rooms in shared properties represent "rent only", i.e. exclude any payments for shared services.
Note that Scotland figures have been calculated using a weighted stock approach.
*Note that the Scotland figures have been calculated using a weighted stock approach.
From Table 6, it can be seen that estimated average (mean) rents at a Scotland level have increased for all property sizes over the period from 2010 to 2021 (cumulative increases over 11 years).
The greatest cumulative increase over the 10 years from 2010 to 2021 has been for 4 bedroom properties (estimated 44.7% increase). Average rents for 1 bedroom shared properties have seen a cumulative estimated increase of 30.4%, whilst average rents for 3 bedroom properties have increased by 25.3%, average rents for 2 bedroom properties have increased by 25.1%, and average rents for 1 bedroom properties have increased by 23.5%.
These cumulative increases equate to annualised growth rates of 1.9%, 2.1%, 2.1%, 3.4% and 2.4% for 1 to 4 bedroom and 1 bedroom shared properties respectively, when calculated on a compound annual increase basis between 2010 and 2021.
In the latest year, average rents are estimated to have risen for 1 bedroom (0.6%), 2 bedroom (0.6%) and 4 bedroom (1.2%) properties, with average rents for 3 bedroom properties showing no change (0.0%), and rents for 1 bedroom shared properties falling by 0.4%.
Summary of weighted stock methodology used in this publication:
Stock based weights for rented properties have been derived from Scottish Household Survey data, with the aim that this is to help ensure that the national average figures presented reflect any changes to the underlying composition of private rental properites over time, and to minimise any effects of changes to sample numbers achieved for particular property sizes or areas in any given years.
Weights for stock by Broad Rental Market Area have been built up by using an approximate mapping of local authority areas to Broad Rental Market Areas.
The weights from the survey data have been constructed using 3 year rolling data periods to help with precision of results at Broad Rental Market Area and to smooth out annual variations seen in the survey results. Each 3 year data period being centred on the rental year to be estimated with a lag applied of 2 years, due to the time delay between 3 year survey results being available and the latest rental year in question. For example in the previous publication, for the rental year 2020, a 3 year data period 2017 to 2019 was used to construct the stock based weights, which equates to the year 2020 lagged by two years (i.e. to be centred on 2018).
One aspect to note for this publication is that given that the Scottish Household Survey results for the year 2020 are not available.[9] the previous set of weights based on the 3 year data period 2017 to 2019 have been rolled forward as the basis for the rental year 2021.
For each property size category, the stock based weights are based on the proportion of private rented households in this category that are located in each of the Broad Rental Market Areas. These weights are then used as part of a weighted average calculation in constructing the Scotland level average rent estimates.
For example for 2 bedroom properties, if the 3 year survey data estimates that 10% of private rented properties of this size are located in a particular Broad Rental Market Area, then this 10% figure is multiplied by the average (mean) rental amount for this area when constructing the overall weighted average calculation.
The same methodology has been applied across all other property size categories, except for 1 bedroom shared properties where the weightings are instead based on the estimated proportions of owner occupier or private rented households in each areas that contain two or more adults who are not related or who are not in a married / civil partnership or a co-habiting partnership.
This aims to identify households where there may be an individual room being rented in some form. A combination of owner occupier and private rented households have been used as the basis for these weights given that individual rooms being rented are likely to be mix of lodger type situations where the tenure of the property is owner occupier with an individual room being rented out, along with private rented properties in which rooms may be rented out individually.
Contact
Email: housingstatistics@gov.scot